Figure 1.
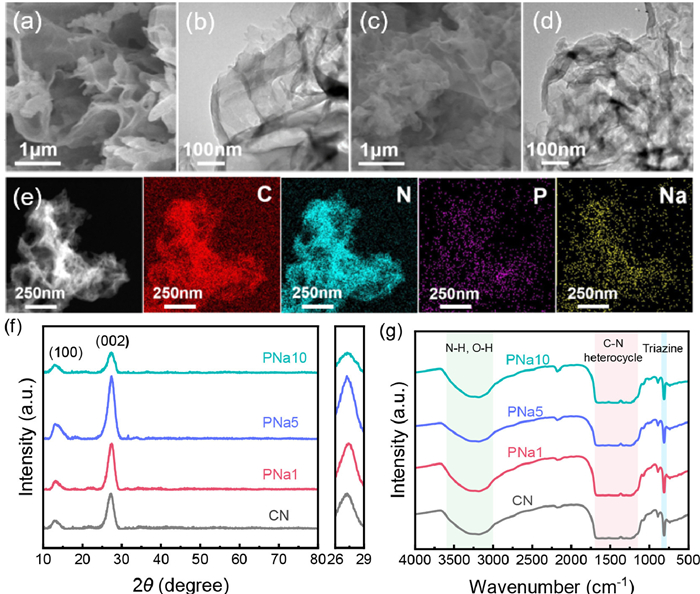
SEM images of (a) CN and (c) PNa5, TEM images of (b) CN and (d) PNa5. (e) The EDS mapping images of PNa5, (f) XRD patterns and (g) FT-IR spectra of the prepared photocatalysts.
Rational design of dual sites induced local electron rearrangement for enhanced photocatalytic oxygen activation
Ruru Li , Qian Liu , Hui Li , Fengbin Sun , Zhurui Shen

Antibiotics in wastewater can threaten the aquatic environment due to the low concentration, persistence, and residual toxicity [1,2]. Advanced oxidation processes (AOPs) have been widely applied in water remediation owing to their capacity to generate high quantities of reactive oxygen species (ROS) [3,4]. However, in most AOPs, compounds like PMS, H2O2, O3, etc. were often used as strong oxidants or as an input of electricity to promote the generation of ROS in order to remove contaminants [5–7]. Nevertheless, this greatly increases the cost and energy consumption, and the residual compounds also cause environmental pollution [8]. Therefore, there is a need to develop environmentally friendly, efficient, and renewable wastewater treatment technology.
Molecular oxygen (O2) has a significant effect on ROS generation due to its advantages of non-toxic, green and abundant sources [9]. Studies have shown that electrons (e−), holes (h+) and energy can be captured by O2 and H2O to generate various ROS such as •O2−, H2O2, •OH and 1O2, which have an essential role in pollutant elimination [10–12]. However, enhancing the activation efficiency of O2 is impeded by the lack of active sites on the catalyst surface and the rapid recombination of photogenerated charges [13,14]. Heteroatom doping is deemed effective for the separation of electron‐hole pairs and migration to improve photocatalytic performance [15,16]. Asymmetric doping has been found to modify the electronic structure and enhance catalytic performance [17]. Nevertheless, previous reports commonly concentrated on the impacts of energy band structure and carrier separation on photocatalytic performance. The activation process of O2 also depends on the electron distribution on the catalyst surface. Hence, it is necessary to regulate the electronic state and distribution on the catalyst to make it favorable for O2 adsorption and activation, which is a challenge for catalyst design. Therefore, there are few literatures about this problem.
In this paper, a strategy for activating O2 by rearranging the local electrons distribution was proposed. Carbon nitride with P and Na co-doping (PNaCN) was formed through a straightforward thermal condensation method. The experimental results indicated that PNa5 presented an optimal ability to activate O2 and degrade tetracycline (TC), which can be attributed to its potent O2 adsorption and charge transfer. In addition, in-situ O2 fitting Fourier transform infrared (FTIR) spectroscopy was innovatively used to demonstrate the generation of •O2−. Density functional theory (DFT) further revealed that after the rearrangement of local electrons, O2 tended to adsorb on the electron-deficient P sites, and the electron-rich Na sites provided support for the charge transfer to O2. This study offered a rational strategy of local electrons rearrangement to design photocatalysts with efficient activation of O2 for contaminants removal.
Scanning electron microscopy (SEM) and transmission electron microscopy (TEM) were employed to observe the morphologies of the photocatalysts. As shown in Figs. 1a–d, both CN and PNa5 were composed of layered two-dimensional nanosheets. The energy dispersive X-ray spectroscopy (EDS) mapping in Fig. 1e revealed the uniform distribution of the four elements in PNa5. Inductively coupled plasma (ICP) was used to further confirm the doping content of the elements P and Na in Table S1 (Supporting information). The X-ray diffraction (XRD) spectrum presented two diffraction peaks at 12.9° and 27.2°, corresponding to the (100) and (002) crystal planes, respectively (Fig. 1f and Fig. S1 in Supporting information) [18]. The (100) plane was related to the repeated to units of the triazine ring and interlayer stacking was attributed to the (002) plane [19]. Notably, the intensity of (100) and (002) plane in PNaCN gradually strengthened and exhibited a slight shift to higher angles with increasing NaH2PO2·H2O amount. This was due to the presence of P and Na in the triazine ring, resulting in the interlayer compression [20]. Compared with CNP and CNNa, PNa5 had a higher intensity in (100) and (002) plane. Reduced spacing facilitated photogenerated carrier transport. However, the (100) and (002) peaks of PNa10 decreased obviously, which can be attributed to the destroyed triazine ring structure and expanded layer spacing.
The chemical structure of the catalysts was characterized by Fourier-transform infrared spectra (FT-IR). There were no significant changes after doping, demonstrating the CN structure was mainly preserved. In Fig. 1g, the peak located at 810 cm−1 corresponded to the bending vibration of the triazine ring [21]. The absorption bands at 1150–1700 cm−1 were ascribed to the stretching vibrations of C—N heterocyclic rings and the wide peaks at 3000–3600 cm−1 were caused by the N—H and O—H stretches derived from surface adsorbed water and amino groups [22,23]. Few P-related functional groups were observed, especially the P-N stretching pattern at 950 cm−1, probably because the content was so low that it was overlapped by C—N vibrations [24,25]. The specific surface areas had no significant surface area changes (Fig. S2 in Supporting information).
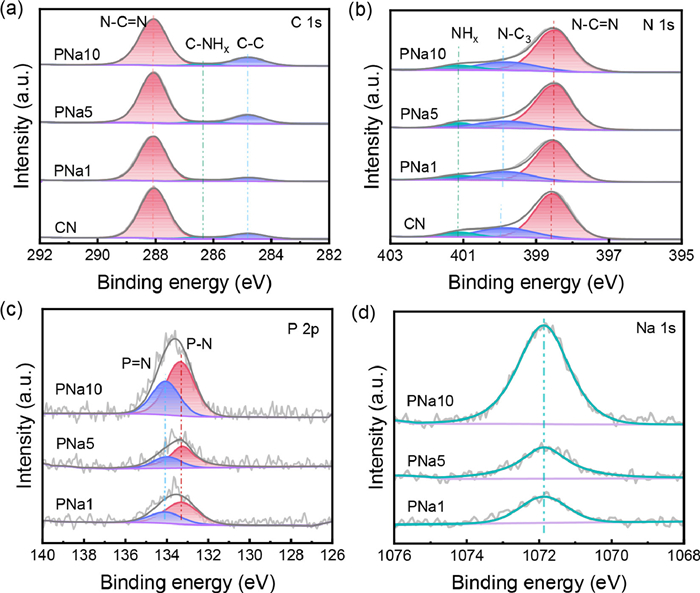
X-ray photoelectron spectroscopy (XPS) was employed to evaluate the chemical states (Fig. 2 and Figs. S3–S5 in Supporting information). Three characteristic peaks appeared in the C 1s spectra located at 288.1 eV, 286.4 eV, and 284.8 eV, corresponding to N—C=N, CNHx, and C—C, respectively [26]. The N 1s spectra contained three distinct peaks positioned at approximately 401.1 eV, 399.8 eV and 398.6 eV. The binding energy at 401.1 eV corresponded to the surface unpolymerized NHx. The peak at 399.8 eV was correlated with the bridging of N atoms in N—C3. The peak at 398.6 eV was the sp2 hybridization of C=N—C [27]. The P atoms replaced either the corner carbon or bay carbon in the CN structure, as suggested by the typical P-N and P=N coordination identified in the P 2p peaks at 133.3 eV and 134.0 eV [28]. The Na 1s spectra presented a peak at 1071.9 eV confirming that the Na atoms were doped in the triazine ring. This is because N atoms containing more lone pair electrons tend to coordinate with metal ions [29]. It was noteworthy that C=N-C and N—C3 in PNa1, PNa5 and PNa10 shifted slightly towards lower binding energies, probably as a result of the interaction between P, Na and N atoms, rearranging the local electrons and increasing electron density near N atoms [30].
The UV–vis diffuse reflectance spectrum (UV–vis DRS) was used to describe the light absorption capacity and calculate the band gap energies (Eg). In Fig. S6a (Supporting information), the absorption edge underwent a slight red shift after the introduction of P and Na compared to the original CN. As shown in Fig. S6b (Supporting information), the Eg values of CN, PNa1, PNa5 and PNa10 were 2.87, 2.89, 2.84 and 2.86 eV, respectively. The narrower Eg of PNa5 can increase light absorption and excite more e− and h+ [2]. The valence band energies (EVB) of CN, PNa1, PNa5 and PNa10 were 2.18, 2.09, 2.05 and 2.02 eV (Fig. S6c in Supporting information), and the conduction band energies (ECB) were obtained based on the equation ECB = EVB - Eg, which were −0.69, −0.80, −0.79 and −0.84 V, respectively. The corresponding band structure is displayed in Fig. S6d (Supporting information). The e− of the samples at CB can transform O2 into •O2− due to the more negative ECB values than O2/•O2−. However, the VB position of the samples had not been corrected with respect to •OH/H2O, so the h+ on VB cannot oxidize H2O to produce •OH.
In general, a narrow bandgap is advantageous for increasing light absorption and promoting charge transfer. Therefore, an examination of the carrier recombination was carried out using steady-state photoluminescence (PL) spectroscopy. As shown in Fig. S6e (Supporting information), CN exhibited intense PL signal. However, as doping amount increased, the PL signal diminished. This proved that the introduction of Na and P can significantly suppress carrier recombination. The photoelectrochemical properties were then analyzed. Figs. S6f and S7 (Supporting information) show the electrochemical impedance spectra (EIS) and transient photocurrent spectra, respectively. Compared to CN, PNa5 had a smaller curve radius and higher photocurrent response, indicating its better charge migration and separation ability [31].
TC was chosen as a typical antibiotic to evaluate the photocatalytic performance of the prepared samples. The equilibrium adsorption properties of the materials were investigated by dark adsorption experiments with 20 ppm TC before the experiments started. As shown in Figs. S8 and S9 (Supporting information), the materials reached equilibrium after 30 min of adsorption. Furthermore, PNa5 exhibited a greater adsorption capability. Afterwards, the photodegradation performance of the samples was evaluated. In Fig. 3a, PNa5 exhibited the optimal degradation performance, capable of degrading approximately 80% of TC after 120 min of light exposure. However, CN, PNa1, and PNa10 could only remove 48%, 65%, and 68% of TC. The UV–vis spectrum revealed a gradual decrease in TC signal at a 357 nm wavelength and a shift towards shorter wavelengths (Fig. S10 in Supporting information). This could be attributed to the conversion of TC into other compounds, in line with the degradation curve. Furthermore, a first-order kinetic model was utilized to determine photocatalytic rate. In Fig. S11 (Supporting information), all samples showed a good linear relationship. Furthermore, PNa5 had the highest photocatalytic reaction rate of 0.01342 min−1, which was 2.44 times higher than the original CN (0.00550 min−1) (Fig. 3b). In addition, CNP and CNNa were used as control catalysts to observe the effect of P and Na alone on degradation performance. As shown in Fig. S12 (Supporting information), CNP and CNNa presented about 64% and 65% TC degradation efficiency within 120 min, respectively, which was lower than PNa5. In the cyclic experiment, PNa5 was washed three times after each reaction. After 3 cycles, the photodegradation efficiency decreased slightly (Fig. 3c). The element content before and after PNa5 reaction was measured by ICP. It can be seen from the Table S2 (Supporting information) that the element content of Na and P decreased after three cycles. The chemical state of PNa5 remained stable after reaction (Fig. S13 in Supporting information). However, quality loss occurred when sample was recovered. Therefore, the decrease in cycle performance was attributed to mass loss and the decrease in the amount of element doping. The above results indicated the simultaneous introduction of P and Na into CN has promising application prospects in antibiotic water pollution.
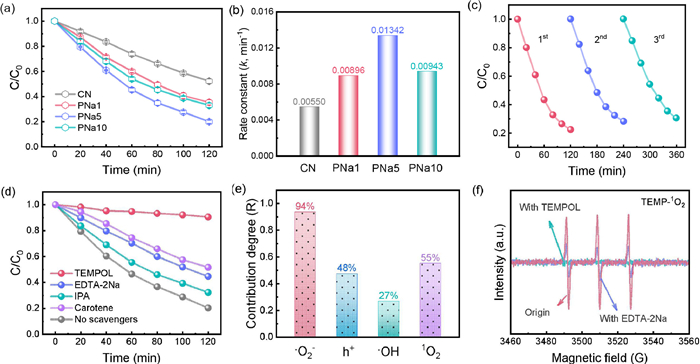
The capture experiments were investigated to illustrate the degradation mechanism. TEMPOL, EDTA-2Na, isopropanol (IPA) and carotene were selected as the scavengers for •O2−, h+, •OH and 1O2. The concentration of all scavengers used was 1 mmol/L. In Fig. 3d, after the addition of TEMPOL, PNa5 had almost no degradation activity on TC. The removal efficiency decreased from 80% to 48% and 53% after the addition of carotene and EDTA-2Na, while IPA had little effect on the system. After adding TEMPOL, EDTA-2Na, IPA and carotene, the reaction constants decreased to 0.00080, 0.00678, 0.00946 and 0.00578 min−1, respectively (Fig. S14 in Supporting information). This was an indication of the important role of •O2−, h+ and 1O2. The similar trends of CN, PNa1, PNa10, CNNa, and CNP were shown in Figs. S15 and S16 (Supporting information).
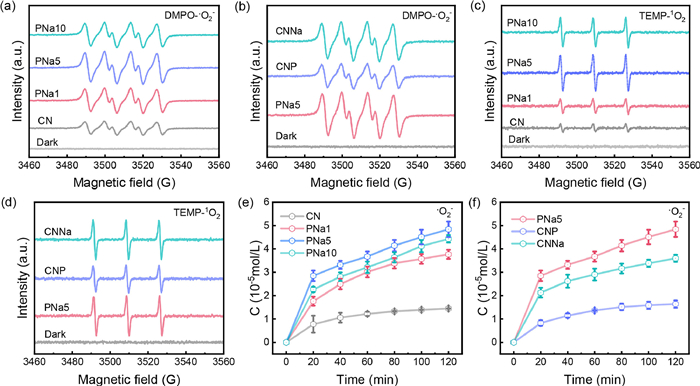
In general, the generation of ROS determined the efficiency of pollutant removal. To investigate the ability of the catalysts to produce ROS, the electron spin resonance (ESR) was used to make an assessment of •O2− and 1O2. The reaction between NBT and •O2− was also used to quantitatively analyze the concentration of •O2−. As depicted in Figs. 4a–d, there was no signal observed in the absence of light. Strikingly, under 10 min of illumination, four DMPO-•O2− peaks were detected with equal signal intensity of 1:1:1:1. In Fig. 4a, PNa5 had the strongest signal, indicating its optimal O2 activating ability. The quantitative experiments of •O2− further confirmed this phenomenon. In Fig. 4e, the •O2− concentration of PNa5 (48.40 µmol/L) was higher than that of CN (14.48 µmol/L), PNa1 (37.66 µmol/L) and PNa10 (44.31 µmol/L) within 120 min. Besides, the TEMP-1O2 signals were observed with a peak strength of 1:1:1, and PNa5 had the strongest signal, indicating that it could produce more 1O2. To further compare the effects of P and Na monodoping on ROS generation, the corresponding ROS tests of CNNa and CNP were performed. The results showed that for •O2−, the signal intensity was PNa5 > CNNa > CNP (Fig. 4b). Furthermore, the •O2− produced by PNa5 was 1.37 times that of CNNa (35.99 µmol/L) and 3.09 times that of CNP (16.40 µmol/L) (Fig 4f). A similar trend was observed in tests of 1O2 (Figs. 4c and d). The determination of •O2− concentration in different atmospheres indicated that •O2− originated from O2 (Fig. S17 in Supporting information).
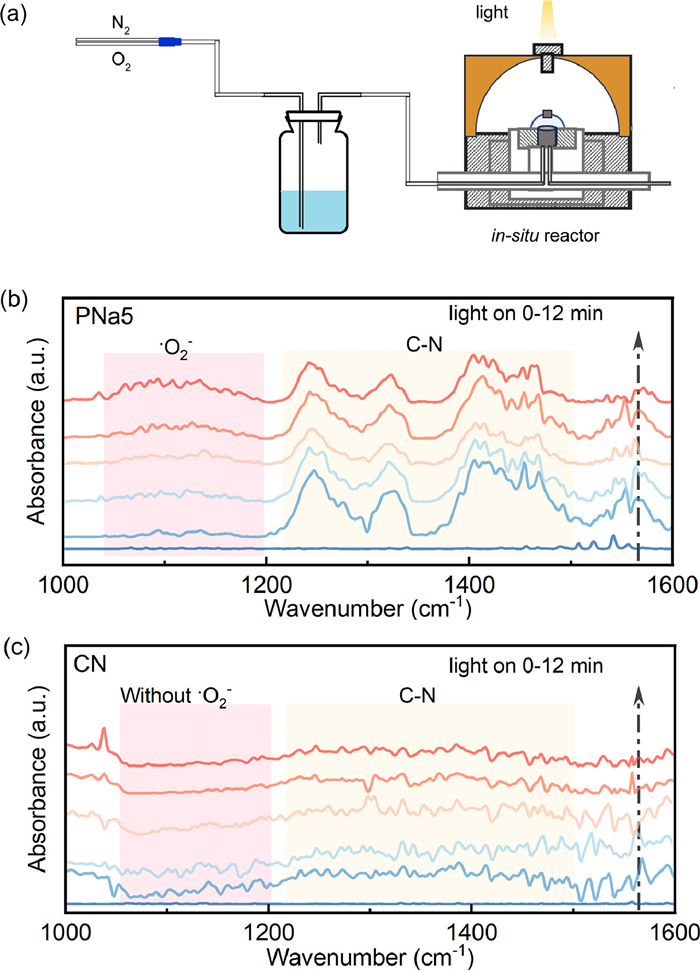
In order to further demonstrate the formation of •O2−, in-situ O2 fitting FTIR was used to detect •O2− produced during photocatalysis. The schematic diagram of the in-situ O2 fitting FTIR device was shown in Fig. 5a. In Figs. 5b and c, the absorption peaks at 1050–1200 cm−1 corresponded to the O—O vibrations of •O2− [32], and the peaks at 1225–1514 cm−1 were due to the C—N stretching vibration in the triazine ring [33]. Therefore, the formation of •O2− was confirmed over PNa5. No obvious peaks appeared in CN. Interestingly, the peaks intensity at 1225–1514 cm−1 decreased after light irradiation, which may be due to the formation of the C—O-O—N structure and hydrogen bonding between the catalysts and the adsorbed H2O or O2 molecules. Since O2 was reduced by electrons after illumination, the corresponding peaks intensity were weakened. This further proved that PNa5 has better O2 activation ability. Therefore, the introduction of P and Na could promote the formation of •O2−.
The contribution of each ROS was then calculated, and it was discovered that the collective contribution of all ROS exceeded 100% (Fig. 3e). It was speculated that different ROS may undergo mutual conversion. The formation of •O2− was an e− transfer process [34]. However, the role of h+ in this system was unknown. Noteworthy, the contribution of 1O2 and h+ was very similar. Generally speaking, 1O2 had two generation pathways: energy transfer and oxidation of •O2−. Therefore, it is presumed that the generation of 1O2 is related to •O2− and h+. To verify this hypothesis, an ESR experiment was carried out (Fig. 3f). After adding •O2− scavenger, no 1O2 signal was observed, indicating that 1O2 is converted from •O2−. After adding h+ scavenger, the signal decreased sharply, indicating that 1O2 is mainly formed by the oxidation of •O2− by h+. Furthermore, the addition of carotene greatly hindered the TC elimination. Consequently, the mechanism of TC degradation by PNa5 was the result of the synergistic effect of •O2− and 1O2.
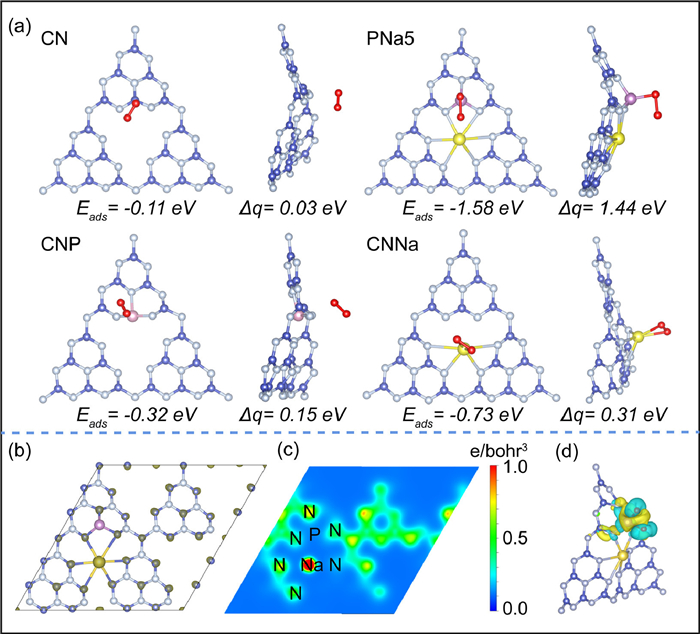
DFT was used to calculate the formation energies for several different doping sites to obtain the most stable structure (Fig. S18 in Supporting information). The most stable structure was found in Fig. S18c. The O2 adsorption and charge transfer on the sample surface were further investigated (Fig. 6a). The O2 adsorption energies of CN, CNP, CNNa and PNa5 samples were −0.11, −0.32, −0.73 and −1.58 eV, respectively. Compared with P, the introduction of Na could significantly enhance electron transfer amount, which can be attributed to the fact that the 3 s electrons provided by the Na atoms can increase the electron density on the CN plane after the coordination with the surrounding N atoms with abundant lone pair electrons [30]. However, O2 tended to adsorb on the P sites in PNa5, indicating its significant role. To interpret this phenomenon, charge difference distribution and charge density distribution were conducted (Figs. 6b and c), which revealed that the electrons tended to distribute on the Na sites, rather than P sites. Fig. 6d displayed the differential charge diagram, where the yellow part represented the electron enrichment region and the cyan part represented the electron consumption region. When O2 was introduced, electrons transferred from the P site to O2. This phenomenon can be explained as follows: after doping, the electronegativity of P (2.19) is lower than that of C (2.55) and N (3. 04), and P replaced C in bonding with N. This leads to the transfer of electrons to N and Na sites. O2 with vacant lone-pair electrons was adsorbed on the electron-deficient P sites. The rearrangement of local electrons boosted the electrons transfer, which further activated the O2. Therefore, rearranging the local electrons facilitated the promotion of O2 adsorption and activation.
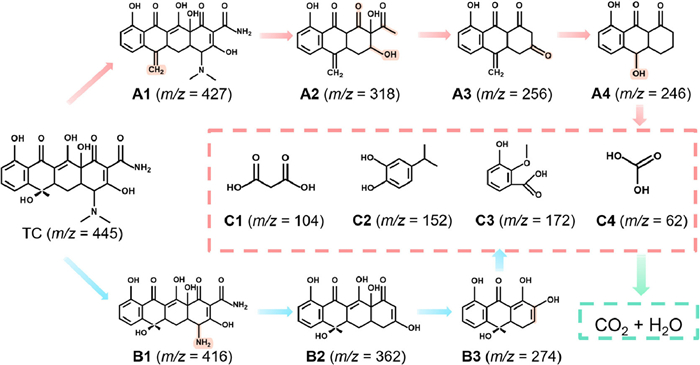
In order to analyze the degradation pathway of TC by PNa5, the intermediates were analyzed by ultra-performance liquid chromatography (UPLC-MS) over 120 min. As shown in Fig. 7, two possible degradation pathways were proposed. In pathway 1, TC first lost a water molecule and was oxidized to A1 (m/z = 427). Then, 1O2 attacked the strong electron donor groups on A1, including -NH2, -OH and -NR2. The six-membered ring was further opened by •O2− to form A2 (m/z = 318). This could be caused by •O2− attacking the N—C bond and opening the ring. ROS further attacked the functional groups to form A3 (m/z = 256) and A4 (m/z = 246). In pathway 2, TC was first attacked by •O2− to remove two methyl groups to form B1 (m/z = 416), followed by 1O2 to remove -NH2 and -COR to form B2 (m/z = 362), and then •O2− further opened the ring to form B3 (m/z = 274). A4 and B3 were further attacked by ROS and degraded to C1 (m/z = 147), C2 (m/z = 150), C3 (m/z = 167), C4 (m/z = 62) [20,35–38], and other small molecules which were finally mineralized to H2O and CO2.
In summary, PNaCN with reasonable distribution of electrons were prepared by two-step calcination and assisted by NaH2PO2, which improved the ability of O2 activation. The diagram of reaction mechanism by PNa5 was shown in Fig. S19 (Supporting information). TEM, XRD, FTIR, XPS analyses confirmed the successful synthesis of CN co-doped with phosphorus and sodium. The degradation experiment demonstrated that PNa5 exhibited the highest efficiency in TC removal and could significantly produce •O2− (48.40 µmol/L), which was 3.34 times higher than CN (14.48 µmol/L). ESR and in-situ O2 fitting FTIR also observed that PNa5 could effectively activate O2. DFT further confirmed that co-doping led to the rearrangement of local electrons at the molecular level, resulting in P as the electron-deficient sites and Na as electron-rich sites. These sites were more favorable for the adsorption of O2 and electron transfer. The quenching experiments and contribution indicated that •O2− and 1O2 were the primary ROS during TC degradation. Furthermore, 1O2 was mainly derived from •O2− oxidized by h+. Additionally, LC-MS results proposed two possible degradation pathways. This work provides a meaningful guide for the design of dual sites that activate O2 to degrade pollutants in the future.
The authors declare that they have no known competing financial interests or personal relationships that could have appeared to influence the work reported in this paper.
This work was financially supported by the National Natural Science Foundation of China (Nos. 21872102 and 22172080), the Fundamental Research Funds for the Central Universities, Nankai University (No. 63231195) and Tianjin “Project + Team” Innovation Team, 2020.
Supplementary material associated with this article can be found, in the online version, at doi:
Q. Shen, L. Wei, R. Bibi, et al., J. Hazard. Mater. 413 (2021) 125376. doi: 10.1016/j.jhazmat.2021.125376
H. Li, H. Ji, J. Liu, et al., Appl. Catal. B: Environ. 328 (2023) 122481. doi: 10.1016/j.apcatb.2023.122481
P. Huang, P. Zhang, C. Wang, J. Tang, H. Sun, Appl. Catal. B: Environ. 303 (2022) 120926. doi: 10.1016/j.apcatb.2021.120926
F. Liu, Z. Li, Q. Dong, et al., Environ. Sci. Technol. 56 (2022) 4413–4424. doi: 10.1021/acs.est.1c08268
T. Ren, M. Yin, S. Chen, et al., Environ. Sci. Technol. 57 (2023) 3623–3633. doi: 10.1021/acs.est.2c07653
S. Wang, Y. Liu, J. Wang, Environ. Sci. Technol. 54 (2020) 10361–10369. doi: 10.1021/acs.est.0c03256
J. Jiang, X. Wang, Y. Liu, et al., Appl. Catal. B: Environ. 278 (2020) 119349. doi: 10.1016/j.apcatb.2020.119349
S. Wang, T. Li, X. Cheng, R. Zhu, Y. Xu, Water Res. 233 (2023) 119744. doi: 10.1016/j.watres.2023.119744
Z. Yang, Y. Shi, H. Li, et al., Environ. Sci. Technol. 56 (2022) 3587–3595. doi: 10.1021/acs.est.1c08532
Z.R. Zhou, Z.R. Shen, C.L. Song, et al., Water Res. 201 (2021) 117314. doi: 10.1016/j.watres.2021.117314
Y. Wang, D. Meng, X. Zhao, Appl. Catal. B: Environ. 273 (2020) 119064. doi: 10.1016/j.apcatb.2020.119064
M. Zhang, W. Guo, Y. Chen, et al., Chin. Chem. Lett. 34 (2023) 108229. doi: 10.1016/j.cclet.2023.108229
Y. Duan, R. Li, Q. Liu, Z. Shen, Green. Chem. 24 (2022) 3475–3501. doi: 10.1039/D2GC00727D
C. Zhai, Y. Chen, X. Huang, A.B. Isaev, M. Zhu, Environ. Funct. Mater. 1 (2022) 219–229.
Q. Liu, H. Li, H. Zhang, Z. Shen, H. Ji, Chin. Chem. Lett. 33 (2022) 4756–4760. doi: 10.1016/j.cclet.2021.12.089
J. He, X. Wang, S. Jin, Z.Q. Liu, M. Zhu, Chin. J. Catal. 43 (2022) 1306–1315. doi: 10.1016/S1872-2067(21)63936-0
X. Liu, E. Wang, M. Zhou, et al., Angew. Chem. Int. Ed. 61 (2022) e202207685. doi: 10.1002/anie.202207685
Z. Xie, Y. Feng, F. Wang, et al., Appl. Catal. B: Environ. 229 (2018) 96–104. doi: 10.1016/j.apcatb.2018.02.011
L.Q. Kong, Y.J. Ji, Z.Z. Dang, et al., Adv. Funct. Mater. 28 (2018) 1800668. doi: 10.1002/adfm.201800668
H. Zhang, Y. Zeng, X. Wang, et al., Chem. Eng. J. 446 (2022) 137053. doi: 10.1016/j.cej.2022.137053
L. Wei, J. Li, C. Zhou, et al., Chin. Chem. Lett. 34 (2023) 107893. doi: 10.1016/j.cclet.2022.107893
C. Ku, H. Guo, K. Li, Q. Wu, L. Yan, Chin. Chem. Lett. 34 (2023) 107298. doi: 10.1016/j.cclet.2022.03.021
T.Y. Xu, Y.M. Zhu, J. Duan, et al., Chem. Eng. J. 395 (2020) 124991. doi: 10.1016/j.cej.2020.124991
X. Chi, S. Tan, J. Song, et al., Catal. Lett. 151 (2021) 3592–3602. doi: 10.1007/s10562-021-03595-8
Y. Zhang, T. Mori, J. Ye, M. Antonietti, J. Am. Chem. Soc. 132 (2010) 6294–6295. doi: 10.1021/ja101749y
X. Ma, H. Cheng, Appl. Catal. B: Environ. 339 (2023) 123101. doi: 10.1016/j.apcatb.2023.123101
X.H. Jiang, F. Yu, D.S. Wu, et al., Chin. Chem. Lett. 32 (2021) 2782–2786. doi: 10.1016/j.cclet.2021.01.011
Y. Zhou, L. Zhang, J. Liu, et al., J. Mater. Chem. A 3 (2015) 3862–3867. doi: 10.1039/C4TA05292G
X. Chi, F. Liu, Y. Gao, et al., Appl. Surf. Sci. 576 (2022) 151837. doi: 10.1016/j.apsusc.2021.151837
T. Xiong, W. Cen, Y. Zhang, F. Dong, ACS Catal. 6 (2016) 2462–2472. doi: 10.1021/acscatal.5b02922
Q. Wang, D. Xu, Y. Dong, et al., Appl. Catal. B: Environ. 319 (2022) 121924. doi: 10.1016/j.apcatb.2022.121924
S. Chen, S. Li, R. You, et al., ACS Catal. 11 (2021) 5666–5677. doi: 10.1021/acscatal.1c00839
Z. Jiang, Q. Long, B. Cheng, R. He, L. Wang, J. Mater. Sci. Technol. 162 (2023) 1–10. doi: 10.1016/j.jmst.2023.03.045
Q. Wu, X. Liu, B. Li, et al., J. Mater. Sci. Technol. 67 (2021) 70–79. doi: 10.1016/j.jmst.2020.04.084
H. Wang, Y. Wu, M. Feng, et al., Water Res. 144 (2018) 215–225. doi: 10.1016/j.watres.2018.07.025
X. Zhan, Y. Zeng, J. Xu, et al., Chem. Eng. J. 464 (2023) 142564. doi: 10.1016/j.cej.2023.142564
B. Chen, X. Liu, B. Liu, et al., Chemosphere 321 (2023) 138112. doi: 10.1016/j.chemosphere.2023.138112
X. Peng, C. Zhou, X. Li, K. Qi, L. Gao, Environ. Res. 227 (2023) 115750. doi: 10.1016/j.envres.2023.115750

Figure 1 SEM images of (a) CN and (c) PNa5, TEM images of (b) CN and (d) PNa5. (e) The EDS mapping images of PNa5, (f) XRD patterns and (g) FT-IR spectra of the prepared photocatalysts.

Figure 3 (a) The photodegradation curves for TC solution, (b) the rate constants of the samples, (c) recyclability test, (d) the capture experiment of ROS over PNa5, (e) the contribution of ROS over PNa5, (f) TEMP-1O2 of PNa5 under different conditions for 10 min.

Figure 4 (a, b) ESR spectra of DMPO-•O2− in the dark and after 10 min illumination, (c, d) ESR spectra of TEMP-1O2 in dark and after 10 min illumination, (e, f) quantitative determination of •O2− during photodegradation of prepared samples.

Figure 5 (a) Schematic diagram of the in-situ O2 fitting FTIR test principle, in-situ O2 fitting FTIR spectroscopy of (b) PNa5 and (c) CN, under the following conditions: 21% O2 + 79% N2 (50 mL/min).

Figure 6 (a) The adsorption energies of O2 on CN, CNP, CNNa and PNa5, the electron transfer from samples to O2 (blue, gray, purple, yellow and red spheres depict C, N, P, Na and O atoms, respectively), (b) charge difference distribution (the dark gray area represents the electron enrichment), (c) charge density distribution, (d) the differential charge diagram of PNa5 (the yellow part represents the electron enrichment region and the cyan part represents the electron consumption region).

 扫一扫看文章

扫一扫关注我们
 DownLoad:
 下载:
下载:

