

 Figure 1.
Experiment setup of the FTS
Figure 1.
Experiment setup of the FTS
Citation:
SHI He-xiang, LI Zhi-kai, LIU Ke-feng, XIAO Hai-cheng, KONG Fan-hua, ZHANG Juan, CHEN Jian-gang. Enhanced formation of α-olefins by the pulse process between Fischer-Tropsch synthesis and N2 purging[J]. Journal of Fuel Chemistry and Technology,
2016, 44(7): 822-829.

氮气吹扫和费托合成的脉冲过程以提高α-烯烃的选择性
摘要:
费托合成可以将煤炭或者生物质气化得到的合成气转化为α-烯烃等重要的化工产品。研究将费托合成和氮气吹扫操作组合成一脉冲过程, 在稳定的操作状态下保证费托合成和氮气吹扫交替进行。在传统的费托合成条件下(反应气速为2 000 h-1, 温度为497 K, 压力为2.0 MPa, 氢碳体积比为2.0) 考察了Fe-Co催化剂在脉冲过程中费托合成的活性和选择性。结果表明, N2吹扫温度和压力分别为517 K和0.2 MPa下的费托合成的C3烯烷比是未脉冲的相同反应条件下的九倍左右。同时, 反应过程中CH4的选择性和CO的转化率有所下降。在此基础上, 通过间歇反应在固定床反应器中进行该脉冲过程, 实验结果表明, 利用脉冲操作在费托反应中可以获得更高的烯烃选择性。
English
Enhanced formation of α-olefins by the pulse process between Fischer-Tropsch synthesis and N2 purging
Abstract:
The Fischer-Tropsch synthesis has offered an alternative way to convert coal and biomass into chemicals such as α-olefins via sygas comprised of H2 and CO. A pulse process switching between Fischer-Tropsch synthesis and N2 purging was carried out when the Fischer-Tropsch synthesis became stable in the fixed bed reactor. The activity and selectivity over Fe-Co catalyst for α-olefins in Fischer-Tropsch synthesis reaction were measured under the normal conditions of 2.0 MPa, 497 K, 2 000 h-1 and H2/CO volume ratio of 2.0. It was found that the olefin to paraffin ratio of C3 for Fe-Co catalyst purged at 517 K and 0.2 MPa was almost nine times higher than that of the fresh one without purging under the same reaction conditions, and the CH4 selectivity and CO conversion decreased after purging. Two possible reasons were proposed to explain these phenomena. Moreover, a batch experiment by the pulse process in fixed bed reactor was performed. Notably, a high olefins yield was obtained via the pulse process during the Fischer-Tropsch synthesis.
-
Key words:
- alpha olefins
- / pulse process
- / N2 purging
- / Fischer-Tropsch synthesis
-
α-Olefins are valuable products and intermediates, which are used in various kinds of commercial products, including polymers, additives and so on. Especially, α-Olefins are key building blocks for the manufacture of plastics, cosmetics, and drugs[1, 2]. There are various options which can produce olefins, including: (1) direct conversion of syngas (H2 and CO) via Fischer-Tropsch synthesis (FTS), (2) steam cracking of crude oil, (3) indirect conversion of syngas via methanol, (4) ethylene oligomerization, and (5) cracking hydrocarbon products from FTS[3-7]. Methods (3), (4) and (5) need at least two conversion steps which have to increase equipment investment and reduce the economy of the process, while methods (2) and (3) are the main ways for producing light olefins. Thus, the direct conversion via FTS is an appropriate technology in production of olefins from syngas derived from the gasification of coal and other carbon-containing materials[8].
The FTS is well known as a technology to produce transportation fuels from syngas. However, it is also a technology to produce specific fine chemicals, since products of FTS are particularly composed of straight chain hydrocarbons and α-olefins[9, 10]. It is well accepted that the FTS reaction is a surface-catalyzed polymerization process which uses CHx monomers formed by the hydrogenation of CO[11]. As the primary α-olefins can readsorb on the active sites and initiate secondary reactions which consume olefins and lower its yield, it is desired to shorten the residence time of α-olefin and thus reduce opportunities of α-olefin secondary reaction in favor of increasing the olefin to paraffin ratio (O/P)[12]. Since the condensed hydrocarbon liquid will accumulate in pore of catalyst pellet, and restrict the diffusion in liquid and instant release of olefins to gaseous phase, it is critical to eliminate the liquid phase to improve the production of α-olefins[13].
In recent years there has been growing interest in the development of bimetallic catalysts to achieve high olefins yield[14-17]. Most studies have focused on a combination of conventional FTS transition metals, namely Co, Ni, Fe and Ru. Among these, Co-Fe catalyst is given special attention[18]. Generally, cobalt based-catalysts have longer catalyst life, but generate less olefins than iron-based catalysts. When a lean hydrogen feed is used, iron-based catalysts is more suitable for olefins formation because of high activity for water-gas shift (WGS) reaction[19]. Accordingly, a range of preparation variables of Fe-Co catalyst were investigated to improve the olefins selectivity[20-24]. Besides, the parameters of process on producing olefins were studied[25]. LingHu et al[13] reported that the purpose of synthesizing higher α-olefins was achieved by utilizing suitable reaction media. The selectivity of α-olefins raised under the supercritical phase reaction via Co catalyst in the fixed bed reactor[26]. It was demonstrated that syngas diluted with N2 would lead to the decrease in selectivity for C1-4 hydrocarbons[27].
In this work, it was attempted to obtain high O/P over Fe-Co catalysts by purging off the liquid filled in pore of catalyst with inert gas (nitrogen), thus promoting the release of olefins from liquid to gas phase and minimizing its secondary reaction. The effect of various purging conditions was investigated and the possible explanations were proposed. The objective of this study was to design a pulse process to acquire as much olefins as possible based on the optimum operation of the pulse reaction unit.
1 Experimental
1.1 Catalyst preparation
A precipitated Fe-Co catalyst with BET area of 100 m2/g and average pore diameter of 6 nm was applied in the experiments. The method for preparation of catalyst was as follows. Firstly, the precipitate was gelled at 300 K in a container by slowly adding basic solution into Fe (NO3)3 and Co (NO3)2 mixed solution and subsequently stirred for 2 h. Secondly, the slurry after filtering was dried and calcined at 700 K to obtain the catalyst.
1.2 Fischer-Tropsch synthesis
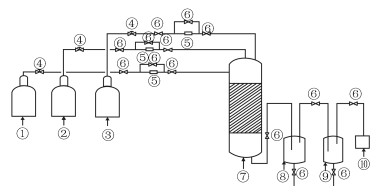
Approximately 3 g of the prepared iron-cobalt catalyst diluted with quartz sand of the same particle size was loaded into a fixed-bed reactor. The volume ratio of catalyst to quartz sand was 1: 3. The reactor was a 1 000 mm long stainless tube with 14 mm internal diameter and heated with a salt bath. The experimental setup is presented in Figure 1. The outlet of the reactor was connected with two traps. The hot trap was maintained at 500 K and the temperature of cold trap was 273 K. The uncondensed gas was conveyed to an sampler of online gas chromatograph (GC). The condensed products collected from the hot and cold traps were analyzed through off-line GC.
Figure 1.
Experiment setup of the FTS
The online GC included a thermal conductivity detector (TCD) with Ar carrier for analyzing H2, N2, CH4 and CO on 1.5 m × 3 mm i.d. 13X molecular sieve packed column, and the flame ionization detector (FID) for analyzing C1-6 hydrocarbons in gas phase with N2 carrier. The oil product from the cold trap was analyzed on 60 m×0.25 mm i.d. OV-101 capillary column, FID, N2 carrier with temperature programmed (3 K/min) to 563 K. The wax product from the hot trap was analyzed on 15 m×0.53 mm i.d. OV-101 capillary column, FID, N2 carrier with temperature programmed (1 K/min) from 343 to 570 K.
Before reaction, the catalyst was reduced with H2(99.999% in purity) at 2 000 h-1 at 0.2 MPa. The gas space velocity was based on the total mass of the unreduced catalyst. The temperature was programmed (1 K/min) to 673 K and eventually remained steadily at 673 K for 12 h. After reduction the temperature decreased at a speed of 1 K/min to 497 K, and then N2 (99.999% in purity) was switched from H2 before the reaction began until H2 was replaced by N2. Once the FTS started, the syngas (15% N2/27% CO/58% H2 for mole ratio) replaced nitrogen. The flow rate of syngas, nitrogen and hydrogen were controlled by Brooks 5850 Mass Flow Controller. The parameters of FTS were 2.0 MPa, 497 K and 2 000 h-1. Since this report focused on olefins, propane and propylene were chosen as index regardless of changes of oil and wax.
1.3 Pulse process in a fixed bed reactor
The purpose of purging operation is to reduce the deposit of liquid in the catalyst during the FTS reaction and the purging process continued for 48 h in our experiment. After the state of reaction became steady (time of reaction was longer than 6 h), the feedstock was switched from syngas to nitrogen (purging gas). The purging temperature was chosen 497, 507 and 517 K respectively, and the purging pressure was set to a sequence of 0.2, 1.0 and 2.0 MPa respectively. The space velocity of nitrogen was the same as that of syngas. The rate of temperature change was 1 K/min.
After the purging stage was finished, the feed gas was switched from nitrogen to the syngas, and FTS resumed. Then the pulse process was finished. The pulse process was regulated by valves. One thing to note here was that conditions of FTS reaction were the same no matter what purging conditions. Only after the temperature and pressure of the fixed bed reactor was regulated to become 497 K and 2.0 MPa, could the operation of switching N2 to syngas be performed.
2 Results and discussion
2.1 Effect of operational conditions on O/P
Firstly, the effect of operation conditions on olefin/paraffin ratio was investigated. Figure 2 compares the changes of the O/P of C3 before and after purging at different purging process. The results from Figure 2 display substantial reduction in O/P compared with unpurged one during the standard reaction periods after the purging experiments. The higher purging temperature, the larger value of O/P was obtained. The olefin to paraffin ratio of catalyst after purging at 517 K and 0.2 MPa was almost nine times than that of fresh catalyst (without purging). It can be seen that there was an initial decline of O/P against the time on stream, possibly for the filling of catalyst pore with generated hydrocarbons liquid. Such the trend was in good agreement with the results reported in literature[28]. Furthermore, the extent of decline on the O/P depended on the purging temperature given same purging pressure, and the O/P after purging at 517 K decreased fast while the decline of the O/P was the slowest at 497 K.
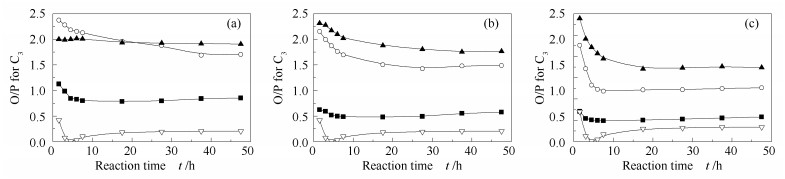 Figure 2.
Dependences of the O/P for C3 on the reaction time during FTS after different purging process
Figure 2.
Dependences of the O/P for C3 on the reaction time during FTS after different purging process
The effect of purging pressure on O/P is also shown in Figure 2. As the purging pressure decreased, the value of the O/P went up. It was also found that the general trend for the O/P with different purging pressures was to decrease as the reacting time going on. Again, possibly reason for this is pore filling gradually. The value of the O/P at 517 K purging temperature and 0.2 MPa purging pressure could maintain a long time, indicating the extent of void of pore might be the most. Particular attention should be given to the fact that the extent of the O/P changing on the purging temperature was larger than that on the purging pressure.
According to the O/P at different reaction times during the reaction, we could divide the entire experiment into two stages: stage A (the first 7 h) is the period during which the reaction started. In this period, the O/P of C3 decreased dramatically and the extent of the change depended on the purging temperature and the purging pressure. These ratios decreased until minimum values were reached. Stage B commences from 7 to 48 h. During this stage, the value of O/P ratios stayed steady. From Figure 2, it could be found that O/P value went up with increasing purging temperature and decreasing purging pressure.
2.2 Effect of operational conditions on CO conversion
In this section, we discussed CO conversion before and after purging at several temperatures under pressure of 0.2 MPa or 2.0 MPa, since precious results showed that effect of purging temperature on the O/P was greater than that of purging pressure. The possible reason is that the influence of changing purging temperature on the volatile of heavy hydrocarbons might be greater than that of purging pressure. Figure 3 illustrated that CO conversion decreased over time at different purging temperatures and purging pressures. As is shown in Figure 3, we could also divide the change of CO conversion into two parts: stage A denotes the period which the CO conversion decreased rapidly after reaction began, and stage B is the period that the value of CO conversion maintained steady after CO conversion decreased to minimum.
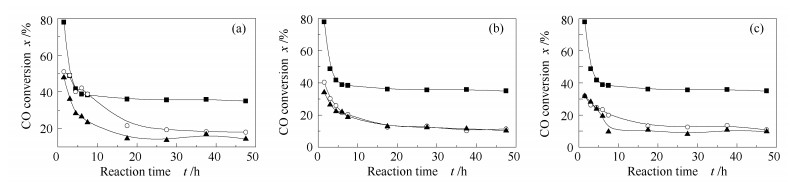 Figure 3.
Dependences of the CO conversion on the reaction time during FTS after different purging process
Figure 3.
Dependences of the CO conversion on the reaction time during FTS after different purging process
It can also be found the CO conversion of fresh catalyst was larger than that of purging catalysts. CO conversions of catalysts with 497 K purging temperature and 2.0 MPa purging pressure was obviously greater than that of other purging temperatures and pressures, while CO conversions were almost the same regardless of other purging temperatures and pressures as shown in Figure 3. The possible reason is that the change of pressure or temperature in the reactor could influence the property of catalyst surface such as pore structure of catalysts as well as the catalytic active phases.
2.3 Effect of operational conditions on CH4 selectivity
The effect of purging on CH4 selectivity was discussed in this part. In Figure 4, a common feature that can be observed was that firstly CH4 selectivity slowly decreased over time and eventually the value of CH4 selectivity maintained a steady number at approximately 20 h. We could clearly see that CH4 selectivity decreased when the purging temperature raised or the purging pressure fell up. When the purging temperature raised from 507 to 517 K, the extent of CH4 selectivity change was small. Similar trends could be found increasing purging pressure from 0.2 to 2.0 MPa at different temperature. Remarkably, CH4 selectivity at purging temperature of 497 K was much larger than that of 507 and 517 K. From above results we found that the CO conversion and the CH4 selectivity at purging conditions of 2.0 MPa and 497 K were obviously different with that of other purging temperatures and pressures.
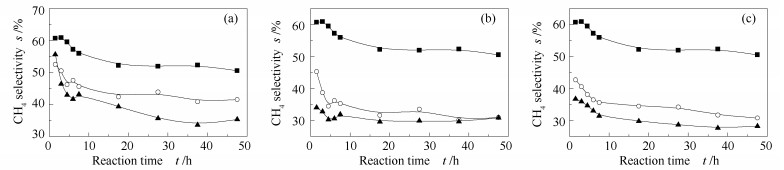 Figure 4.
Dependences of the CH4 selectivity on the reaction time during FTS after different purging process
Figure 4.
Dependences of the CH4 selectivity on the reaction time during FTS after different purging process
There may be two reasons for the significant changes of O/P, CO conversion and CH4 selectivity during reaction. The first reason is that there might be some changes of surface properties when the temperature and pressure were altered during purging. Schulz et al[29, 30] reported that the segregation of the catalyst surface was attributed to strong CO chemisorption. Wilson et al[31] obtained the dynamical structural nature of a catalyst surface during CO hydrogenation by Scanning Tunneling Microscopy (STM). The STM images indicated that surface reconstruction occurred during FTS by an etch-regrowth mechanism. At the same time, the property of pore structure such as pore size and specific surface area might affect product selectivity and activity when the temperature and pressure resumed after certain adjustment[32, 33].
The second possible reason is the change of liquid accumulation on surface or in pores of catalyst during FTS. It is widely known that the reactants and the light products are in the vapor phase and the heavy products (the waxes) exist in the liquid phase. That heavy liquids inside and outside the pores of catalyst pellets can affect the performances of the reaction. Long chain hydrocarbons start to form as reaction time elapsed, and the solubility and diffusivity of olefin depend on the chain length of liquid hydrocarbon, which fill the catalyst pores and lead to the blockage[34-37]. In the meanwhile, the olefin readsorption probability increases when carbon number raises because of long residence times of olefin in the liquid-filled pores of the catalyst[38-41]. As the catalyst was purged at different temperature and pressure, the layer of liquid on and in the catalyst pores could be driven off to some degree. Therefore, the transportation of reactants and products could be enhanced and the probability of olefins readsorption would decline and the solubility of olefins would also decreases, then the quantity of light olefin would increase.
2.4 Batch experiment by the pulse process for olefin on iron-cobalt catalyst
When parameters of purging experiments varied, the amount of propylene shown in Figure 5 indicates that the production of olefin for C3 in the FTS will change with purging operation. The extent of increase in olefin production depends on the purging temperature and pressure. From Figure 5 it is found that the amount of propylene arrives at the biggest when the conditions of purging are 517 K and 0.2 MPa. This shows potential application in industrial production of olefins. It is noteworthy that the O/P can maintain a long period after purging at 517 K and 0.2 MPa whereas there is an instant decrease of the O/P for C3 at other purging parameters. Hence, it is possible to acquire high O/P steadily through purging at temperature of 517 K and pressure of 0.2 MPa.
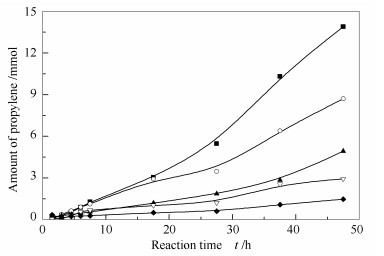 Figure 5.
Comparison of the time dependence of production in propylene after purging during FTS among different purging process
Figure 5.
Comparison of the time dependence of production in propylene after purging during FTS among different purging process
Moreover, it is found that the optimized ratio of olefin to paraffin drops finally after almost 50 h during FTS and CO conversion stay stable after 20 h as shown in Figures 6 and 7. The possible reason is that the liquid accumulation in the reactor and catalyst would be strengthened as the reaction continues. As long-chain hydrocarbons continue to increase, the catalyst pore is filled with liquid and the solubility and readsorption of olefins will occur in the pore of catalysts.
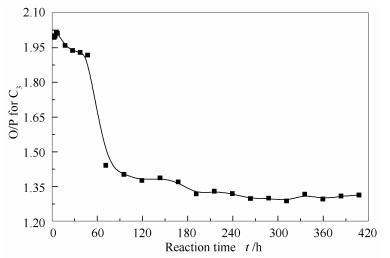 Figure 6.
Dependence of the O/P for C3 on the reaction time during FTS after only one purging with purging temperature of 517 K and purging pressure of 0.2 MPa
Figure 6.
Dependence of the O/P for C3 on the reaction time during FTS after only one purging with purging temperature of 517 K and purging pressure of 0.2 MPa
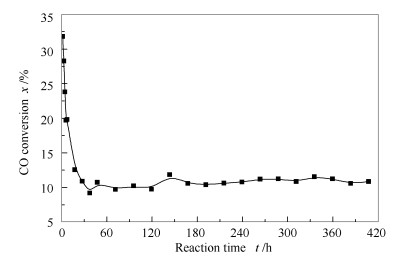 Figure 7.
Time dependence of CO conversion during FTS after only one purging at the purging temperature of 517 K and the purging pressure of 0.2 MPa
Figure 7.
Time dependence of CO conversion during FTS after only one purging at the purging temperature of 517 K and the purging pressure of 0.2 MPa
As the FTS proceed, the liquid begins to accumulate in the void of fresh catalyst, and the process is the same to that after purging. But the amount of propylene produced in catalysts after purging is much higher than that of fresh catalyst. This phenomenon may be ascribed to the following reasons. The first possible reason is that the process of the construction of catalysts surface in the syngas atmosphere is different from that after purging by nitrogen. As a result, it is possible to get olefins easily from the reacting system after purging. The second reason may be that there is enough liquid accumulating in the pore of fresh catalysts when the reaction have been carried out for one hour, and then the ratio of olefin to paraffin that have been affected by liquid is smaller.
The pulse process to the production of propylene was applied in the fixed bed reactor. Three experiments with different purging strategy were performed and the amount of propylene in the FTS was summed. The each purging process continued for 48 h, and the FTS was run on the normal reaction conditions of 497 K and 2.0 MPa on catalysts via different process. The catalyst of the first batch had not purging, while that of the second batch was dealt by only one purging from 48 to 96 h. Then, FTS reaction resumed and continued to 432 h. The third one was processed by four times purging via the pulse process. The feedstock was switched to syngas from N2 and the Fischer-Tropsch synthesis reaction resumed. Those steps occurred in turn. There was one thing to be noted that the purging temperature was 517 K and the purging pressure was 0.2 MPa. Through four times purging, Table 1 indicates that the pulse process under optimum purging conditions can produce more olefins than that of fresh catalyst (without purging) and that of catalyst by only one time purging under optimum purging conditions.
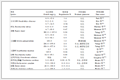 Table 1.
Comparison of amount of propylene for different batch
Table 1.
Comparison of amount of propylene for different batch
Reaction time t/h Amount of propylene /mmol first batch second batch third batch 48 1.443 1.452 1.435 96 5.557 1.452 1.435 144 9.518 12.878 12.959 192 13.290 16.995 12.959 240 17.599 21.122 25.548 288 21.762 25.224 25.548 336 25.739 29.376 37.423 384 29.711 33.573 37.423 432 33.672 37.748 50.297 Table 1. Comparison of amount of propylene for different batchThe pulse process can produce more olefins, while production for olefins by using the pulse process is a batch reaction process. The pressure swing adsorption process provides some concepts to design a continuous reaction unit. The reaction unit includes two fixed bed reactors which are connected in parallel and the pulse process will be run in each fixed bed reactor. What calls for specially attention is that one reactor is in the process of purging when the other one is in the process of the FTS reaction, and then the reaction unit will continuously produce more olefins by the pulse operation of the FTS.
3 Conclusion
Activity and selectivity of α-olefins over iron-cobalt catalyst for CO hydrogenation were studied at 2.0 MPa and 497 K with 2 000 h-1under H2/CO volume ratio of 2.0 in the fixed bed reactor. In this case, the purging temperature and pressure of the pulse process played a critical role in controlling the olefins selectivity in the FTS. It was found that the O/P increased with increasing purging temperature and lowering purging pressure. However, the methane selectivity and CO conversion decreased after purging. The studies indicated that the optimal purging conditions for olefins production were 517 K and 0.2 MPa. The results showed that the liquid in the catalyst might have remarked effects on the formation of olefins in the FTS. Frankly, the relationships between the catalytic performance of Fe-Co catalysts and the designed purging process were complex because it was possible that the property of catalyst surface would be changed during the purging. Although CO conversion would drop during purging process, the process of purging catalysts could offer high olefin selectivity in Fe-Co catalysts. The integration of purging process with the FTS to form a pulse process could be controlled alternately under certain purging temperature and pressure to gain more olefins. New reaction unit was building to practice the pulse process to the continuous production of olefins in the future.
-
-
[1]
DRY M E. The Fischer-Tropsch process: 1950-2000[J]. Catal Today, 2002, 71(3/4): 227-241.
-
[2]
ZHENG S, SUN J, SONG D, CHEN Z, CHEN J. The facile fabrication of magnetite nanoparticles and their enhanced catalytic performance in Fischer-Tropsch synthesis[J]. Chem Commun, 2015, 51(55): 11123-11125. doi: 10.1039/C5CC03336E
-
[3]
DUPAIN X, KRUL R A, SCHAVERIEN C J, MAKKEE M, MOULIJN J A. Production of clean transportation fuels and lower olefins from Fischer-Tropsch synthesis waxes under fluid catalytic cracking conditions[J]. Appl Catal B: Environ, 2006, 63(3/4): 277-295.
-
[4]
CAVELL R G, CREED B, GELMINI L, LAW D J, MCDONALD R, SANGER A R, SOMOGYVARI A. Design, syntheses and application of new phosphine and dithiophosphinate complexes of nickel: Catalyst precursors for the oligomerization of ethylene[J]. Inorg Chem, 1998, 37(4): 757-763. doi: 10.1021/ic970798w
-
[5]
JANARDANARAO M. Direct catalytic conversion of synthesis gas to lower olefins[J]. Ind Eng Chem Res, 1990, 29(9): 1735-1753. doi: 10.1021/ie00105a001
-
[6]
LIU Z, SUN C, WANG G, WANG Q, CAI G. New progress in R & D of lower olefin synthesis[J]. Fuel Process Technol, 2000, 62(2/3): 161-172.
-
[7]
PARK J, LEE Y, JUN K, BAE J W, VISWANADHAM N, KIM Y H. Direct conversion of synthesis gas to light olefins using dual bed reactor[J]. J Ind Eng Chem, 2009, 15(6): 847-853. doi: 10.1016/j.jiec.2009.09.011
-
[8]
TORRES GALÜIS H M, BITTER J H, KHARE C B, RUITENBEEK M, DUGULAN A I, DE JONG K P. Supported iron nanoparticles as catalysts for sustainable production of lower olefins[J]. Science, 2012, 335(6070): 835-838. doi: 10.1126/science.1215614
-
[9]
MA C, CHEN J. Effect of hydrothermal treatment on precipitated iron catalyst for Fischer-Tropsch Synthesis[J]. Catal Lett, 2015, 145(2): 702-711. doi: 10.1007/s10562-014-1457-4
-
[10]
SUN J, ZHENG S, ZHANG K, SONG D, LIU Y, SUN X, CHEN J. The crystal plane effect of CoFe nanocrystals on Fischer-Tropsch synthesis[J]. J Mater Chem A, 2014, 2(32): 13116-13122. doi: 10.1039/C4TA02425G
-
[11]
JOYNER R W. The mechanism of chain growth in the Fischer-Tropsch hydrocarbon synthesis[J]. Catal Lett, 1988, 1(10): 307-310. doi: 10.1007/BF00774872
-
[12]
MADON R J, IGLESIA E. The importance of olefin readsorption and H2/CO reactant ratio for hydrocarbon chain growth on ruthenium catalysts[J]. J Catal, 1993, 139(2): 576-590. doi: 10.1006/jcat.1993.1051
-
[13]
LINGHU W, LIU X, LI X, FUJIMOTO K. Selective synthesis of higher linear alpha-olefins over cobalt Fischer-Tropsch catalyst[J]. Catal Lett, 2006, 108(1/2): 11-13.
-
[14]
JANANI H, REZVANI A R, GRIVANI G H, MIRZAEI A A. Fischer-Tropsch synthesis of hydrocarbons over new Co/Ce bimetallic catalysts derived from dipicolinate and carbonyl metal complexes[J]. J Inorg Organomet Polym, 2015, 25(5): 1169-1182. doi: 10.1007/s10904-015-0225-2
-
[15]
RAMASAMY K K, GRAY M, JOB H, WANG Y. Direct syngas hydrogenation over a Co-Ni bimetallic catalyst: Process parameter optimization[J]. Chem Eng Sci, 2015, 135: 266-273. doi: 10.1016/j.ces.2015.03.064
-
[16]
SHIMURA K, MIYAZAWA T, HANAOKA T, HIRATA S. Fischer-Tropsch synthesis over alumina supported bimetallic Co-Ni catalyst: Effect of impregnation sequence and solution[J]. J Mol Catal A: Chem, 2015, 407: 15-24. doi: 10.1016/j.molcata.2015.06.013
-
[17]
FARZANFAR J, REZVANI A R. Inorganic complex precursor route for preparation of high-temperature Fischer-Tropsch synthesis Ni-Co nanocatalysts[J]. Res Chem Intermed, 2015, 41(11): 8975-9001. doi: 10.1007/s11164-015-1942-4
-
[18]
CALDERONE V R, SHIJU N R, FERRE D C, ROTHENBERGA G. Bimetallic catalysts for the Fischer-Tropsch reaction[J]. Green Chem, 2011, 13(8): 1950-1959. doi: 10.1039/c0gc00919a
-
[19]
KEYSER M J, EVERSON R C, ESPINOZA R L. Fischer-Tropsch studies with cobalt-manganese oxide catalysts: Synthesis performance in a fixed bed reactor[J]. Appl Catal A: Gen, 1998, 171(1): 99-107. doi: 10.1016/S0926-860X(98)00083-0
-
[20]
DUVENHAGE D J, COVILLE N J. Fe:Co/TiO2 bimetallic catalysts for the Fischer-Tropsch reaction I. Characterization and reactor studies[J]. Appl Catal A: Gen, 1997, 153(1/2): 43-67.
-
[21]
DUVENHAGE D J, COVILLE N J. Fe: Co/TiO2 bimetallic catalysts for the Fischer-Tropsch reaction: part 2. the effect of calcination and reduction temperature[J]. Appl Catal A: Gen, 2002, 233(1/2): 63-75.
-
[22]
TIHAY F, ROGER A C, KIENNEMANN A, POURROY G. Fe-Co based metal/spinel to produce light olefins from syngas[J]. Catal Today, 2000, 58(4): 263-269. doi: 10.1016/S0920-5861(00)00260-1
-
[23]
MIRZAEI A A, HABIBPOUR R, KASHI E. Preparation and optimization of mixed iron cobalt oxide catalysts for conversion of synthesis gas to light olefins[J]. Appl Catal A: Gen, 2005, 296(2): 222-231. doi: 10.1016/j.apcata.2005.08.033
-
[24]
MA X, SUN Q, YING W, FANG D. Effects of the ratio of Fe to Co over Fe-Co/SiO2 bimetallic catalysts on their catalytic performance for Fischer-Tropsch synthesis[J]. J Nat Gas Chem, 2009, 18(2): 232-236. doi: 10.1016/S1003-9953(08)60102-4
-
[25]
DE LA PENA O'SHEA V A, ÁLÜAREZ-GALÜAN M C, CAMPOS-MARTIN J M, FIERRO J L G. Fischer-Tropsch synthesis on mono-and bimetallic Co and Fe catalysts in fixed-bed and slurry reactors[J]. Appl Catal A: Gen, 2007, 326(1): 65-73. doi: 10.1016/j.apcata.2007.03.037
-
[26]
YOKOTA K, FUJIMOTO K. Supercritical phase Fischer-Tropsch synthesis reaction[J]. Fuel, 1989, 68(2): 255-256. doi: 10.1016/0016-2361(89)90335-9
-
[27]
SAVOST'YANOV A P, YAKOVENKOA R E, NAROCHNYI G B, LAPIDUS A L. Effect of the dilution of synthesis gas with nitrogen on the Fischer-Tropsch process for the production of hydrocarbons[J]. Solid Fuel Chem, 2015, 49(6): 356-359. doi: 10.3103/S0361521915060099
-
[28]
LU X, ZHU X, HILDEBRANDT D, LIU X, GLASSER D. A new way to look at Fischer-Tropsch Synthesis using flushing experiments[J]. Ind Eng Chem Res, 2011, 50(8): 4359-4365. doi: 10.1021/ie102095c
-
[29]
SCHULZ H. Major and minor reactions in Fischer-Tropsch synthesis on cobalt catalysts[J]. Top Catal, 2003, 26(1/4): 73-85.
-
[30]
SCHULZ H, NIE Z, OUSMANOV F. Construction of the Fischer-Tropsch regime with cobalt catalysts[J]. Catal Today, 2002, 71(3/4): 351-360.
-
[31]
WILSON J, DE GROOT C. Atomic-scale restructuring in high-pressure catalysis[J]. J Phys Chem, 1995, 99: 7860-7866. doi: 10.1021/j100020a005
-
[32]
LIU Y, CHEN J, FANG K, WANG Y, SUN Y. A large pore-size mesoporous zirconia supported cobalt catalyst with good performance in Fischer-Tropsch synthesis[J]. Catal Commun, 2007, 8(6): 945-949. doi: 10.1016/j.catcom.2006.06.019
-
[33]
KHODAKOV A Y, GRIBOVOL-CONSTANT A, BECHARA R, ZHOLOBENKO V L. Pore size efects in Fischer Tropsch synthesis over cobalt-dupported mesoporous silicas[J]. J Catal, 2002, 206(2): 230-241. doi: 10.1006/jcat.2001.3496
-
[34]
OLEWSKI T, TODIC B, NOWICKI L, NIKACEVIC N, BUKUR D B. Hydrocarbon selectivity models for iron-based Fischer-Tropsch catalyst[J]. Chem Eng Res Des, 2015, 95: 1-11. doi: 10.1016/j.cherd.2014.12.015
-
[35]
YAN F, QIAN W, SUN Q, ZHANG H, YING W, FANG D. Product distributions and olefin-to-paraffin ratio over an iron-based catalyst for Fischer-Tropsch synthesis[J]. React Kinet Mech Cat, 2014, 113(2): 471-485. doi: 10.1007/s11144-014-0746-7
-
[36]
TSUBAKI N, FUJIMOTO K. Product control in Fischer-Tropsch synthesis[J]. Fuel Process Technol, 2000, 62(2/3): 173-186.
-
[37]
ERKEY C, RODDEN J B, AKGERMAN A. Diffusivities of synthesis gas and n-alkanes in Fischer-Tropsch wax[J]. Energy Fuels, 1990, 4(3): 275-276. doi: 10.1021/ef00021a010
-
[38]
IGLESIA E, REYES S C, MADON R J. Transport-enhanced alpha-olefin readsorption pathways in Ru-catalyzed hydrocarbon synthesis[J]. J Catal, 1991, 129(1): 238-256. doi: 10.1016/0021-9517(91)90027-2
-
[39]
SCHULZ H, CLAEYS M. Reactions of alpha-olefins of different chain length added during Fischer-Tropsch synthesis on a cobalt catalyst in a slurry reactor[J]. Appl Catal A: Gen, 1999, 186(1/2): 71-90.
-
[40]
CHENG J, SONG T, HU P, LOK C M, ELLIS P, FRENCH S. A density functional theory study of the α-olefin selectivity in Fischer-Tropsch synthesis[J]. J Catal, 2008, 255(1): 20-28. doi: 10.1016/j.jcat.2008.01.027
-
[41]
KUIPERS E W, VINKENBURG I H, OOSTERBEEK H. Chain-length dependence of alpha-olefin readsorption in Fischer-Tropsch synthesis[J]. J Catal, 1995, 152(1): 137-146. doi: 10.1006/jcat.1995.1068
-
[1]
-

Figure 1 Experiment setup of the FTS
①: H2 cylinder; ②: N2 cylinder; ③: syngas cylinder; ④: regulators; ⑤: mass flow controllers; ⑥: shut-off valves; ⑦: fixed bed reactor; ⑧: hot trap; ⑨: cold trap; ⑩: gas chromatograph

Figure 2 Dependences of the O/P for C3 on the reaction time during FTS after different purging process
(a): 0.2 MPa; (b): 1.0 MPa; (c): 2.0 MPa
▲: 517 K; ○: 507 K; ■: 497 K; ▽: without purging
Figure 3 Dependences of the CO conversion on the reaction time during FTS after different purging process
(a): 497 K; (b): 507 K; (c): 517 K
■: without purging; ○: 2.0 MPa; ▲: 0.2 MPa
Figure 4 Dependences of the CH4 selectivity on the reaction time during FTS after different purging process
(a): 497 K; (b): 507 K; (c): 517 K
■: without purging; ○: 2.0 MPa; ▲: 0.2 MPa
Figure 5 Comparison of the time dependence of production in propylene after purging during FTS among different purging process
■: 0.2 MPa, 517 K; ○: 1.0 MPa, 517 K; ▲: 0.2 MPa, 507 K; ▽: 1.0 MPa, 507 K; ◆: without purging

Figure 6 Dependence of the O/P for C3 on the reaction time during FTS after only one purging with purging temperature of 517 K and purging pressure of 0.2 MPa

Figure 7 Time dependence of CO conversion during FTS after only one purging at the purging temperature of 517 K and the purging pressure of 0.2 MPa
Table 1. Comparison of amount of propylene for different batch
Reaction time t/h Amount of propylene /mmol first batch second batch third batch 48 1.443 1.452 1.435 96 5.557 1.452 1.435 144 9.518 12.878 12.959 192 13.290 16.995 12.959 240 17.599 21.122 25.548 288 21.762 25.224 25.548 336 25.739 29.376 37.423 384 29.711 33.573 37.423 432 33.672 37.748 50.297  下载: 导出CSV
-


 扫一扫看文章
计量
- PDF下载量: 2
- 文章访问数: 1407
- HTML全文浏览量: 94
 下载:
下载:

