Advanced Catalysis and Green Manufacturing Collaborative Innovation Center, CNPC-CZU Innovation Alliance, School of Petrochemical Engineering, Changzhou University, Changzhou 213164, China
b.
School of Materials Science & Engineering, Changzhou University, Changzhou 213164, China
Received Date:
25 June 2023 Accepted Date:
16 August 2023 Revised Date:
14 August 2023 Available Online:
15 June 2024
Abstract:
The efficient conversion of CO2 into hydrocarbon fuels (CH4) with high selectivity is considered as a great challenge in photocatalysis owing to the multiple-electron transfer pathway and competitive H2 generation. Herein, we developed carbon dots (CDs)-modulated S-scheme heterojunction of CDs/NiAl-LDH@In2O3 (C-DH@IN) through a facile in-situ hydrothermal method. Thanks to the multi-shell nanotube structure, the C-DH@IN shows an enhanced CH4 evolution rate of 10.67 µmol h−1 g−1 and higher selectivity of CH4 (85.70%) compared with In2O3 and NiAl-LDH@In2O3 binary catalyst in the pure water without sacrificial agent. Electron spin resonance (ESR) and in situ Fourier transform infrared spectra verify that the constructed S-scheme heterojunction can possess the strong redox capability and the HCOO− and CH3O− as critical intermediates play an important role in selective CO2 reduction to generate CH4. Furthermore, CDs with superior photoabsorption can boost the electron transfer and absorb H+, thus improving the integration of H+ and CO2 molecule. Therefore, this work emphasizes a facile strategy to achieve efficient CO2-to-CH4 conversion based on construction of CDs-based heterojunction catalysts.
CO2 reduction into CH4 or other hydrocarbons together with H2O oxidation into O2 by solar energy is a promising strategy to alleviate the global warming effect and generate value-added chemicals [1–5]. However, it is great challenge to convert CO2 under mild conditions using water caused by the stable-bond of C═O in CO2 molecule, multi-electrons coupling process and competing water splitting reactions. Recently, various semiconductors have been constructed for photocatalytic CO2 reduction reaction (CO2RR), such as metal oxides [6,7], metal sulfides [8], carbon-based materials [9], metal organic frameworks [10]. Especially, layered double hydroxides (LDHs) with two-dimensional layered structures, tunability of metal cations, and excellent photoelectric property have been widely used in CO2RR [11]. However, most of LDHs also suffer from severe agglomerations, and rapidly charge recombination, leading to unsatisfactory CO2RR activity. Therefore, decorating LDHs with other porous and stable components can greatly increase exposed active sites and inhibit recombination of electron-hole pairs, thus promoting their CO2RR performance with H2O [12].
In2O3 is considered as an ideal semiconductor for activization of CO2 [13,14], due to the its high stability, oxygen defect as well as rich hydroxyl group, and its appropriate band gap is ~2.7 eV, so that the redox potentials can meet simultaneously the requirement for CO2 reduction and water oxidation. Besides, except the above advantages, MOFs-derived In2O3 nanotube after pyrolysis can inherit porous structure and unique morphology from MIL-68(In) [15]. In our previous work, MIL-68(In)-derived In2O3 nanotube coupled with Co@C—N exhibited an excellent photocatalytic CO2 conversion [16]. Besides, carbon dots have attracted wide attention toward photocatalytic CO2RR, attributed to the unique geometric structure (diameter less than 10 nm, thickness between 0.5 and 3 nm), excellent electron transport efficiency and adjustable light response range [17–19]. Li et al. reported that CDs improved the CH4 selectivity of g-C3N4 during photocatalytic CO2RR due to proton-coupled ability of CDs [20]. Considering the above advantages, the fabrication of multicomponent catalysts, based on integration of hierarchical heterostructure (LDHs/In2O3) and quantum effect (CDs), is particularly important in promoting the CO2 conversion efficiency and CH4 selectivity.
Herein, the ternary heterostructures of CDs/NiAl-LDH@In2O3 (C-DH@IN) nanorods were fabricated using in situ growth strategy of CDs and NiAl-LDH nanosheets on MIL-68(In)-derived In2O3 after calcination, in which the C-DH@IN catalyst indicated high photocatalytic CO2RR activity and CH4 selectivity in pure water under simulated solar irradiation. The optimal CO and CH4 yields over 3% C-DH@IN are up to 7.12 and 10.67 µmol h−1 g−1, and the CH4 selectivity is 85.70%, which is 1.81 and 1.15 times higher than that of NiAl-LDH and DH@IN-50, respectively. The photocatalytic mechanism and intermediate HCOO− and CH3O− products are investigated systematically using in situ Fourier transform infrared (FT-IR) and electron spin resonance (ESR) spectra.
The diffraction peaks of pure Ni-Al LDH (Fig. 1a) at 11.5°, 23.1°, 34.9°, 39.3°, 46.8°, 60.9° and 62.1° are consistent to (003), (006), (012), (015), (018), (110) and (113) facets respectively, corresponding to the typical LDHs (JCPDS No. 22-0452) [21]. The peaks of In2O3 at 21.5°, 30.5°, 35.4°, 37.6°, 41.8°, 45.7°, 51.0°, 55.9° and 60.6° belong to the (211), (222), (400), (411), (332), (431), (440), (611) and (622) diffraction planes of cubic In2O3 (JCPDS No. 06-0416) [22], respectively. All the as-prepared DH@IN displays the diffraction peaks of both In2O3 and NiAl-LDH, and no obvious impurity peaks are observed. Additionally, as In2O3 loading continues to increase, the peaks intensity of In2O3 are obviously improved, and meanwhile that of NiAl-LDH is weakened, indicating the successful formation of DH@IN. Besides, the pristine CDs present two broad diffraction peaks at 25° and 43°, consistent with (002) and (100) planes of graphitic carbon, respectively (Fig. S1 in Supporting information) [23]. The C-DH@IN composites show the similar diffraction peaks as DH@IN, suggesting that the crystalline structure of DH@IN is maintained after the addition of the CDs. Moreover, there is no obvious peak belonging to CDs in the C-DH@IN due to their low content, ultra-small size as well as uniform dispersion [24].
Figure 1
Figure 1.
(a) X-ray diffractometer (XRD) patterns of In2O3, NiAl-LDH, DH@IN-50 and C-DH@IN composites. (b) Raman spectra of In2O3, NiAl-LDH, DH@IN-50 and 3% C-DH@IN composites. (c) XPS survey spectra of NiAl-LDH, DH@IN and 3% C-DH@IN. High resolution XPS spectra of O 1s. (d–i) Corresponding elemental mapping images of C-DH@IN.
The presence of CDs and surface defects of C-DH@IN were verified by Raman spectra (Fig. 1b). The DH@IN heterostructure shows the peaks of both In2O3 and NiAl-LDH at 130 and 149 cm−1. In addition, the 3% C-DH@IN has typical D band (1360 cm−1) and G band (1580 cm−1) caused by CDs [25], suggesting that CDs have been successfully embedded into the DH@IN composites. The BET surface area values of In2O3 and NiAl-LDH are 32 and 52 m2/g, respectively, yet the DH@IN-50 exhibits the highest surface area (82 m2/g), meaning that the heterostructure possesses more porous structure after in-situ synthesis process. With addition of CDs, 3% C-DH@IN (61 m2/g) is decreased compared with DH@IN-50, which reveals that the implanted CDs partially occupy the pores of DH@IN-50.
From scanning electron microscope (SEM) and transmission electron microscope (TEM) images (Fig. S2 in Supporting information), after construction of C-DH@IN, the nanoflower morphology of NiAl-LDH disappears and In2O3 nanotube is well defined wrapped in multilayer NiAl-LDH nanosheets to fabricate the multi-layer heterostructure, which possesses numerous catalyst active sites and intimate contact between NiAl-LDH and In2O3 resulting from the spatial effect. Besides, the addition of CDs has no effect on the morphology of DH@IN and the NiAl-LDH nanosheets are uniformly dispersed on the In2O3 surface, which exhibits that the strong interaction can facilitates the migration of photogenerated carriers and light absorption, thus promoting the photocatalytic performance. As observed in the high-resolution transmission electron microscope (HRTEM) image (Fig. S2 h), the interplanar distances of 0.29, 0.26 and 0.21 nm correspond to the (222), (012) and (100) planes of In2O3, NiAl-LDH and CDs [26], respectively. As depicted in Fig. S14 (Supporting information), the TEM image of the used 3% C-DH@IN shows no deviation from its initial state, maintaining In2O3 nanotube with multi-layer structure. In addition, the elemental composition of C-DH@IN was investigated by energy dispersive spectrometer (EDS) spectra in Fig. S2i, and from the results, the C, O, In, Ni and Al elements are present in the C-DH@IN. The elemental mapping of C-DH@IN exhibits that the C, Ni and Al elements are well-dispersed on the In and O elements, which suggests that the NiAl-LDH and CDs are uniformly coated on In2O3 without agglomeration, furthering confirming that the multi-layer nanotube is constructed successfully.
The elemental compositions and chemical states of NiAl-LDH, DH@IN-50 and 3% C-DH@IN were detected using X-ray photoelectron spectroscopy (XPS) spectra (Fig. S3a in Supporting information). The In 3d spectrum (Fig. S3b in Supporting information) of DH@IN consists of two primary peaks at 444.0 and 451.5 eV, which are assigned to In 3d5/2 and In 3d3/2 of In3+, respectively [27]. The binding energies of C-DH@IN slightly move to the lower binding energy in comparation with binary DH@IN, probably caused by the strong interaction between CDs and DH@IN. In the O 1s spectra (Fig. 1c), for NiAl-LDH, two peaks situated at 532.7 and 531.5 eV are assigned to adsorbed oxygen (Oabs) and hydroxide groups (O—H), while the DH@IN exhibits that three characteristic peaks at 529.3, 531.4 and 532.9 eV are consistent with lattice oxygen (OL), oxygen vacancies (O—H) [28], and adsorbed oxygen (Oabs), respectively, indicating that the as-prepared catalysts possess the abundant O—H. The Ni 2p peaks of NiAl-LDH (Fig. S3c in Supporting information) at 856.3 and 873.9 eV result from Ni 2p3/2 and Ni 2p1/2 [29], respectively, in accordance with the Ni2+ oxidation state. Obviously, after formation of C-DH@IN, the peaks of Ni 2p move toward a higher binding energy in comparation with bare NiAl-LDH, illustrating that the photoexcited electrons are migrated from NiAl-LDH to In2O3 upon hybridization. Similar, the Al 2p spectrum of C-DH@IN (Fig. S3d in Supporting information) is composed of two peaks at 69.3 and 74.8 eV, due to Al 2p3/2 and Al 2p1/2 of Al3+ [30], which also move to higher binding energy compared with NiAl-LDH. For C-DH@IN (Fig. S3e in Supporting information), the peaks of C 1s spectrum at 284.6, 286.2 and 288.7 eV are consistent with C—C, C—O and C═O bonds, respectively, which belong to CDs [31]. From the elemental mapping images of C-DH@IN (Figs. 1d–i), it can be observed that the C, Ni and Al elements are uniformly coated on the In2O3 nanotubes, forming a distinctive multi-shell structure.
The photocatalytic CO2RR performances of C-DH@IN composites were performed in H2O solution without any photosensitizer and sacrificial agent under simulated solar irradiation. The CO and CH4 yields of In2O3 are 3.27 and 2.16 µmol g−1 h−1, respectively, while the CO and CH4 yields of NiAl-LDH are very low, only 2.45 and 0.55 µmol g−1 h−1, respectively. Besides, the photocatalytic performances of binary DH@IN catalysts are much higher than those of In2O3 and NiAl-LDH, exhibiting that the formed heterojunction can facilitate the separation of photoexcited electron-hole pairs. Notably, the (CO + CH4) yields in C-DH@IN are improved significantly after introduction of CDs, and the optimal CO and CH4 yields of 3% C-DH@IN are up to 7.12 and 10.67 µmol g−1 h−1 (Fig. 2a), respectively, exceeding the performances of many other similar catalysts (Table S2 in Supporting information). In addition, the CO and CH4 yields of the C-DH@IN are affected by adjusting the loading of CDs.
Figure 2
Figure 2.
(a) Photoreduction performances, (b) Relectron and (c) carbon products selectivity of In2O3, NiAl-LDH, DH@IN-50 and C-DH@IN composites. (d) Stability test of 3% C-DH@IN with four 5 h cycles. (e) Production rates of CO and CH4 under various reaction conditions. (f) XRD patterns of 3% C-DH@IN before and after CO2 photoreduction experiment.
On account of the formula Relectron = 2R(CO) + 8R(CH4), Fig. 2b presents the average electron consumption rate (Relectron), in which R(CO) and R(CH4) mean the yields of CO and CH4 respectively. The Relectron of 3% C-DH@IN is up to 99.59 µmol g−1 h−1, which is 4.19 and 10.74-fold higher than those of In2O3 and DH@IN, respectively. It is noted that, the selectivity of CH4 over 3% C-DH@IN is as high as 85.7% (Fig. 2c), whereas that for NiAl-LDH and DH@IN is only 47.3% and 74.3%, respectively, demonstrating that more generated CH4 is due to the introduction of CDs that could absorb more H+. The control experiment was carried out to further verify the products (CH4 + CO) source (Fig. 2e). When the Ar atmosphere is used to replace the CO2 atmosphere, trace amounts of CO are detected by chromatography, indicating that the CH4 is indeed from CO2 instead of other carbon source. Furthermore, no gaseous products are observed in the absence of catalyst or in a dark environment, suggesting that catalyst and light source are necessary for CO2RR. The 3% C-DH@IN catalyst maintains excellent photocatalytic performance after four 5-h cycles, which indicates that the constructed heterojunctions possess good stability (Fig. 2d). Fig. 2f shows that the main crystalline phase of C-DH@IN remains unchanged after the photocatalytic reaction, suggesting that C-DH@IN has excellent stability and reusability.
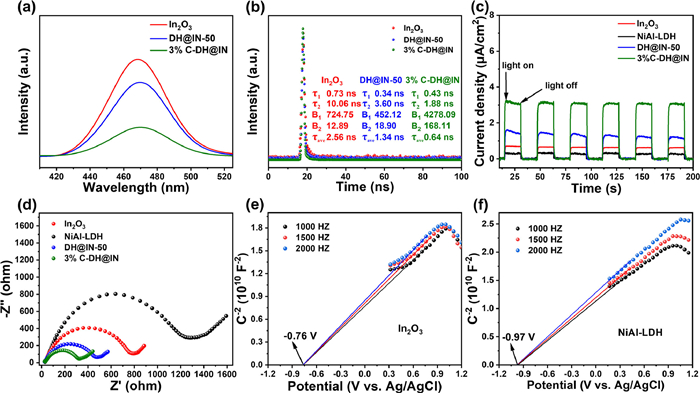
With the increase of CDs loading, the absorption edge of C-DH@IN moves to the larger wavelengths, indicating that the ternary heterostructure significantly promotes the visible-light absorption. The band gap values of In2O3 and NiAl-LDH can be obtained from the Tauc curves (Fig. S4b in Supporting information), where the band-gap values of In2O3 and NiAl-LDH are 2.68 and 2.25 eV, respectively. The pure In2O3 exhibits an intense steady-state photoluminescence (PL) signal at 470 nm (Fig. 3a), indicating a severe recombination of photoinduced charge [32]. Compared to pristine In2O3, the DH@IN-50 displays a significant PL quenching, indicating that the charge carrier recombination is sufficiently suppressed. After incorporation of CDs, the PL intensity of C-DH@IN decreases significantly, resulting from the further improvement of charge transfer efficiency. Furthermore, the average PL lifetimes (τave) of In2O3, DH@IN-50 and 3% C-DH@IN were estimated by time-resolved photoluminescence decay (TR-PL) spectra (Fig. 3b), with values of 2.56, 1.34 and 0.64 ns for In2O3, DH@IN-50 and 3% C-DH@IN [33], respectively. In addition, the 3% C-DH@IN shows faster PL decay and shorter average lifetime compared to DH@IN-50, indicating that CDs suppress the charge recombination and promote charge transfer.
Figure 3
Figure 3.
(a) PL and (b) TRPL decay of In2O3, DH@IN-50 and 3% C-DH@IN. (c) Transient photocurrent responses and (d) EIS Nyquist plots of In2O3, NiAl-LDH, DH@IN-50 and 3% C-DH@IN. Mott–Schottky plots of (e) In2O3 and (f) NiAl-LDH.
Photoelectrochemical tests were used to explore the photoexcited charge separation efficiency of In2O3, NiAl-LDH, DH@IN-50, and 3% C-DH@IN. The incorporation of CDs into DH@IN can dramatically enhance the current density of C-DH@IN and promote carrier separation (Fig. 3c). Fig. 3d displays that the arc radius of 3% C-DH@IN is the smallest, indicating that 3% C-DH@IN photocatalyst has lower resistance as well as good charge transfer capability compared with pure In2O3 and NiAl-LDH [34]. In order to study the energy band structure, the Mott–Schottky (M–S) curves of In2O3, and NiAl-LDH were measured at different frequencies as shown in Figs. 3e and f. The flat-band potentials (EFB) values for In2O3 and NiAl-LDH can be determined from the intercepts of M–S plots, which are −0.76 and −0.97 V, respectively (vs. Ag/AgCl). EFB values of In2O3 and NiAl-LDH are calculated to be −0.56 and −0.77 V (vs. NHE), respectively, according to the equation ENHE = EAg/AgCl + 0.197. It is well known that the conduction band (ECB) of the n-type semiconductor is about 0.10 V below EFB. As a result, ECB of In2O3 and NiAl-LDH are determined to be −0.66 and −0.87 V vs. NHE, respectively. Based on the equation ECB = EVB - Eg, the EVB values of In2O3 and NiAl-LDH are 2.02 and 1.38 V (vs. NHE), respectively.
Electron spin resonance (ESR) spectra of In2O3, DH@IN-50 and 3% C-DH@IN were used to investigate the existence of ·O2− as well as ·OH (Fig. 4a and Fig. S15 in Supporting information). The DMPO-·O2− signals indicate that the photoexcited electrons-enriched ECB on C-DH@IN is more negative than the potential of O2/·O2− (−0.33 V vs. NHE), thus leading to the production of ·O2− active species. More importantly, the clear DMPO-·OH signals can be observed (Fig. 4b), which means that the holes-accumulated EVB is more positive than the potential of OH−/·OH (1.99 V vs. NHE) [35]. These findings verify that the C-DH@IN constructs the S-scheme heterojunction and thus possesses a strong redox ability.
Figure 4
Figure 4.
(a) DMPO-·O2− and (b) DMPO-·OH spin-trapping ESR spectra of 3% C-DH@IN. (c) In situ FT-IR of 3% C-DH@IN. (d) The photocatalytic reaction pathways of C-DH@IN. (e) Schematic illustration of charge transfer over C-DH@IN under simulated solar light.
Furthermore, the in-situ FT-IR spectra of C-DH@IN were carried out in the range of 1200–1800 cm−1 to study the reaction pathway of CO2RR (Fig. 4c). The multiple intermediate products are detected and corresponding peak intensity is enhanced with prolonged irradiation time. The peaks of m-CO32− (1419, 1488, 1522 and 1541 cm−1), b-CO32− (1372, 1559 and 1627 cm−1) and HCO3− (1219, 1396, 1440, 1461 and 1478 cm−1) groups are detected during photocatalytic CO2RR [36], due to the interaction of absorbed CO2 and H2O on C-DH@IN catalyst. Meanwhile, H2O as only solvent is reacted with photoexcited holes to produce O2, and notably, the peaks of HCOO− (1637 and 1648 cm−1), COO− (1361 cm−1) and CH3O− (1698 and 1732 cm−1) groups emerge with illumination time, revealing that HCOO− and CH3O− are considered as the active species and key intermediate for CO2RR [37]. Besides, the primary CO2− (1684 cm−1) peaks are observed caused by the conversion of CO2 to CO, and the peaks at 1448 and 1387 cm−1 result from the methyl groups of CH4, which verify the generation of CO and CH4, implying that multi-electron transfer pathway exists in the CO2RR process of C-DH@IN. Atomic force microscopy together with Kelvin-probe force microscopy (AFM-KPFM) is used to explore the potential surface distribution of C-DH@IN (Fig. S16 in Supporting information). The surface potential under solar irradiation is higher than that in the darkness, revealing C-DH@IN S-scheme heterojunction with a strong built-in electric field.
Accordingly, the proposed S-scheme for photocatalytic CO2RR on C-DH@IN is illustrated in Fig. 4e. The S-scheme heterojunction with the intimate contact from the multi-shell nanotube facilitates that the electrons are transferred from In2O3 to NiAl-LDH and generates an internal electric field (IEF) caused by the different Fermi levels between the above two semiconductors, thus resulting in the band edge bending. Driven from IEF as well as band bending, the elections in the ECB of In2O3 recombine with holes in the EVB of NiAl-LDH, and thus the electrons on the ECB of NiAl-LDH and holes on the EVB of In2O3 are well preserved, which exhibits that the reserved electrons and holes possess the stronger redox capability for CO2RR. Notably, CDs in C-DH@IN as an electron mediator and charge transport highway at the interface between In2O3 and NiAl-LDH can effectively boost the charge transfer and enhance the redox reaction.
In summary, we report a novel S-scheme C-DH@IN heterojunction for photocatalytic CO2RR, which was fabricated through a facile in situ hydrothermal method. In the pure water without sacrificial agent, the 3% C-DH@IN catalyst shows the highest CO2RR activity (CO: 7.12 µmol h−1 g−1; CH4: 10.67 µmol h−1 g−1) under simulated solar irradiation, and CH4 selectively of optimal catalyst is up to 85.7%. The ESR, in-situ FT-IR and photoelectric measurements verify the S-scheme mode in C-DH@IN heterostructure with strong redox capability, and meanwhile exhibit that HCOO− and CH3O− as crucial intermediates are existed in conversion of CO2 into CH4. The CDs in C-DH@IN catalyst can acts as an "electron bridge" between NiAl-LDH and In2O3, to facilitate the establishment of the IEF and band bending, and what is more, CDs can absorb more H+ to promote the CH4 selectively. This study provides a new strategy for the design and development of robust and efficient photocatalysts for the selective conversion of CO2 to hydrocarbon fuels.
Declaration of competing interest
The authors declare that they have no known competing financial interests or personal relationships that could have appeared to influence the work reported in this paper.
Acknowledgments
This work was supported by the National Natural Science Foundation of China (Nos. 21876015, 21703019), Qinglan Project Foundation of Jiangsu Province.
Supplementary materials
Supplementary material associated with this article can be found, in the online version, at doi:10.1016/j.cclet.2023.108942.
[1]
C. Zhao, Z. Jiang, Y. Liu, et al., J. Am. Chem. Soc. 144 (2022) 23560–23571. doi: 10.1021/jacs.2c10687
Figure 1
(a) X-ray diffractometer (XRD) patterns of In2O3, NiAl-LDH, DH@IN-50 and C-DH@IN composites. (b) Raman spectra of In2O3, NiAl-LDH, DH@IN-50 and 3% C-DH@IN composites. (c) XPS survey spectra of NiAl-LDH, DH@IN and 3% C-DH@IN. High resolution XPS spectra of O 1s. (d–i) Corresponding elemental mapping images of C-DH@IN.
Figure 2
(a) Photoreduction performances, (b) Relectron and (c) carbon products selectivity of In2O3, NiAl-LDH, DH@IN-50 and C-DH@IN composites. (d) Stability test of 3% C-DH@IN with four 5 h cycles. (e) Production rates of CO and CH4 under various reaction conditions. (f) XRD patterns of 3% C-DH@IN before and after CO2 photoreduction experiment.
Figure 3
(a) PL and (b) TRPL decay of In2O3, DH@IN-50 and 3% C-DH@IN. (c) Transient photocurrent responses and (d) EIS Nyquist plots of In2O3, NiAl-LDH, DH@IN-50 and 3% C-DH@IN. Mott–Schottky plots of (e) In2O3 and (f) NiAl-LDH.
Figure 4
(a) DMPO-·O2− and (b) DMPO-·OH spin-trapping ESR spectra of 3% C-DH@IN. (c) In situ FT-IR of 3% C-DH@IN. (d) The photocatalytic reaction pathways of C-DH@IN. (e) Schematic illustration of charge transfer over C-DH@IN under simulated solar light.


 DownLoad:


 下载:
下载:


