Citation:
Du Yuting, Gao Denglei, Zhang Na, Yi Ding, Wang Xi. Regulation of the d-Orbitals of Platinum through Low-Entropy Alloying#[J]. Chemistry,
2020, 83(7): 652-658.
Regulation of the d-Orbitals of Platinum through Low-Entropy Alloying#
摘要:
It has been reported that precisely regulating the electronic structures of the active site is one of the most effective means to realize precise catalysis, which often includes lattice strain and charge transfer, etc. In doping systems, some new theories, such as the Atom-Realm (AR) effect, have been used to explain the changes in physical and chemical properties of the substrates caused by the geometry and electronic structures of the active heteroatom sites. Based on the low-entropy alloy and using the first-principles calculations, we report a new strategy for achieving precise catalysis through regulating the orbitals and spin of the active sites, i.e. doping Fe atoms in Pt to change its d-orbitals for the regulation of catalytic performance. We established both the models of pure Pt and Pt-Fe alloy and calculated the O2 adsorption energy on different active sites. We found that doping Fe atoms in pure Pt can weaken the binding of O2-Pt without affecting the O2 dissociation. Based on the projected density of states (PDOS) analysis, the hybridization of Fe-3d and Pt-5d states leads to the shift of atomic orbitals as well as the spin polarization of Pt metal. Therefore, part of the electronic states of Pt move above the Fermi level and overlap with O2-π*, making the hybridization of O2-π* and Pt-5d states in Pt-Fe alloy much stronger than that in pure Pt. The regulation of d-orbitals results in the improvement of the catalytic activity of O2 on the surface of Pt-Fe alloy. Our study predicts that the orbital catalysis and spin catalysis will provide an effective method for precise catalysis as well as high-efficient catalysts design.
Abstract:
It has been reported that precisely regulating the electronic structures of the active site is one of the most effective means to realize precise catalysis, which often includes lattice strain and charge transfer, etc. In doping systems, some new theories, such as the Atom-Realm (AR) effect, have been used to explain the changes in physical and chemical properties of the substrates caused by the geometry and electronic structures of the active heteroatom sites. Based on the low-entropy alloy and using the first-principles calculations, we report a new strategy for achieving precise catalysis through regulating the orbitals and spin of the active sites, i.e. doping Fe atoms in Pt to change its d-orbitals for the regulation of catalytic performance. We established both the models of pure Pt and Pt-Fe alloy and calculated the O2 adsorption energy on different active sites. We found that doping Fe atoms in pure Pt can weaken the binding of O2-Pt without affecting the O2 dissociation. Based on the projected density of states (PDOS) analysis, the hybridization of Fe-3d and Pt-5d states leads to the shift of atomic orbitals as well as the spin polarization of Pt metal. Therefore, part of the electronic states of Pt move above the Fermi level and overlap with O2-π*, making the hybridization of O2-π* and Pt-5d states in Pt-Fe alloy much stronger than that in pure Pt. The regulation of d-orbitals results in the improvement of the catalytic activity of O2 on the surface of Pt-Fe alloy. Our study predicts that the orbital catalysis and spin catalysis will provide an effective method for precise catalysis as well as high-efficient catalysts design.
Catalyst is the key to improving chemical reactions, which can be found in most industrial chemical processes. With the rapid development of the chemical and energy industry, finding the new catalysts with high activity[1, 2], selectivity[3, 4], and stability[5, 6]becomes the focus of research. As one of the scarcest noble metals on Earth, Pt is the industrial catalyst with excellent performance, which has broad application prospect in fuel cell and electrocatalysis[7~10]. However, due to its high cost, Pt metal cannot be heavily used in industrial production, and the Pt catalyst is easily poisoned by reacting with sulfide or carbon monoxide[11, 12].
A number of methods have been explored to improve the Pt metal utilization and catalytic activities of Pt-based catalysts. Among them, doping heteroatom into Pt catalysts has been proved to be an effective way. The influence of heteroatoms seems to obey the Atom-Realm (AR) effect[13, 14], which reveals that the doped heteroatoms can produce an environmental effect and alter the electronic properties of surrounding atoms, resulting in the regulation of the catalytic activity. The AR effect is more remarkable on atomically dispersed 2D nanomaterials, which provides new strategies for designing catalysts with high activity and selectivity.
Based on AR effect, doping transition metals in Pt to make binary alloy is a simple approach. Compared with the pure Pt metal catalyst, the Pt-M (M=Fe, Co, Ni, etc.) alloys not only reduce the cost of catalyst, but also increase the catalytic activity for some reactions. In addition, the doping of transition metals can adjust both the geometric and electronic structures of surface Pt atoms, thereby improving the selectivity of the catalyst with good anti-poisoning ability[15~18]. In general, the distribution of both elements in a binary alloy is disordered (high-entropy). Using Pt and other transition metals to build the layer-by-layer structure (low-entropy) alloy in atomic-scale can bring more active sites and some unique natures to the catalyst. Using the atomic layer deposition, Steven et al. have successfully prepared a layer-by-layer structure of Ir-Pt alloy films, and grew the Ir-Pt alloy film on high-aspect-ratio trenches[19]. Xie et al. reported a new catalyst towards oxygen reduction with high activity, stability and lower cost by depositing Pt on Pd nanocubes[20].
Compared with experiments, theoretical simulations can quickly analyze the interaction between catalysts and adsorbates, thus reveal the catalytic mechanism[21, 22], and even predict new feasible catalysts[23, 24]. In this work, based on the face-centered cubic (FCC) Pt and L10-ordered FePt structures, we built the (001) surfaces of pure Pt and Pt-Fe alloy, which have the same uppermost layer. As the adsorption and dissociation of oxygen are two key steps in oxygen reduction reaction[25], we studied the adsorption of O2 molecules on both surfaces and found that the introduction of Fe layers obviously weakens the adsorption of O2 molecules without affecting their dissociation.
2.
Computational Methods
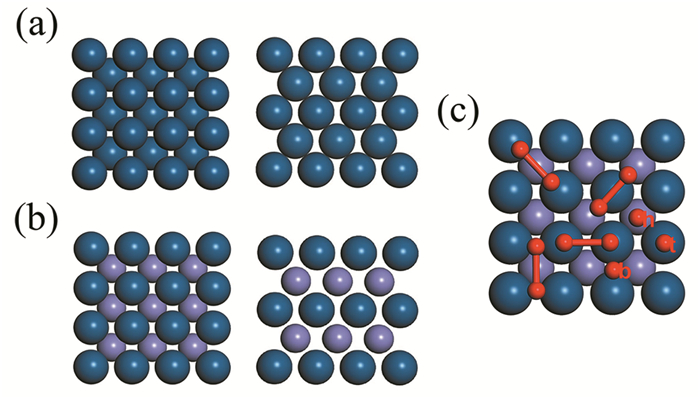
All calculations were performed with Vienna Ab Initio Simulation Package (VASP) based on the density functional theory (DFT)[26, 27].We used the generalized gradient approximation (GGA) within Perdew-Burke- Ernzerhof (PBE) functional to describe the exchange-correlation energy and the projector augmented wave (PAW) method for the pseudopotentials[28~30]. The plane-wave energy cutoff was fixed at 400 eV. The van der Waals (vdW) interactions were also involved by using the DFT-D3 scheme of Grimme[31]. To calculate the energy and the projected density of states (PDOS) of an isolated O2 molecule, we put one O2 molecule in a cubic box of 10×10×10Å3, and used a 1×1×1 k-point grid for the first Brillouin zone sampling. The 3×3 slabs of Pt(001) and L10-FePt(001) were modeled with 5-layer-thick. And we used a 15 Å vacuum to separate periodic images. For structural relaxation, the 3×3×1 k-point grids for the first Brillouin zone sampling was used, and the bottom three layers were fixed, thus the top two layers and the adsorbates were allowed to relax fully until reaching the force convergence (10-2eV/Å). As shown in Fig. 1 (a, b), except that the Pt atoms in the second and fourth layers are replaced by Fe atoms, the others are the same as Pt slab. A much larger k-point grid (5×5×1) was used in the PDOS calculations. The details of the investigation will be discussed below.
Figure 1.
Top and side views of the (a) pure Pt and (b) Pt-Fe alloy. (c) Top view of O2 molecular configuration on Pt-Fe. Here, blue, violet, and red balls symbolize Pt, Fe, and O atoms, respectively
All the possible O2 adsorption sites were studied as shown in Fig. 1 (c). In order to easily describe the O2 adsorption site, we referred to some papers[32, 33], and indicated the top site, bridge site and the hollow site by "t, b, h", respectively. For example, the t-h-t means that two O atoms are located on the top of two Pt atoms, the center of mass (cm) of the oxygen is on the hollow site between two Pt atoms, and the O-O bond is parallel to the surface. In this work, we also considered the configurations of O-O bond perpendicular to the surface. After structural relaxation, we found that all the perpendicular configurations are not stable and will lie down quickly. For parallel configurations, only the t-b-t is stable in both slabs, in which O2 holds its molecular configuration. Therefore, we only considered this configuration for further study.
Tab. 1 lists some calculated data on the t-b-t adsorption site of those two systems. Firstly, we calculated the adsorption energy of O2 on Pt(001) and L10-FePt(001) surfaces based on the following equation:
Table 1
表 1dPt-O, dO-O以及z分别表示铂氧、氧氧键的键长以及氧气分子距吸附表面的高度
Table 1.dPt-O, dO-O, and z represent the Pt-O, O-O bond length, and the vertical distance of the O2 molecule from two metal surfaces, respectively
Where the Etotal and Eslab is the energy of the system with and without adsorbate, respectively, and Eadsorbate is the energy of an isolated O2 molecule. The calculated adsorption energies were shown in Tab. 1. Obviously, the adsorption of O2 on Pt(001) surface is stronger than that on FePt(001) surface (-1.41 eV vs -0.82 eV). In accordance with the adsorption energy, the bond length of Pt-O on FePt(001) surface is longer than that on Pt(001) surface (2.06 Å vs 1.97 Å), and we also noted that the height of the O2 molecule from the slab surface is higher for Pt-Fe alloy (1.94 Å vs 1.80 Å) meaning that the adsorption strength is markedly reduced on Pt-Fe alloy. However, the dO-O (1.37 Å) has no difference between both systems. For gaseous O2 molecule, the bond length is 1.23 Å in our calcul-ation, which is consistent with the experimental value (1.21 Å)[34]. From simple geometry analysis, we can find out that although the adsorption of O2 on Pt-Fe alloy is weakened, the catalytic activity for O2 dissociation still remains. In order to reveal this phenomenon, we need to further analyze the electronic structure of the system and the effect of Fe on Pt.
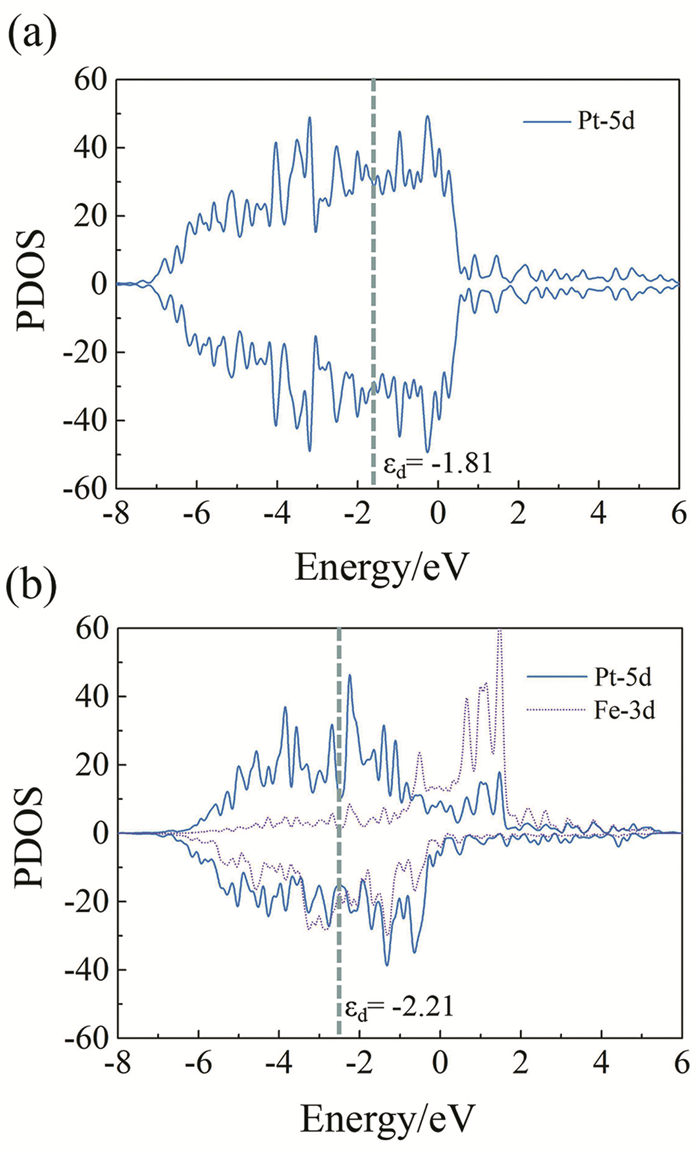
As shown in Fig. 2 (a), the 5d orbital of Pt is spin degenerate as the up-spin state is symmetry to the down-spin state. When Fe layers are inserted, the ferromagnetic state of Fe affects the spin state of Pt obviously due to the hybridization of Pt-5d states with Fe-3d states, making the whole system spin non-degenerate (see Fig. 2 (b)). Meanwhile, a net magnetic moment of 0.38 μB could be found on one surface Pt atom (Tab. 1). The d-band center can be used to describe the adsorption strength of transition metal and the adsorbates[35]. The change of the atomic orbital can be expressed as:
Figure 2.
(a) PDOS of the 5d orbital of a surface Pt atom in pure Pt; (b) PDOS of the 5d orbital of a surface Pt atom and the 3d orbital of an adjacent Fe atom in Pt-Fe alloy. The d-band center is also shown by dashed lines
Here, nd(ε) represents the density of states at the energy of ε. In this study, the integral interval of this formula is from -∞ to +∞. With the transition metal εd closer to the Fermi level, the interaction between catalysts and adsorbates will become stronger. The d-band center of pure Pt is -1.81 eV, higher than that of Pt-Fe alloy, which is -2.21 eV. It is well consistent with the adsorption strength we obtained above. Actually, the downward shift of d-band center is due to the upward shift of Fermi level. From the Bader charge analysis shown in Tab. 1[36], we can find out that more electrons are injected into Pt atoms in Pt-Fe alloy than in pure Pt (0.45 e vs 0.14 e), which leads to the relative downward shift of the d-band center.
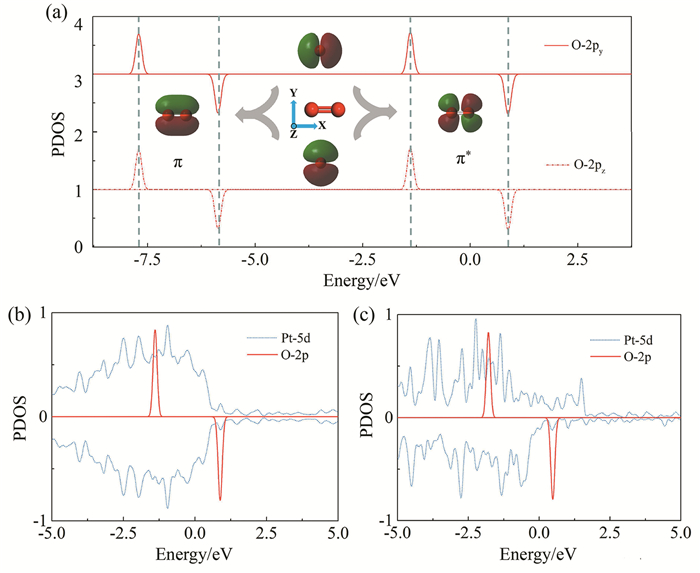
Fig. 3(a) shows the PDOS projected onto O atom orbitals (py, pz) in the O2 molecule. The pz and py orbitals constitute the π and π* orbitals, and the O-2p states are spin non-degenerate. The O2-π* orbitals split into two orbitals with opposite spin orientations near the Fermi level. To observe the overlapping of Pt-d and O-p orbitals before O2 adsorption, we aligned the vacuum level of Pt and O2, and showed the PDOS of O-p (actually O2-π*) and Pt-d states in Fig. 3 (b)(c). Around the spin up O2-π* orbitals (below Fermi level), the distribution of Pt-d orbitals in pure Pt and Pt-Fe alloy is similar. However, above Fermi level, due to the upward shift of the Pt-d orbital caused by Fe doping, more states of Pt-5d appear around the O2-π* in Pt-Fe alloy, but in pure Pt, Pt-5d states do not show the same character.
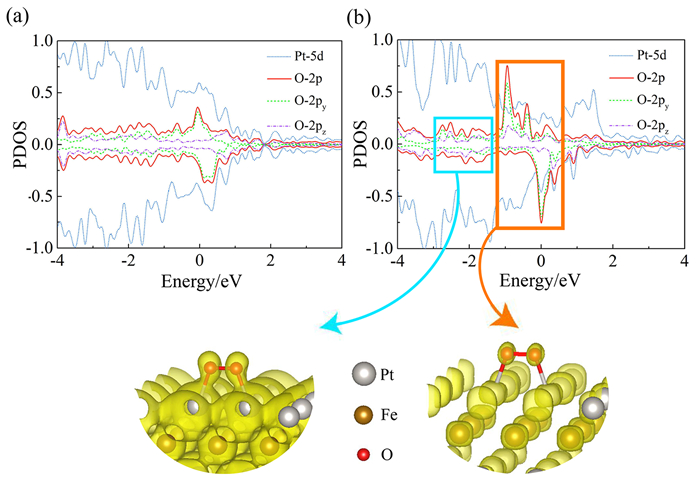
Fig. 4 (a) and (b) show the PDOS of O-2p and Pt-5d states after O2 adsorption. The apparent hybridization of both orbitals occurs around the Fermi level in pure Pt and Pt-Fe alloy, respectively. We noted that these hybridized states in Pt-Fe alloy are much stronger than in pure Pt, and these hybridized states are composed of py and pzorbitals. In other words, they are composed of O2-π* orbitals.
Figure 4.
(a) and (b) is the Pt/O PDOS of the pure Pt slab and the Pt-Fe alloy slab. We used the local charge distribution to show the O2-Pt bonding and anti-bonding in Pt-Fe alloy. The selected energy range is marked with the blue and orange rectangles, respectively, and the yellow area represents the charge distribution. The isosurface value is 0.02 e/Bohr3
Using the local charge distribution, we analyzed the bond character. First, focusing on the charge distribution near O-O bond, it indeed shows the anti-bonding character. Second, comparing the Pt-O bond, Fig. 4(b) shows the bonding character and anti-bonding character, respectively. Comparing the PDOS of pure Pt and Pt-Fe alloy, the anti-bonding state of O2-π* and Pt-5d in Pt-Fe alloy is much stronger than that in pure Pt, and filled by more electrons, so that the O2 molecule adsorbed on Pt-Fe alloy is much weakened. Meanwhile, more electrons occupy the O2-π* orbital, making the O2 dissociation easy (no change in O-O bond length).
Till now, we can understand why doping Fe atoms can reduce the O2 adsorption on Pt without affecting its dissociation. If we consider a complete reaction, such as oxygen reduction reaction (ORR), without changing the dissociation of O2 molecules, the desorption of adsorbates becomes easier, resulting in faster release of active sites. Thus, we believe that such regulation improves the catalytic activity for O2 related reactions, which has been confirmed experimentally[37].
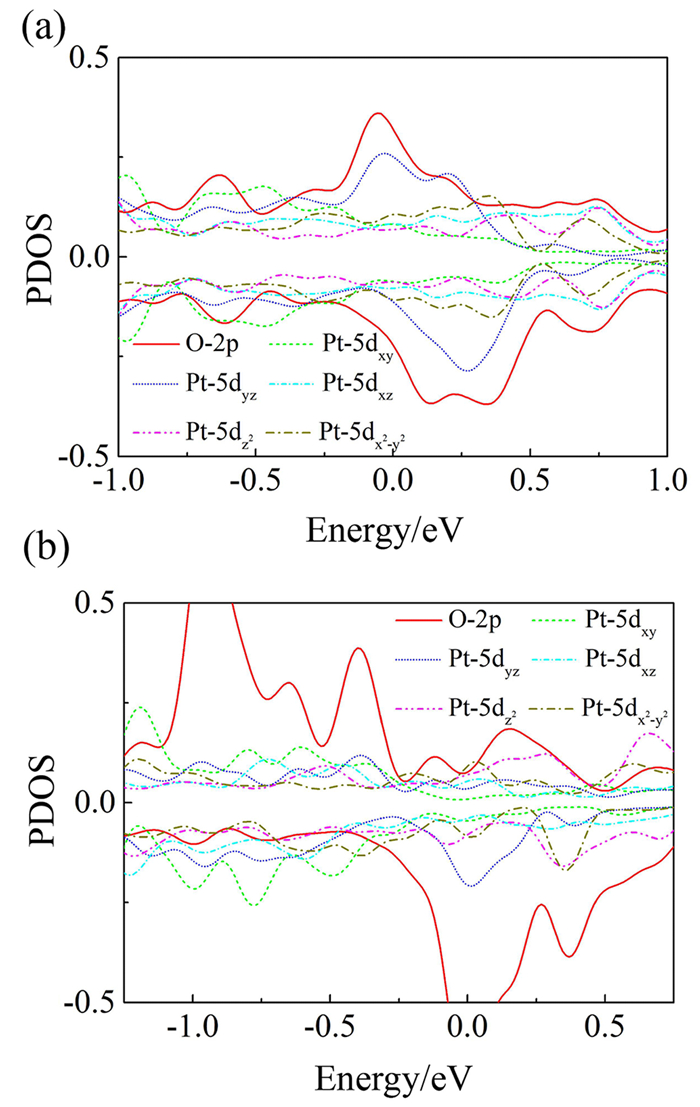
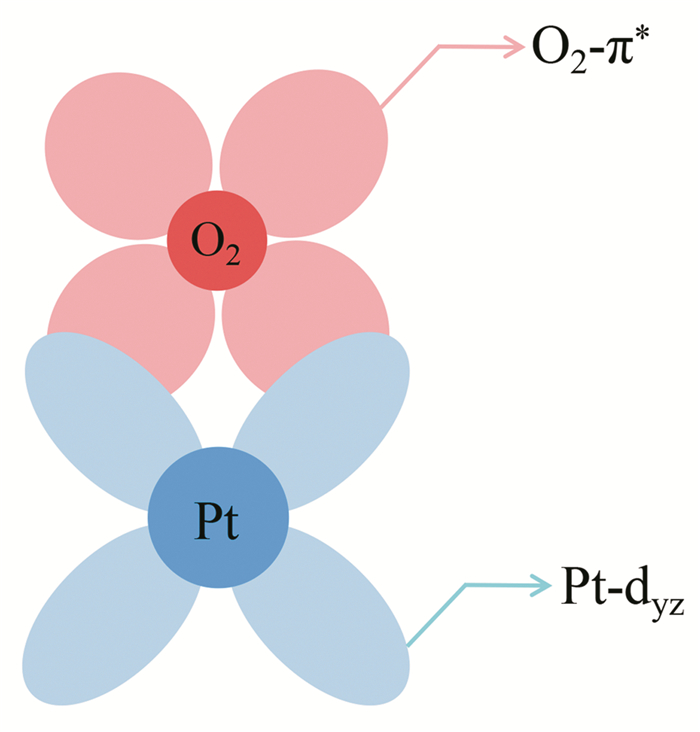
In Fig. 5, we enlarged the region of afore-mentioned the O2-π* and Pt-5d hybridized regions and showed the PDOS of Pt-dxy, dyz, dxz, dz2, and dx2-y2 in the pure Pt and Pt-Fe alloy, respectively. The Pt-dyz has the strongest hybridization with the O2-π*, while the remaining four Pt-d states show the weak hybridization. In terms of the spatial distribution of the electron cloud, it is easy to understand why the hybridization of Pt-dyz and O2-π* is so strong, as shown in Fig. 6.
Based on first-principles calculations, we investigated O2 adsorption on the surfaces of pure Pt and low-entropy Pt-Fe alloy. Compared with pure Pt, the adsorption of O2 on Pt-Fe alloy was weakened, but the dissociation of O2 remained unchanged. Based on the PDOS analysis of Pt-5d states in both pure Pt and Pt-Fe alloy, we found that doping Fe atoms greatly changed the Pt-5d orbitals due to the hybridization of Fe-3d and Pt-5d. Some new states were induced above the Fermi level in Pt-Fe alloy, making the hybridization of Pt-d and O2-π* stronger. The regulation of Pt d-orbitals leads to increased catalytic activity of O2. Therefore, this low-entropy alloying strategy provides a new strategy for advanced catalysts.
Figure 1
Top and side views of the (a) pure Pt and (b) Pt-Fe alloy. (c) Top view of O2 molecular configuration on Pt-Fe. Here, blue, violet, and red balls symbolize Pt, Fe, and O atoms, respectively
Figure 2
(a) PDOS of the 5d orbital of a surface Pt atom in pure Pt; (b) PDOS of the 5d orbital of a surface Pt atom and the 3d orbital of an adjacent Fe atom in Pt-Fe alloy. The d-band center is also shown by dashed lines
Figure 4
(a) and (b) is the Pt/O PDOS of the pure Pt slab and the Pt-Fe alloy slab. We used the local charge distribution to show the O2-Pt bonding and anti-bonding in Pt-Fe alloy. The selected energy range is marked with the blue and orange rectangles, respectively, and the yellow area represents the charge distribution. The isosurface value is 0.02 e/Bohr3

 下载:
下载:

 下载:
下载:


