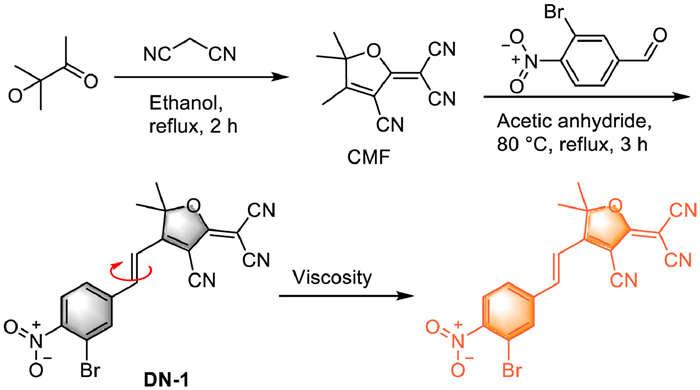
Scheme 1.
The synthesis and proposed mechanism of probe DN-1 for viscosity response.
Manifesting viscosity changes in lipid droplets during iodined CT contrast media treatment by the real-time and in situ fluorescence imaging
Ning Ding , Xueliang Liu , Aixia Meng , Xiuxiu Zhao , Gang Ma , Weina Han , Peng Dong , Jianchun Li , Jin Zhou

Computed tomography (CT) is one of the most commonly used non-invasive clinical imaging modalities to predict, diagnose and treat the disease by visualizing the internal structures owing to its wide availability, high efficiency and low cost [1]. Iodinated contrast media (ICM), first put into clinical practice in the 1950s, is a form of iodine containing agent in intravenous radiocontrast, which would improve the visibility of hollow tissue structures, for example, vascular structures, gastrointestinal tract, urinary tract, uterus, fallopian tubes and interior of joints during radiographic procedures in medical CT imaging by bringing more absorption and scattering of X-ray radiatlion [2]. Some pathologies, such as cancer, have especially enhanced visibility with ICM [3]. Over 75 million doses of iodinated contrast agents are required worldwide each year [4]. Iodine-based contrast media are generally be categorized into the ionic and nonionic types. Both kinds are applied in radiology commonly most as a result of their comparatively low side effects to the body and its good water solubility [5]. ICM may provoke allergic reactions, contrast-caused nephropathy, hyperthyroidism and possibly metformin accumulation. However, there are no absolute contraindications to ICM, so it is needed to weigh the benefits against the risks. For the patients suffering from myasthenia gravis, the ICM of the older fashioned has a greater possibility of raising the risk of exacerbation of the disease, while modern forms have been demonstrated to bring no immediate increased risk [6]. It is significant to find out the pathogenesis, hazard factors, diagnosis, precautions, and therapy of ICM caused adverse reactions.
As the highly ubiquitous and active organelles in cells, lipid droplets (LDs) play a vital part in many cellular lipid metabolism and storage functions, whose malfunction would cause some diseases including obesity and fatty liver [7]. Viscosity, which is a highly essential physicochemical parameter correlated to diffusion-controlled procedure, plays important roles in a lot of biological activities at the organismal and cell levels, such as cell activation, proliferation, migration and apoptosis [8]. It is worth noting that the operation of these unique functions in transporting and regulating biological processes of LDs highly rely on microenvironmental homeostasis particularly for viscosity [9]. As a result, it is particularly crucial to analyze LDs viscosity to investigate and diagnose LDs viscosity related diseases. Revealing the changes of the LDs viscosity in pathophysiological processes such as cancer and ICM induced adverse reaction is not only vital for surveying the occurrence and development of some pathophysiological processes but also vital for the deep insight of the biological effects of LDs in these pathophysiological processes. However, to the best of our knowledge, the alteration of the LDs viscosity during ICM induced viscosity changes is still unrevealed. Thus, developing a viable means for the in situ and real-time detecting the alteration of LDs viscosity is highly needed.
Fluorescence imaging is an emerging method to indicate cellular microenvironment changes and organelles function owing to a good deal of merits including nice operationality, in situ and real-time test and wonderful spatial resolution. Organic small molecular probes are fit for cellular organelles due to their high design flexibility, exact molecular weight, small size and good reproducibility [10-18]. Up to now, an increasing number of molecular probes for the sensing of cellular viscosity have been devised [19]. Nevertheless, the majority of them have the tendentiousness to locate in lysosomes or mitochondria, and a very small number of viscosity probes have the LDs-targeting property [8, 20]. Hence, it is greatly urgent to develop new fluorescent probes for the detection of LDs viscosity in iodined contrast media treatment.
In this work, we show the in situ and real-time imaging of the LDs viscosity in several vital pathophysiological processes by a special viscosity-sensitive fluorescent probe DN-1 (Scheme 1, (E)-3-(3-bromo-4-nitrostyryl)-5-(diisocyanomethylene)-4-isocyano-2,2-dimethyl-2,5-dihydrofuran, C18H11BrN4O3), whose synthetic route is outlined in Scheme 1. DN-1 was readily prepared by two steps and well characterized by 1H NMR, 13C NMR, and HRMS (high resolution mass spectrometer) in the supporting information.
With DN-1 in hand, its photophysical properties were first tested. The test solutions with a series of viscosity were prepared via regulating the content of glycerol and water mixtures. In the UV-vis absorption spectra (Fig. 1A), the probe DN-1 has an obvious absorption around 407 nm in pure water system; when DN-1 is placed in pure glycerol, its peak is redshifted to 436 nm in absorption spectrum. We conjectured that the inhibition of molecular rotation, which rises the planar conjugation degree, is probably responsible for the change of absorption spectrum. In the fluorescence spectral examination, DN-1 has a faint emission in water under the 458 nm excitation, because DN-1 molecules are able to rotate freely through conjugated double bonds, whose energy of excited state would be dispersed in the non-radiative decay process. While in pure glycerol with high viscosity, its fluorescence was significantly enhanced by 13-fold around 540 nm emission (Fig. 1B). The fluorescence color of DN-1 solution changed from colorless to yellow under 365 nm ultraviolet light (the inset of Fig. 1B). By the same token, pure glycerol blocks the free rotation of DN-1, which depresses the loss of non-radiative energy and raises the fluorescence intensity.
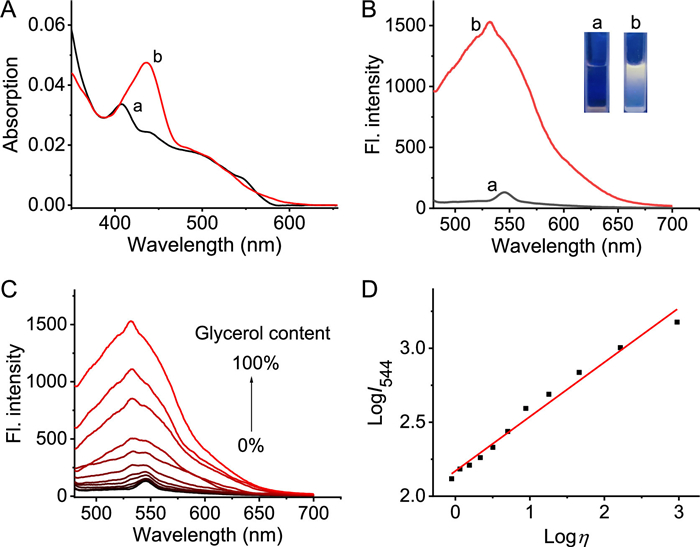
It is found that the fluorescence intensity of probe DN-1 went up significantly in the further detailed test, in which the viscosity of the water-glycerol mixed solution was improved from 0% to 100% (glycerol fraction), as shown in Fig. 1C. In addition, it was demonstrated that the fluorescence intensity response (logI544) and viscosity (logη) had nice linear relationship (R2 = 0.982, Pearson's efficient = 0.991, slope x = 0.368), by fitting the Förster-Hoffmann equation (Fig. 1D) [21]. The above results indicate that DN-1 has the great potential to probe viscosity changes.
The influences from the common environmental factors such as reaction time, pH and temperature on the probe fluorescence were measured. The concentration of DN-1 was fixed at 10 µmol/L. As displayed in Fig. S4A (Supporting information), in three various ratios glycerol-water systems (such as 10%, 50%, 70%), DN-1 showed the maximum emission intensity instantly and the emission intensity remained unchanged under excitation laser light illumination of half an hour, which proved that DN-1 had desirable photostability. In addition, the effect of solution pH on DN-1 was studied. As the dot graph shown in Fig. S4B (Supporting information), its corresponding fluorescence intensity fluctuated a little in a wide pH range of 4.0-11.0 covering the physiological acidity variation range, indicating that the alteration of pH values would slightly affect the fluorescence intensity of DN-1, which is probably due to that DN-1 has no reactive active sites for proton to gain or lose. Then we explored the effect of temperature on DN-1 fluorescence under different viscosity conditions (Fig. S4C in Supporting information). When the temperature changed from 20 ℃ to 45 ℃, the fluorescence intensity hardly changed in 10% glycerol-water system, which means that the solution with relatively low viscosity is insensitive to the temperature changes. While the fluorescence intensity was gradually depressed in 50% and 70% glycerol-water composite system as the temperature trended up, because as its temperature rise, the viscosity of liquid will be reduced and frequency of probe molecular collisions will increase, which could be responsible for the fluorescence intensity decrease. Therefore, it is believed that the probe DN-1 can serve as an efficient viscosity sensor in complex biological environments. Photoluminescence lifetime means the residence time on average of luminescent molecules in a singlet excited state, whose performance is not interferenced, compared to the fluorescene intensity test, by the common factors including photoluminescence intensity and concentration of luminescent molecules. Hence, the property information obtained via the lifetime is more stable [22]. As shown in Fig. S5 (Supporting information), the photoluminescence lifetime of DN-1 in solutions of various viscosities was tested to be in the short range from 2.9 ns to 4.2 ns, which indicates that the photoluminescence belongs to fluorescence and the solution viscosity has little effect on its fluorescence lifetime.
In order to investigate the effects of polarity on the fluorescence behavior of DN-1, we tested the fluorescence emission spectra of DN-1 in solvents with different polarities (water, THF (tetrahydrofuran), acetone, MeOH (methanol), DCM (dichloromethane), EAC (ethyl acetate), EtOH (ethanol), MeCN (methyl cyanide), glycerol. As histogram shown in Fig. S6 (Supporting information), DN-1 showed significant fluorescence enhancement only in glycerol. However, DN-1 displayed negligible response to other solvents with different polarity, whose intensity was far less than that in glycerol. These results revealed the much sensitivity of DN-1 to environmental viscosity over the polarity.
Special recognition ability was further evaluated afterwards. As shown in Fig. S7 (Supporting information), we conducted the selectivity experiments of DN-1 toward a variety of potential biologically-related substances, such as metal ions (Zn2+, Ag+, K+, Co2+, Cr3+, Ca2+, Sn2+, Mg2+, Hg+, Fe2+, Fe3+, Al3+), amino acids (Ser (serine), Arg (arginine), Ala (alanine), Leu (leucine), Asp (aspartic acid), Cys (cysteine)), reducing species (GSH, HSO3−, S2−, S42−) and reactive oxygen species (ClO−, ONOO−, NO2−, •OH, O2•−, H2O2). The fluorescence intensity enhancement of DN-1 only occurs in the glycerol induced high viscosity state, while the other added bioactive species did not affect the fluorescence intensity notablely. These experimental data confirm that the probe DN-1 has more specific selectivity for viscosity over other organism related species in complex biological microenvironment.
With the above sound optical performance of the DN-1 in hand, we explored the potential application of DN-1 to detect the intracellular viscosity alteration under various pathophysiological conditions by means of laser confocal scanning microscopy. In the beginning, the biocompatibility effect was measured. As shown in Fig. S8 (Supporting information), the study of the influence of DN-1 on viability of BLE-7402 cells was tested with MTT assay, where the concentration of the probe was in 0-70 µmol/L. BLE-7402 cells maintained a high survival rate more than 75% under high concentration 50 µmol/L of probe DN-1 for 24 h administration. Above results indicated that DN-1 has satisfying biocompatibility in the high concentration range of micromole per liter and would be suitable for cell imaging.
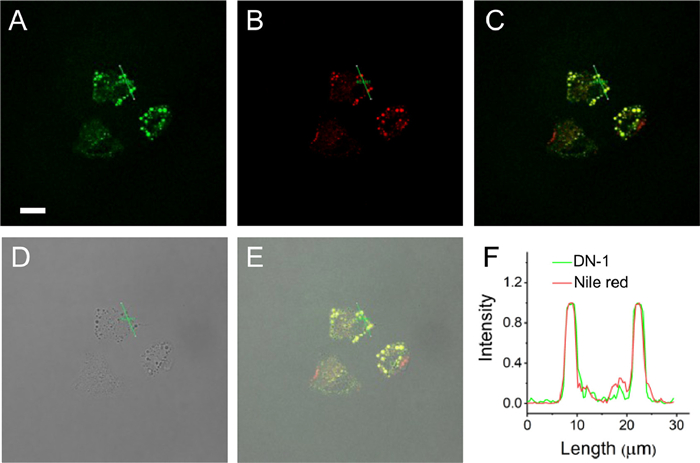
Next, we evaluated the subcellular localization ability of DN-1 probe in various organelles of BLE-7402 cells by staining together with the commercially available lipid droplet tracker Nile Red, which emitted red fluorescence with maximum emission wavelength at 590 nm that had few cross interference with the yellow green fluorescence of DN-1. After co-staining with DN-1 (10 µmol/L) and Nile Red (500 nmol/L), BLE-7402 cells were washed twice and imaged with confocal microscope. As shown in Fig. 2A, the image of cells in green (pseudo color) channel displayed that DN-1 fluorescently stained the cells with obvious color, suggesting DN-1 was able to penetrate cell membrane and sense the intracellular viscosity. The picture of cells in red channel (Fig. 2B) exhibited red-colored particles dispersed in the cytoplasm, and the colored area was well co-localized with the place stained by DN-1 (Fig. 2A), which was demonstrated by merged images (Figs. 2C-E) and co-localization analysis of the corresponding region of interest intensity (ROI) with Image (Fig. 2F). The colocalizaliton was further verified by a Pearson's correlation coefficient of 0.81, overlap coefficient of 0.80 and colocalization rate of 89.79%, calculated in the software LAS X. Hence, DN-1 can targetedly detect lipid droplet viscosity. Besides, the co-localization imaging experiments were also performed with other sub-organelle localization dyes such as lysosome-specialized Lyso-Tracker Red and mitochondrion-specialized Mito-Tracker Red CMXRos. The Lyso-Tracker Red co-incubation results depicted in Fig. S9 (Supporting information) showed that the Pearson's correlation coefficient, colocalization rate and overlap coefficient between Lyso-Tracker Red and the probe DN-1 were 0.63, 0.35 and 0.68 respectively, showing that there is no much overlap between DN-1 and lysosome. Besides, another commercial available subcellular organelle localization dye Mito-Tracker Red CMXRos was also co-stained the BLE-7402 cells with DN-1 (Fig. S10 in Supporting information), and the obtained poor data of Pearson's correlation 0.094, colocalization rate 0.24 and overlap coefficient 0.23 confirmed that DN-1 could specifically locate in the lipid droplet of cells. The probe DN-1 has the structures of styryl and halogen atom Br, which is conducive to the lipid droplet target ablity. Moreover, from the perspective of the structure of the compound DN-1, it is hydrophobic, which makes it possible to specifically target lipid droplet [7].
Anti-fungal drug, an ionophore, nystatin was applied to stimulate the viscosity changes in cells. Nystatin can cause cell pathological dysfunction and viscosity alteration by disrupting the intracellular structure and ion balance [23]. After treating with nystatin of various concentrations (0, 25 and 50 µmol/L repectively) for 1.5 h, BLE-7402 cells were further incubated with DN-1 for 45 minutes, fluorescence imaging was conducted. As seen in the Fig. S11A (Supporting information), fluorescence emission intensity enhanced gradually with the rise of intracellular viscosity induced by different nystatin concentration. Meanwhile, this tendency can also be demonstrated by image quantization intuitively in Fig. S11B (Supporting information), and the mean fluorescence intensities (MFI) significantly enhanced about 2.4 times after nystatin stimulation, suggesting a viscosity increase. Therefore, the results showed the utility of DN-1 for monitoring the viscosity dynamics in lipid droplet.
On account of the inspiring performance of DN-1 in imaging the viscosity of BLE-7402 cells, we made a try to apply DN-1 to monitor the fluorescence discrepancy of intracellular viscosity in two different cell models BLE-7402 and L02 which derived from human liver cancer and human normal hepatocytes respectively. Both kinds of cells were incubated with DN-1 in the same way. There were exceeding differences of fluorescence signal intensities between the two kinds of cells after DN-1 administration. The green fluorescence of BLE-7402 cell is much brighter than that of L02 cells, shown in Fig. 3A. The fluorescence change trend was also validated via flow cytometry analysis and the fluorescence intensity of the entire cells from BLE-7402 was much stronger than that from the L02 (Fig. 3B), which is in consistent with the confocal imaging results. The obvious fluorescence difference probably suggests viscosity dissimilarity between human liver cancer cell and human normal hepatocytes cells. An abnormal viscosity could reflect cellular morbidity. So our probe, through viscosity changes, has the potential to furnish a succinct tactic for distinguishing human liver cancer cells from human normal hepatocytes cells and diagnoses of viscosity-related diseases. As far as we know, it is the first attempt to use fluorescent probe to evidence that the cell viscosity of liver cancer is lower than that of human normal hepatocytes.

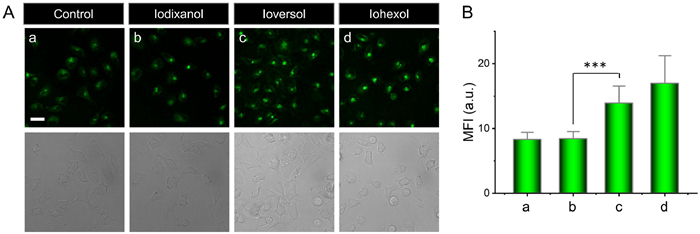
Almost all drugs will cause a certain degree of adverse reactions while exerting their effects. Even under normal usage and dosage, there may be harmful or irrelevant reactions, and even life-threatening in severe cases. According to the regulations of international drug monitoring cooperation center of World Health Organization, adverse drug reaction (ADR) refers to the harmful and irrelevant reaction when normal doses of pharmaceuticals are used to treat, diagnose, prevent diseases or adjust physiological functions [24, 25]. With the increasing application of iodine contrast agents in the diagnosis and treatment of cardiovascular diseases, the adverse reactions and risks caused by iodine contrast agents have attracted much attention. Iodine contrast agent is one of the most commonly used X-ray contrast agents. It is also a basic diagnostic drug for cardiovascular development under X-ray. At present, the iodine contrast agents used for cardiovascular CT and digital subtraction angiography are water-soluble organic iodine contrast agents. Herein, we chose three present non-ionic iodine contrast agents (iodixanol, ioversol and iohexol) commonly used in clinic to study the effect of iodine contrast agents on the cellular viscosity. In the laser confocal dishes, the BLE-7402 cells planted in advance were incubated with the above medical contrast agent for 45 min, treated with DN-1, and then the confocal imaging was conducted. As shown in Fig. 4, these three agents caused different fluorescence changes. Iodixanol (a kind of nonionic isotonic dimer) did not induce significant fluorescence change; while ioversol and iohexol (nonionic monomers of low permeability) brought remarkable fluorescence rise, and the degree by iohexol is the most serious, which suggested that the iodine contrast agents may cause adverse reactions via changing the cellular viscosity. This study would provide guidance and suggestions for clinicians to use iodine contrast agents more effectively and safely.
In summary, a new lipid droplets viscosity fluorescent probe DN-1 is constructed, which has been successfully applied to sense not only intracellular viscosity change, but also detect the viscosity difference between human liver cancer cell and human normal hepatocytes cells. What is more, DN-1 was successfully used to sense the iodine contrast agents induced viscosity alteration. The fluorescence characteristics of DN-1 provide a basis for diagnose of cancer cells and the research on the various iodine contrast agents induced adverse drug reaction.
The authors declare that they have no known competing financial interests or personal relationships that could have appeared to influence the work reported in this paper.
We are grateful for the financial support from the National Natural Science Foundation of China (No. 21705120), the Project of Shandong Province Higher Educational Outstanding Youth Innovation Team (No. 2019KJM008), the Natural Science Foundation of Shandong Province, China (No. ZR2017LB016) and Foundation of Yuandu Scholar.
Supplementary material associated with this article can be found, in the online version, at doi:
N. Lee, S. H. Choi, T. Hyeon, Adv. Mater.25 (2013) 2641. doi: 10.1002/adma.201300081
W. Bottinor, P. Polkampally, I. Jovin, Int. J. Angiol. 22 (2013) 149-154. doi: 10.1055/s-0033-1348885
H. K. Gaikwad, D. Tsvirkun, Y. Ben-Nun, et al., Nano Lett. 18 (2018) 1582-1591. doi: 10.1021/acs.nanolett.7b03813
C. Christiansen, Toxicology 209 (2005) 185-187. doi: 10.1016/j.tox.2004.12.020
K. T. Bae, Radiology 256 (2010) 32-61. doi: 10.1148/radiol.10090908
M. Mehrizi, R. M. Pascuzzi, Muscle Nerve. 50 (2014) 443-444. doi: 10.1002/mus.24254
Y. Zhao, W. Shi, X. Li, et al., Chem. Commun. 58 (2022) 1495-1509. doi: 10.1039/d1cc05717k
B. Dong, W. Song, Y. Lu, et al., ACS Sens. 6 (2021) 22-26. doi: 10.1021/acssensors.0c02015
S. J. Kim, S. Y. Park, S. A. Yoon, et al., Anal. Chem. 93 (2021) 4391-4397. doi: 10.1021/acs.analchem.0c04019
J. Zhou, P. Jangili, S. Son, et al., Adv. Mater. 32 (2020) 2001945. doi: 10.1002/adma.202001945
H. Chu, L. Yang, L. Yu, et al., Coord. Chem. Rev. 449 (2021) 214208. doi: 10.1016/j.ccr.2021.214208
J. Kan, X. Zhou, Y. Sun, et al., Chin. Chem. Lett. 32 (2021) 3066-3070. doi: 10.1016/j.cclet.2021.03.076
S. Li, F. Huo, Y. Yue, et al., Chin. Chem. Lett. 32 (2021) 3870-3875. doi: 10.1016/j.cclet.2021.05.026
S. Wang, B. Zhu, B. Wang, et al., Chin. Chem. Lett. 32 (2021) 1795-1798. doi: 10.1016/j.cclet.2020.12.039
X. Cai, W. Zhu, Q. Meng, et al., Chin. Chem. Lett. 32 (2021) 210-213. doi: 10.1016/j.cclet.2020.11.032
X. Wu, Y. Lu, B. Liu, et al., Chin. Chem. Lett. 32 (2021) 2380-2384. doi: 10.1016/j.cclet.2021.02.065
H. Jiang, G. Yin, Y. Gan, et al., Chin. Chem. Lett. 33 (2022) 1609-1612. doi: 10.1016/j.cclet.2021.09.036
Y. Sun, X. Zhou, L. Sun, et al., Chin. Chem. Lett. 33 (2022) 4229-4232. doi: 10.1016/j.cclet.2022.01.087
F. Kong, X. Wang, J. Bai, et al., Chem. Commun. 57 (2021) 6604-6607. doi: 10.1039/d1cc01819a
B. Lu, J. Yin, C. Liu, et al., Dyes Pig. 187 (2021) 109120. doi: 10.1016/j.dyepig.2020.109120
B. Chen, C. Li, J. Zhang, et al., Chem. Commun. 55 (2019) 7410-7413. doi: 10.1039/c9cc03977e
Q. Xu, M. Ren, K. Liu, et al., Chem. Eng. J. 430 (2022) 132851. doi: 10.1016/j.cej.2021.132851
B. Chen, S. Mao, Y. Sun, et al., Chem. Commun. 57 (2021) 4376-4379. doi: 10.1039/d1cc01104a
E. Seeliger, M. Sendeski, C. S. Rihal, et al., Eur. Heart J. 33 (2012) 2007-2015. doi: 10.1093/eurheartj/ehr494
P. W. Goodwill, E. U. Saritas, L. R. Croft, et al., Adv. Mater. 24 (2012) 3870. doi: 10.1002/adma.201200221

Figure 1 (A) UV-vis absorption spectra of 10 µmol/L DN-1 in water (a) and glycerol (b). (B) Fluorescence spectra of 10 µmol/L DN-1 in water (a) and glycerol (b). The inset shows the corresponding color change of fluorescence under the ultraviolet light of 365 nm. (C) Fluorescence spectra of DN-1 (10 µmol/L) with the variation of solution viscosity (the glycerol fractions of water-glycerol system are 0%, 10%, 20%, 30%, 40%, 50%, 60%, 70%, 80%, 90% and 100% from the bottom to top). (D) Linear relationship between logI544 and logη. λex/em = 458/544 nm.

Figure 2 Colocalization fluorescence imaging of DN-1 and lipid droplet tracker Nile Red in BLE-7402 cells. Cells were co-stained with DN-1 (10 µmol/L) and Nile Red (500 nmol/L) at 37 ℃ for 30 min. (A) Fluorescence image from DN-1 channel (λex = 442 nm, λem = 499-560 nm). (B) Fluorescence image from Nile Red (λex = 561 nm, λem = 591–671 nm). (C) Merged image of green and red channels. (D) Bright field image. Scale bar: 20 µm. (E) Merged image of images of (C) and (D). (F) Intensity profile of the linear ROI 1 from the two channels across the cell.

Figure 3 (A) Confocal microscopy fluorescence imaging of cells treated with DN-1. BLE-7402 (1) and L02 (2) cells incubated with 10 µmol/L DN-1 for 45 min. Scale bar: 20 µm. (B) Corresponding flow cytometry assay of BLE-7402 cells and L02 cells treated as in (A).

Figure 4 The study of the effect of non-ionic iocontrast agents on intracellular viscosity. (A) Confocal microscopy images of BLE-7402 cells: (a) BLE-7402 cells only. (b-d) BLE-7402 cells treated with 1 mL iodixanol (100 mL: 32 g I), ioversol (100 mL: 32 g I) and iohexol (100 mL: 35 g I) respectively for 45 min, and then incubated with DN-1 (10 µmol/L) for 30 min. Scale bar: 20 µm. (B) Corresponding normalized fluorescence intensity of BLE-7402 cells from the MFI results. λex = 442 nm, λem = 450-700 nm. Error bars represent SD (standard deviation, n = 5). The significance was determined by using the T test (***P < 0.001).

 扫一扫看文章

扫一扫关注我们
 DownLoad:

 下载:
下载: