Figure 1.
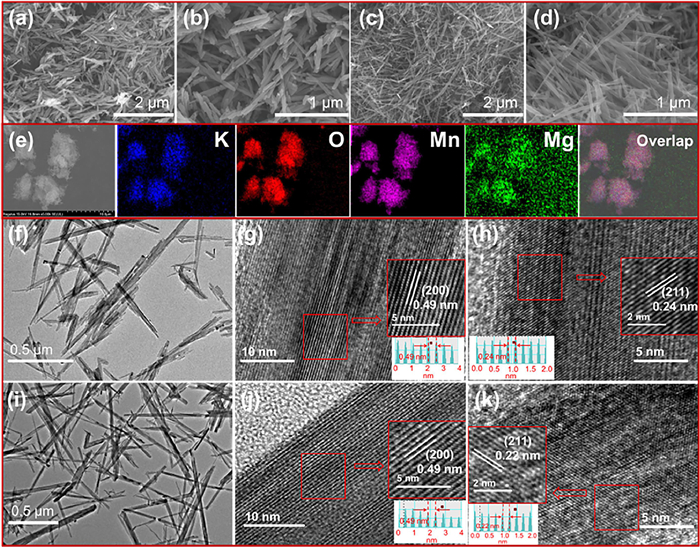
SEM images of synthesized OMS-2 (a, b) and Mg0.2/OMS-2 (c, d). Elemental mappings of Mg0.2/OMS-2 (e). TEM images of synthesized OMS-2 (f-h) and Mg0.2/OMS-2 (i-k).
Magnesium doping to improve the light to heat conversion of OMS-2 for formaldehyde oxidation under visible light irradiation
Tingting Liu , Pengfei Sun , Wei Zhao , Yingshuang Li , Lujun Cheng , Jiahai Fan , Xiaohui Bi , Xiaoping Dong

The rapidly developing industrial production has brought great economic benefits to human society, but accompanied by many pollution problems, one of which is volatile organic compounds (VOCs) pollution. According to the definition of the World Health Organization (WHO), VOCs collectively refers organic compounds with a boiling point of 50-260 ℃ under atmospheric pressure [1]. And the composition of VOCs pollutants is generally complex, toxic, irritating and carcinogenic, which not only harms human health, but also interacts with other pollutants in the environment to produce ozone, secondary aerosol, PM2.5 and other air pollutants, leading to secondary pollution and a series of environmental problems [2,3]. According to the International Agency for Research on Cancer (IARC), formaldehyde (HCHO) is a kind of Class Ⅰ carcinogenic substance with explicit epidemiological evidence of human nasopharyngeal cancer [4]. HCHO is a type of indoor air VOCs pollution, and the common industrial VOCs removal techniques are not suitable for HCHO treatment in closed space. The development of more advanced indoor HCHO removal technology is particularly important.
At present, VOCs are mainly treated by adsorption, condensation and membrane separation as a kind of recovery technology, and by combustion, catalytic oxidation, biodegradation as a kind of destruction technology [5–8]. Catalytic oxidation is considered to be one of the most stable, safest and most effective methods to remove VOCs because of its low energy consumption and thorough removal. Noble metal catalysts such as Au, Ag, Pt, generally have high catalytic activity that can completely transform VOCs at relatively low temperature [9], however, the price is too high. In order to reduce the catalyst cost and ensure its high catalytic activity, usually a small amount of precious metals are loaded on molecular sieve, non-metallic oxide or metal oxide carrier [10]. In addition, it is also wise to choose non-precious metal oxides as catalysts. In recent years, more amounts of studies have been conducted on the catalytic oxidation of VOCs by non-precious metal oxides, such as Mn, Cu and Ce [11]. Among them, Mn-based catalytic materials have been widely studied because of their easy preparation and good catalytic activity. Yang et al. prepared α, β, γ, δ MnO2 by hydrothermal method, and investigated the effects of different crystalline catalysts on the catalytic oxidation process of toluene [12]. It was found that the pore structure and the active lattice oxygen had important effects on the catalytic performance. Wang et al. prepared rod-shaped, flower-shaped, tubular α-MnO2 and nano-flower-spherical Mn2O3 by hydrothermal method [13]. The study showed that rod-shaped α-MnO2 demonstrated the optimal oxidation performance of toluene at low temperature. In addition, other researchers have conducted relevant researches on Mn-based catalytic materials with different coordination numbers and crystal faces. However, due to the limited catalytic activity of single Mn-based catalytic material, the development of Mn-modified catalysts for better catalytic performance has attracted more attention in recent years. In generally, there are three common: (1) Precious metal loads such as Pt/MnO2 [9]; (2) Mn binding to the carrier like Mn/zeolite [14]; (3) Metal doping, such as Ce-MnO2 [15], Co-MnO2 [16].
Photocatalysis and catalytic combustion are two important types of catalytic oxidation technology that can be further combined, which is not only expected to reduce the temperature and energy consumption of single catalytic combustion, but also can further enhance the catalytic performance of either single catalytic process [17]. With the rise of the research field of photothermal catalysis, higher requirements have also been put forward for the selection of catalysts, which need the catalyst to have strong full spectrum response and thermal catalytic activity, or to have the property of converting photon energy into active oxygen species or heat energy [18,19]. For example, the Ce ion-doped OMS-2 ultrafine nanorods catalyst shows strong absorption in the full range of sunlight spectrum, and can effectively convert the absorbed light energy into heat energy, which can replace the external heat energy supply mode. At the same time, OMS-2 nanorods replaced by Ce ion have excellent low temperature thermal catalytic oxidation performance [20]. Yu et al. also prepared the manganese oxide nanoparticles modified by Pt ion as the effective catalyst for degradation of toluene [21]. The synergic effect between high redox activity of Pt ion and light to heat property of manganese oxide promoted the activity and durability of synergistic thermocatalysis/photocatalysis removal of toluene. Wang et al. prepared GO/MnOx/CN composite film catalyst in the degradation of HCHO under irradiation [22]. It was found that GO provided the surface temperature required for thermal catalysis and promoted the charge transfer of photocatalysis, thus showing better photothermal coordination performance.
In this work, rod-like crypmanganite octahedral molecular sieve (OMS-2, KMn8O16) with different Mg doping amounts was prepared by hydrothermal method. Studies have shown that doping high-valence ions in the structure can induce the formation of vacancy defects [23]. Wang et al. studied alkali metal doping δ-MnO2, showing that alkali metal doping could significantly change the formation energy of oxygen vacancy [24], thus providing more active sites for O2 during the reaction [25]. Mohan Kumar et al. studied the photocatalytic degradation of organic dyes by preparing Mg-doped SnS2 [26]. The results suggested that Mg doping enhanced visible light absorption and promoted effective charge transfer process, which increased the production of more amounts of free radicals. As one of the materials of α-MnO2, OMS-2 is composed of (2 × 2) tunnel structure through [MnO6] octahedron, and there are many equilibrium K+ in the tunnel, which provides favorable conditions for alkali metal doping substitution. Besides, the doped Mg has been reported to be able to not only enhance the absorption of full spectrum light for achieving a better photo-energy to thermo-energy conversion, but also increase the surface oxygen vacancy by substitution of Mg2+ from K+ to improve surface oxidation performance [27]. The experimental result in this work exhibits that the Mg doped OMS-2 catalyst obtained excellent HCHO removal performance under the condition of xenon lamp light source.
The crystal structures of OMS-2 and Mg-doped samples were studied by X-ray diffractometer (XRD), as shown in Fig. S1 (Supporting information). The OMS-2 was synthesized by hydrothermal method. The crystal structure of the OMS-2 catalyst sample was pure tetragonal cryptomanganese structure (KMn8O16, JCPDS No. 29-1020) with 2θ at 12.7°, 18.0°, 25.6°, 28.7°, 36.6°, 37.6°, 42.0°, 49.9°, 56.1°, 60.2° and 69.6° [28,29]. After Mg2+ doping, the peak location of the sample was basically the same as that of OMS-2 with only a slight shift in position because the radius of Mg2+ is smaller than that of K+, which resulted in the substitution of K+ in structure and the shift of 2θ value towards a larger angle [30].
The scanning electron microscope (SEM) images exhibited in Figs. 1a-d display that the parent OMS-2 and Mg-doped OMS-2 were rod-like structures. By comparing the morphology of the OMS-2 before and after Mg doping, it can be seen that the diameter of the samples was reduced while the length was increased after doping, which is reported to be conducive to the utilization of light energy in the photocatalytic process [31]. The energy dispersive spectrometer mapping (EDS-mapping) of Mg0.2/OMS-2 sample is also exhibited in Fig. 1e, which reveals that Mg had been successfully doped into OMS-2 structure. The high resolution transmission electron microscope (HRTEM) exhibited in Figs. 1f-h clearly shows that the spacing of lattice fringes was 0.49 nm and 0.24 nm, which was ascribed to (200) and (211) crystal planes of OMS-2 [29,32]. After Mg2+ doping (Figs. 1i-k), the crystal plane spacing of (211) crystal planes decreased from 0.24 nm to 0.22 nm, which proves again that Mg2+ had entered into the tunnel and replaced K+ of OMS-2.
Besides, N2 adsorption were also tested. The desorption isotherms and pore size distribution curves of the samples are shown in Fig. S2 (Supporting information) and Table 1. All samples were type IV N2 adsorption desorption isotherms with H1 type hysteresis loops, which confirmed that the catalyst was a homogeneous mesoporous material composed of cylindrical structures with narrow pore size distribution. As exhibited in inset of Fig. S2, the pore size was mainly distributed below 15 nm. It could be also found that the SBET of OMS-2 increased after Mg-doped, which was due to the substitution of Mg to K in the tunnel positions that slowed down the growth of OMS-2 fibers, leading to a small size of OMS-2 fibers with increased specific surface area [33].
 DownLoad:
CSV
DownLoad:
CSV

|
In order to further investigate chemical composition and surface environment, X-ray photoelectron spectroscopy (XPS) was tested. As shown in Fig. 2a, the peaks at binding energy of 645 eV, 532 eV and 84 eV were attributed to Mn 2p, O 1s and Mn 3s of parent OMS-2 and Mg doped OMS-2 samples. As shown in Fig. 2b, the Mn valence states in these samples were determined from the fitted high-resolution Mn 2p spectra. The two main peaks with binding energy of ca. 653.9 and ca. 642.1 eV were evidently observed, respectively assigned to Mn 2p1/2 and Mn 2p3/2 [34–36]. And the peaks at ca. 643.2 eV and 642.0 eV were assigned to Mn4+ and Mn3+ [36–38]. According to the peak-splitting results, the Mn3+/Mn4+ molar ratio of OMS-2 was 1.707 (Table 1), lower than that of Mg doped samples. The higher ratio of Mn3+/Mn4+ facilitated the formation of surface oxygen species [39]. Besides, the average oxidation state (AOS) of manganese was also calculated by analyzing Mn 3s multiple cleavage amplitudes (ΔEs) [40]. As shown in Fig. 2c, the ΔEs of pure OMS-2 sample was 4.78 eV, but was 4.67, 4.54 and 4.53 eV with the increase of doping amount, respectively. The AOS of manganese in samples was calculated according to AOS = 8.95 − 1.13ΔEs (eV), as listed in Table 1 [38,40]. From the lowest AOS value of Mg0.2/OMS-2, we can judge that catalyst Mg0.2/OMS-2 had the highest oxygen vacancy concentration [41]. This increased amount of oxygen vacancy concentration over Mg-doped samples were caused by the lattice distortion via doping with different ionic radii, which thus changed the length of metal-O bond and generate new lattice defects and oxygen vacancies [33,42].
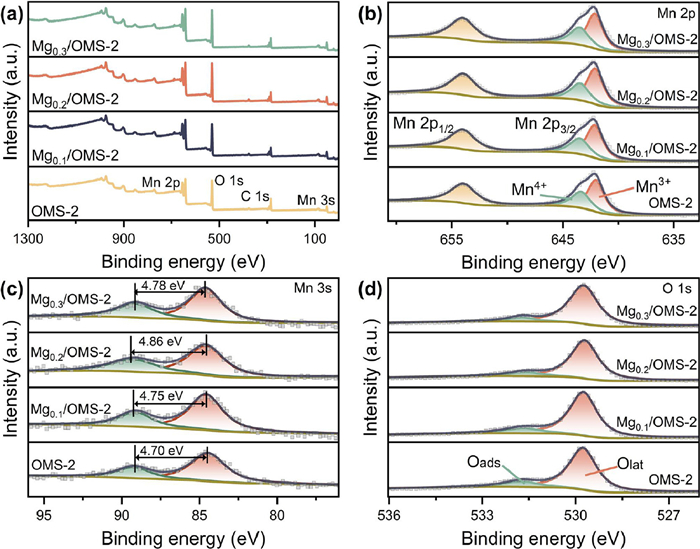
Fig. 2d also exhibits the peak-splitting result of O 1s. The peaks at ca. 529.8 and 531.7 eV were assigned to lattice oxygen (Olat) and adsorbed oxygen (Oads) such as oxygen-containing group like hydroxyl (OH-) or adsorbed water species [43,44]. Compared with pure OMS-2, the Olat/Oads molar ratio of Mg-doped OMS-2 was significantly increased. Usually, adsorbed oxygen is more like to be stimulated at a relatively lower temperature in a MvK mechanism for oxidation of C—H [45]. For MnOx, the reduction temperature of surface lattice oxygen can be ascribed to temperature less than 250 ℃ and bulk lattice oxygen can be ascribed to less than 400 ℃ [46,47]. In this work, the temperature of catalyst surface can reach a maximum of 214.8 ℃ under light irradiation, which has satisfied the reduction temperature of surface lattice oxygen. Thus, it can be speculated that the critical role of Oads and surface Olat play together in oxidation of HCHO.
It should also be noted that Mg was barely detectable in XPS spectra, though the inductively coupled plasma (ICP) test result (Table 1) has proved that the practical mass ratio of Mg in doped samples was 0.58%, 1.15% and 1.52% respectively, which is consistent with theoretical value (0.59%, 1.16% and 1.85%). This should be caused by the microscale of Mg mainly existing in the crystal lattice of OMS-2, which is difficult to be identified by surface scanning technique like XPS [27].
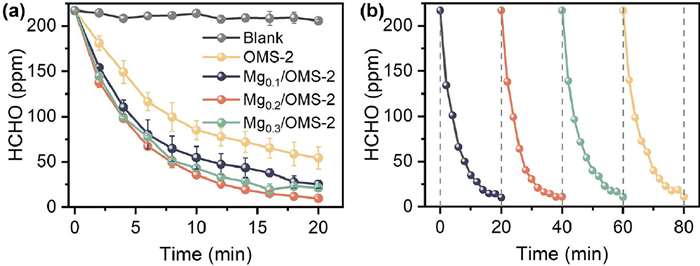
Photothermocatalytic activity of these Mg-doped catalysts was evaluated by eliminating HCHO both in a batch reactor and a fixed bed. As shown in Fig. 3a, the fixed concentration of 250 ppm HCHO was degraded in a 500 mL quartz glass reactor with a 300 W xenon lamp. Detailed experimental methods are listed in Supporting information. The results confirmed that doping of Mg could improve the HCHO removal performance compared with parent OMS-2. And the best HCHO elimination efficiency was achieved over Mg0.2/OMS-2 catalyst, which reduced HCHO from 250 ppm to 10 ppm within 20 min. Although there are numbers of reports about HCHO oxidation at room temperature (Table S1 in Supporting information), the Mg0.2/OMS-2 catalyst in this work reveals better performance. In Fig. 3b, the Mg0.2/OMS-2 catalyst was also tested for four times without any treatment, and the degradation performance remained unchanged, proving satisfied recycling performance (Fig. 3b). In addition, the pseudo-first-order and pseudo-second-order kinetic model fitting were also calculated for understanding the kinetics of the catalytic process. The results are exhibited in Fig. S4 and Table S1 (Supporting information).
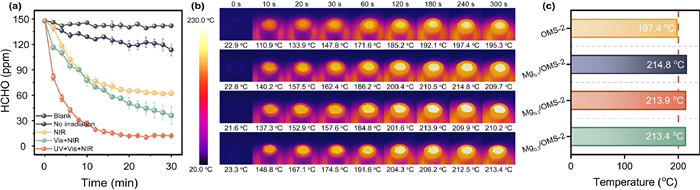
In order to explore the effect of different light sources on the catalytic performance of Mg0.2/OMS-2, the degradation of HCHO by different light sources was also measured in the substrate with a concentration of 150 ppm. It was found that the concentration of HCHO also decreased slightly without illumination, which was mainly due to the adsorption of the catalyst surface. As can be seen from Fig. 4a, the ranking of catalytic performance under different light source was UV–vis-NIR > Vis-NIR > NIR > No irradiation > Blank. The Vis and NIR bands played a great role in the catalysis due to the obvious photothermal conversion by absorption of Vis and NIR over MnOx catalyst [48]. Fig. 4b also reveals that the surface temperature of parent OMS-2 and Mg doped OMS-2 rose quickly under light irradiation. The rate at which the surface temperature of these samples increased over a period of 300 s was clearly observed in thermal imaging photographs. And the doping of Mg promoted the photothermal conversion property as the temperature of Mg modified sample reached 214.8 ℃ compared with that of parent OMS-2 at the temperature of 197.4 ℃ (Fig. 4c). From the diffuse reflectance spectrum (DRS) curves shown in Fig. S3 (Supporting information), it can be found that the Mg0.2/OMS-2 exhibited enhanced absorption of full spectrum light compared with parent OMS-2, because of the improved the surface photothermal property of catalysts. With such photothermal property, a MvK oxidation mechanism driven by temperature took effect, which more effectively oxidized C—H bond in the oxygen activation process [49]. On the other hand, Fig. 4a also indicates that the surface oxidation property stimulated by UV light played a certain photocatalytic role in HCHO elimination except for the photothermal effect dominated by Vis and NIR light source. It has been reported that Mn ions in the [MnO6] octahedron will undergo d-d transition after absorbing UV light, resulting in weak Mn-O bond and active lattice oxygen, which can effectively oxidize HCHO [50].
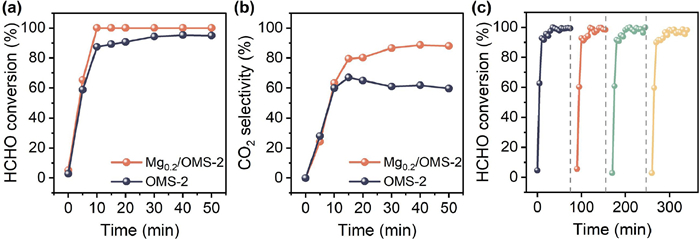
The degradation performance of HCHO over OMS-2 and Mg0.2/OMS-2 catalysts in a fixed-bed catalytic system under xenon illumination was also tested. Detailed experimental methods are listed in Supporting information. As shown in Fig. 5a, the removal efficiency of HCHO was finally stabilized at 84.2% and 95.1% over OMS-2 and Mg0.2/OMS-2 catalysts within 50 min. However, the CO2 selectivity of both catalysts did not exhibit corresponding efficiency (Fig. 5b). This deficiency of carbon balance should be caused by the metabolites produced in the oxidation process of HCHO deposited on the catalyst surface or loss with air. In the recycle test over fixed-bed catalytic system (Fig. 5c), Mg0.2/OMS-2 catalyst still revealed a HCHO elimination rate > 95% after four consecutive use without any treatment, displaying excellent stability.
In order to further explore the mechanism of the photothermal catalytic reaction over Mg doped OMS-2, we also did the following experiment. As can be seen from Fig. 6a, all Mg doped OMS-2 catalysts exhibited strong electron paramagnetic resonance (EPR) signal, whose position was g = 2.003, confirming that the defects in the catalyst were from oxygen vacancies [51]. The order of EPR signal intensity was Mg0.2/OMS-2 > Mg0.3/OMS-2 > Mg0.1/OMS-2 > OMS-2, which is also consistent with the HCHO elimination as shown in Fig. 3a, proving that surface oxygen vacancy played an important role in the removal of HCHO. In addition, the EPR of Mg0.2/OMS-2 under the condition of light and without light irradiation was also determined to investigate surface oxidizing species during HCHO degradation. As shown in Figs. 6b and c, the surface of Mg0.2/OMS-2 was observed to produce both •OH and •O2− after 30 min irradiation by xenon lamp. This result implied that light irradiation stimulated the reaction of adsorbing oxygen on the surface vacancy, promoting the formation of more favorable oxidation groups such as •OH and •O2− [52]. Besides, the transient photocurrent responses of OMS-2 and Mg0.2/OMS-2 were also measured to verify the separation of photogenerated carriers. The result is exhibited in Fig. S5 (Supporting information), which proves that Mg doped obviously enhanced the signal of photocurrent intensity that was helpful to form more amounts of surface oxidizing specie [53,54].

The generated amount of •OH and •O2− with light irradiation time was also tested for exploring the effect of these oxidizing group on the HCHO reaction process. Detailed test methods are listed in Supporting information. The formation of •OH was confirmed by fluorescence spectroscopy using p-phthalic acid (TA) as a probe reacting with •OH. And the stable 2-hydroxyterephthalic acid (TAOH) was obtained, which was also detected at a wavelength of 415 nm with spectrophotometry (Fig. 6d) [55]. •O2− was also measured by using nitroblue tetrazolium (NBT) as a scavenger, which reflected at a wavelength of 260 nm with spectrophotometry (Fig. 6e) [56]. As shown in Fig. 6d, Mg0.2/OMS-2 did not generate •OH in the absence of illumination, while the concentration of •OH increases with the increase of illumination time under xenon lamp illumination. In Fig. 6e, the downtrend of NBT concentration also indicated the amount of •O2− increased with illumination time. These generated •OH and •O2− produced via light irradiation had been reported to be able to effectively degrade HCHO [57], which should be also responsible for HCHO removal on the surface of Mg0.2/OMS-2 catalyst.
Finally, in situ diffuse reflectance infrared fourier transform spectroscopy (In-situ DRIFTS) was also performed to investigate the degradation process of HCHO molecule on surface of Mg0.2/OMS-2. As shown in Fig. 6f, a series of absorption peaks appeared at 2363 cm−1, 2335 cm−1, 1749 cm−1, 1587 cm−1, 1504 cm−1 and 1366 cm−1. Among them, those at 1587 cm−1 and 1366 cm−1 were ascribed to the characteristic peaks of formate species, and those at 1749 cm−1 and 1504 cm−1 to carbonate species [58,54]. Though, it was found that the peaks of formate species and carbonate species did not increase over time, the peaks at 2363 cm−1 and 2335 cm−1 were attributed to rapidly increased CO2 [59], indicating that HCHO was firstly converted to formate species and carbonate species, further degrading to CO2 and H2O.
In summary, Mg doped OMS-2 with different doping amounts was prepared by hydrothermal method. Though Mg2+ replaced K+ in the tunnel structure of OMS-2, the rod-like structure of pure OMS-2 was preserved. Under xenon lamp illumination, the surface temperature of Mg0.2/OMS-2 catalyst reached ca. 200 ℃ within 5 min and stimulated an oxidation process conducted by oxygen vacancies and activated free radical, which thus achieved an elimination rate of HCHO > 92%. The NIR light played an important role in increasing the surface temperature of Mg0.2/OMS-2 catalyst, which thus simulated the MvK oxidation mechanism. Besides, the oxidation mechanism of surface free radicals was also excited by UV part of light source. This work demonstrates the possibility of utilizing solar energy to acquire a significant HCHO removal path, especially for indoor HCHO air pollution. And the very stable performance of such material also provides the possibility for the further research and application of the photothermal catalytic technology.
The authors declare that they have no known competing financial interests or personal relationships that could have appeared to influence the work reported in this paper.
This work was financially supported from the Natural Science Foundation of China (No. 51908491), the Ministry of Science and Technology Project of China (No. 2017YFE0127400), and the Zhejiang Provincial Natural Science Foundation of China (No. LY20B070001).
Supplementary material associated with this article can be found, in the online version, at doi:
C. George, M. Ammann, B. D’Anna, et al., Chem. Rev. 115 (2015) 4218–4258. doi: 10.1021/cr500648z
Z. Wang, G. Xiu, T. Qiao, et al., Bioresour. Technol. 130 (2013) 52–58. doi: 10.1016/j.biortech.2012.11.106
Z. Zhao, S. Ma, B. Gao, et al., Sep. Purif. Technol. 314 (2023) 123510. doi: 10.1016/j.seppur.2023.123510
V.J. Cogliano, Y. Grosse, R.A. Baan, et al., Monographs Cadmium, International Agency for Research on Cancer (IARC), Lyon, 1993.
T. Moufawad, M. Costa Gomes, S. Fourmentin, Chem. Eng. J. 448 (2022) 137619. doi: 10.1016/j.cej.2022.137619
J. Kujawa, W. Kujawski, A. Cyganiuk, et al., Chem. Eng. J. 374 (2019) 155–169. doi: 10.1016/j.cej.2019.05.160
B. Jiang, K. Xu, J. Li, et al., J. Hazard. Mater. 405 (2021) 124203. doi: 10.1016/j.jhazmat.2020.124203
S. Lu, L. Shen, X. Li, et al., J. Clean. Prod. 378 (2022) 134589. doi: 10.1016/j.jclepro.2022.134589
H. Zhang, S. Sui, X. Zheng, et al., Appl. Catal. B 257 (2019) 117878. doi: 10.1016/j.apcatb.2019.117878
F. Bi, Z. Zhao, Y. Yang, et al., Environ. Sci. Technol. 56 (2022) 17321–17330. doi: 10.1021/acs.est.2c06886
L.F. Liotta, Appl. Catal. B 100 (2010) 403–412. doi: 10.1016/j.apcatb.2010.08.023
W. Yang, Z. Su, Z. Xu, et al., Appl. Catal. B 260 (2020) 118150. doi: 10.1016/j.apcatb.2019.118150
F. Wang, H. Dai, J. Deng, et al., Environ. Sci. Technol. 46 (2012) 4034–4041. doi: 10.1021/es204038j
H. Tedla, I. Díaz, T. Kebede, et al., J. Environ. Chem. Eng. 3 (2015) 1586–1591. doi: 10.1016/j.jece.2015.05.012
X. Fang, Y. Liu, Y. Cheng, et al., ACS Catal. 11 (2021) 4125–4135. doi: 10.1021/acscatal.0c05697
Y.L. Li, X.J. Wang, Y.J. Hao, et al., Chin. J. Catal. 42 (2021) 1040–1050. doi: 10.1016/S1872-2067(20)63706-8
F. Bi, Y. Su, Y. Zhang, et al., Appl. Catal. B 306 (2022) 121109. doi: 10.1016/j.apcatb.2022.121109
S. Fang, Y.H. Hu, Chem. Soc. Rev. 51 (2022) 3609–3647. doi: 10.1039/D1CS00782C
R. Ma, J. Sun, D.H. Li, et al., Int. J. Hydrog. Energy 45 (2020) 30288–30324. doi: 10.1016/j.ijhydene.2020.08.127
J. Hou, Y. Li, M. Mao, et al., Nanoscale 7 (2015) 2633–2640. doi: 10.1039/C4NR06410K
E. Yu, J. Li, J. Chen, et al., J. Hazard. Mater. 388 (2020) 121800. doi: 10.1016/j.jhazmat.2019.121800
J. Hou, Y. Li, M. Mao, et al., Nanoscale 6 (2014) 15048–15058. doi: 10.1039/C4NR04142A
Y.G. Zou, H. Mao, X.H. Meng, et al., Angew. Chem. Int. Ed. 60 (2021) 26535–26539. doi: 10.1002/anie.202111954
Y. Wang, K. Liu, J. Wu, et al., ACS Catal. 10 (2020) 10021–10031. doi: 10.1021/acscatal.0c02310
Y. Yang, S. Zhao, F. Bi, et al., Cell Rep. Phys. Sci. 3 (2022) 101011. doi: 10.1016/j.xcrp.2022.101011
G. Mohan Kumar, H.D. Cho, P. Ilanchezhiyan, et al., J. Colloid Interface Sci. 540 (2019) 476–485. doi: 10.1016/j.jcis.2019.01.039
S. Fang, Y. Li, Y. Yang, et al., Environ. Sci. 4 (2017) 1798–1807.
S. Shen, X. Zhou, Q. Zhao, et al., J. Hazard. Mater. 439 (2022) 129613. doi: 10.1016/j.jhazmat.2022.129613
H. Deng, Y. Lu, T. Pan, et al., Appl. Catal. B 320 (2023) 121955. doi: 10.1016/j.apcatb.2022.121955
Q. Zhang, S. Yue, H. Sun, et al., J. Mater. Chem. C 5 (2017) 3838–3847. doi: 10.1039/C7TC00582B
Z. Bo, S. Yang, J. Kong, et al., ACS Catal. 10 (2020) 4420–4432. doi: 10.1021/acscatal.9b04844
P. Wang, J. Wang, J. Zhao, et al., J. Colloid Interface Sci. 608 (2022) 1662–1675. doi: 10.1016/j.jcis.2021.10.077
W. Huang, J. Shi, Appl. Catal. Gen. 507 (2015) 65–74. doi: 10.1016/j.apcata.2015.09.015
H. Zhang, K. Ye, K. Zhu, et al., ACS Sustain. Chem. Eng. 5 (2017) 6727–6735. doi: 10.1021/acssuschemeng.7b00982
J. Fang, J. Li, L. Gao, et al., J. Colloid Interface Sci. 494 (2017) 185–193. doi: 10.1016/j.jcis.2017.01.049
Z.G. Zhou, H.M. Du, Z. Dai, et al., Chem. Eng. J. 374 (2019) 170–180. doi: 10.1016/j.cej.2019.05.170
S. Yang, H. Yang, J. Yang, et al., Chem. Eng. J. 402 (2020) 126154. doi: 10.1016/j.cej.2020.126154
V.P. Santos, O.S.G.P. Soares, J.J.W. Bakker, et al., J. Catal. 293 (2012) 165–174. doi: 10.1016/j.jcat.2012.06.020
J. Wang, J. Li, C. Jiang, et al., Appl. Catal. B 204 (2017) 147–155. doi: 10.1016/j.apcatb.2016.11.036
J. Hou, Y. Li, M. Mao, et al., ACS Appl. Mater. Interfaces 6 (2014) 14981–14987. doi: 10.1021/am5027743
M. Mao, Y. Li, J. Hou, et al., Appl. Catal. B 174–175 (2015) 496–503.
Q. Ren, X. Zhao, J. Zhong, et al., J. Catal. 418 (2023) 130–140. doi: 10.1016/j.jcat.2023.01.002
X. Zhou, Q. Zhao, Y. Tian, et al., Chem. Eng. J. 436 (2022) 131256. doi: 10.1016/j.cej.2021.131256
L. Cheng, J. Wang, C. Zhang, et al., New J. Chem. 43 (2019) 19126–19136. doi: 10.1039/C9NJ04192C
H. Sun, Z. Liu, S. Chen, et al., Chem. Eng. J. 270 (2015) 58–65. doi: 10.1016/j.cej.2015.02.017
B. Chen, B. Wu, L. Yu, et al., ACS Catal. 10 (2020) 6176–6187. doi: 10.1021/acscatal.0c00459
F. Liu, M. Zeng, Y. Li, et al., Adv. Funct. Mater. 26 (2016) 4518–4526. doi: 10.1002/adfm.201601046
D. Jiang, W. Wang, S. Sun, et al., ACS Catal. 5 (2015) 613–621. doi: 10.1021/cs501633q
Y. Zhang, Y. Huang, S.C. Lee, et al., Chem. Eng. J. 380 (2020) 122498. doi: 10.1016/j.cej.2019.122498
J. Chen, Y. Li, S. Fang, et al., Chem. Eng. J. 332 (2018) 205–215. doi: 10.1016/j.cej.2017.08.130
B. Zhang, J. Shan, W. Wang, et al., Small 18 (2022) 2106012. doi: 10.1002/smll.202106012
V. Nair, M.J. Munoz-Batista, M. Fernandez-Garcia, et al., ChemSusChem 12 (2019) 2098–2116. doi: 10.1002/cssc.201900175
X. Xu, J. Wang, T. Chen, et al., Appl. Catal. B 296 (2021) 120352. doi: 10.1016/j.apcatb.2021.120352
R. Fang, H. Huang, J. Ji, et al., Chem. Eng. J. 334 (2018) 2050–2057. doi: 10.1016/j.cej.2017.11.176
Z. Hu, Y. Zhao, J. Liu, et al., J. Colloid Interface Sci. 483 (2016) 26–33. doi: 10.1016/j.jcis.2016.08.010
P. Sun, Y. Liu, F. Mo, et al., J. Clean. Prod. 393 (2023) 136320. doi: 10.1016/j.jclepro.2023.136320
L. Miao, J. Wang, P. Appl. Surf. Sci. 466 (2019) 441–453. doi: 10.1016/j.apsusc.2018.10.031
X. Du, C. Li, J. Zhang, et al., J. Hazard. Mater. 408 (2021) 124830. doi: 10.1016/j.jhazmat.2020.124830
J. Chen, M. Jiang, J. Chen, et al., J. Hazard. Mater. 392 (2020) 122511. doi: 10.1016/j.jhazmat.2020.122511

Figure 1 SEM images of synthesized OMS-2 (a, b) and Mg0.2/OMS-2 (c, d). Elemental mappings of Mg0.2/OMS-2 (e). TEM images of synthesized OMS-2 (f-h) and Mg0.2/OMS-2 (i-k).

Figure 3 (a) Photothermal degradation curves of HCHO by different Mg doped OMS-2 in a batch reactor. (b) Cyclic stability test of Mg0.2/OMS-2 in a batch reactor.

Figure 4 (a) Photothermal degradation curves of HCHO by Mg0.2/OMS-2 under different light sources; (b) Infrared thermal image and (c) maximum temperature of different Mg doped OMS-2 under full spectrum light source.

Figure 5 (a) The conversion of HCHO photothermal degradation over Mg0.2/OMS-2 and OMS-2. (b) CO2 selectivity of HCHO photothermal degradation over Mg0.2/OMS-2 and OMS-2. (c) Four cycling use of Mg0.2/OMS-2 for HCHO photothermal degradation.

Figure 6 (a) ESR spectra of OV, (b) DMPO-•OH and (c) DMPO-•O2− generation over Mg0.2/OMS-2 under light and dark conditions; The (d) FL spectra of TA solution and (e) absorption spectra of NBT solution over reaction time for Mg0.2/OMS-2; (f) In-situ DRIFTS spectra of HCHO removal under xenon light irradiation over the Mg0.2/OMS-2 catalyst.

 扫一扫看文章

扫一扫关注我们
 下载:
下载:

 下载:
下载: