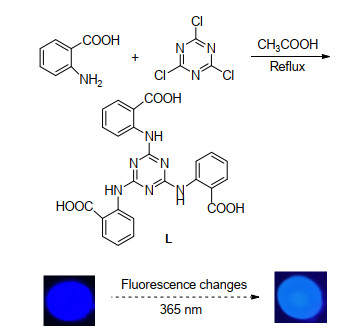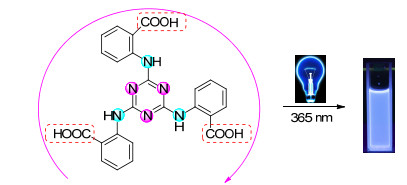
Figure 1.
Structure and fluorescent of L
Triazine Derivative for Fluorescence Sensing of Zr4+, Fe3+ Ions and Acetone
Xuelin Ma , Limin Han , Xiaoyong Zhang , Yuheng Zhang , Li Wang , Kun Yang , Jie Ji

The sensing and detection of hazardous substances plays an important role in life and environmental sciences. The past decade has witnessed a fast growth for detection of Fe3+ ion because massive utilization of Fe3+ ion causes environmental pollution and health problems.[1~7] It is well known that the Fe3+ ion plays an important role in biological metabolism and are recognized as an industrial pollutant. However, these widely used instrumental analytical techniques have some limitations, including expensive equipment, complication in sample preparation and well-trained person. To defeat this problem, the large number of well-designed sensors based on this Fe3+ ion have been developed by fluorescent[8~18] and colorimetric[19] sensing methods, of which sensitive and selective detections of Fe3+ ion by fluorescent methods are most competitive and have attracted great attention in recent years. Although metal-organic frameworks (MOFs) as fluorescent probe have been widely investigated for their potential application in the sensitive and selective detection of Fe3+ ion, many MOFs are limited in wide application due to complicate operations, slow signal response, poor stability, [20] expensive raw materials, [21~24] toxic (including heavy metal)[25, 26] and not suitable for aqueous and biological environment. In addition, though Zr4+ is not classified as one of the essential elements for human and cannot also produce toxic effects for environment, it is a rare metal and very important atomic energy elements which is widely used in military industry, smelting, atomic energy industry and battery.[27, 28] However, up to now, there is only a small amount of detection of Zr4+ ion, [29] mostly the recognition of Fe3+ ion by Zr(Ⅳ)-MOFs.[30, 31] Besides, MOFs are also used as fluorescent probes to detect small molecular compounds, such as H2S, [32] biomolecules, [33] acetone[34, 35] and nitroaromatic compounds.[36~38] Therefore, there is an urgent need to develop a new chemosensor for the rapid selective and sensitive detection of Zr4+, Fe3+ ion and acetone as the replacement.
In this work, it reports an organic fluorescent probe L (no heavy metal ions and low toxicity) which is rationally designed on the basis of 2, 4, 6-trichloro-1, 3, 5-triazine and contains nine coordination centers (Figure 1). It exhibits strong fluorescence and highly sensitive and selective toward Zr4+, Fe3+ ions and acetone in room temperature. With the addition of Fe3+ ion, compound L could give rise to a visible colorless-to-yellow change and clear fluorescence quenching. In contrast to this, with the addition of Zr4+ ion, the compound shows fluorescence enhancement. This is the first example of fluorescent organic compound chemosensor for the highly selective detection of Zr4+, Fe3+ ions and acetone simultaneously based on 1, 3, 5-triazine derivatives with the highest density of uncoordinated N and carboxylate O atoms. This study might provide a new method for the rapid detection of Zr4+, Fe3+ ions and acetone with the advantages of simple sample pretreatment processes, highly sensitive and selective sensing.
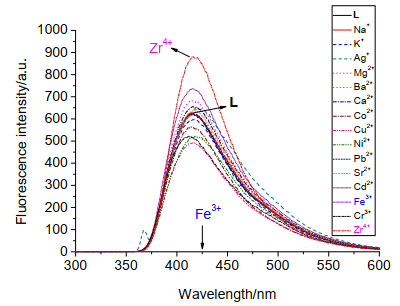
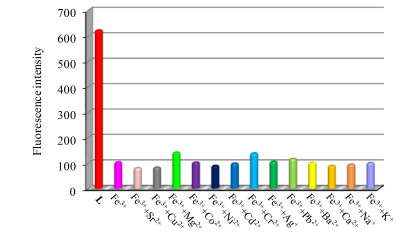
The fluorescent properties of the sensor L in N, N-di- methylformamide (DMF) are measured at room temperature. L exhibits strong fluorescent emission at 415 nm. Furthermore, L is explored for the application in the detection of metal ions in DMF and water system based on fluorescent sensing. In the measurement, 1.2161 mg of freshly prepared samples of L are dissolved in 250 mL DMF solution (1×10⁻⁵ mol•L-1), to which is dropwise added different metal ions of aqueous solution. In this regard, the responses of the fluorescence of L/DMF solution toward 15 different metal cations (Zr4+, Fe3+, Co2+, Cr3+, Ni2+, Cu2+, Cd2+, Pb2+, Ag+, Sr2+, Ba2+, Ca2+, Mg2+, Na+, K+) in aqueous solution were studied and obtained experimental data finally (Figure 2). Obviously, most cations display a negligible influence on fluorescence intensity of L. Specifically, the fluorescence intensity of L at 415 nm changes slightly while Co2+, Cr3+, Ni2+, Cu2+, Pb2+, Ag+, Sr2+, Ba2+, Ca2+, Na+ and K+ ions were added respectively. It can see clearly that is that the fluorescence intensity of L decreases significantly, to which is added Fe3+ ion. Conversely, the fluorescence intensity of L increases significantly while Zr4+ ion is added. In addition, the compound L could rapidly give rise to a visible colorless-to-yellow change after adding Fe3+ ion and the experiments show that yellow is not caused by the color of Fe3+ ion itself.
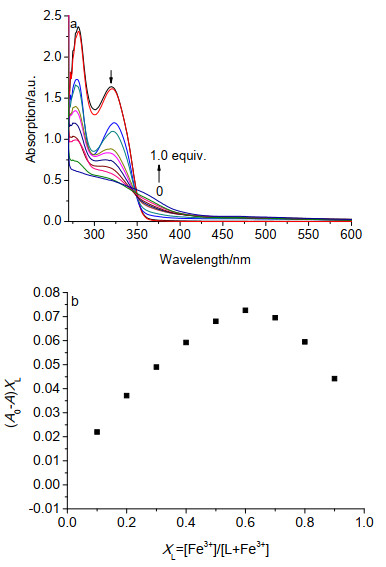
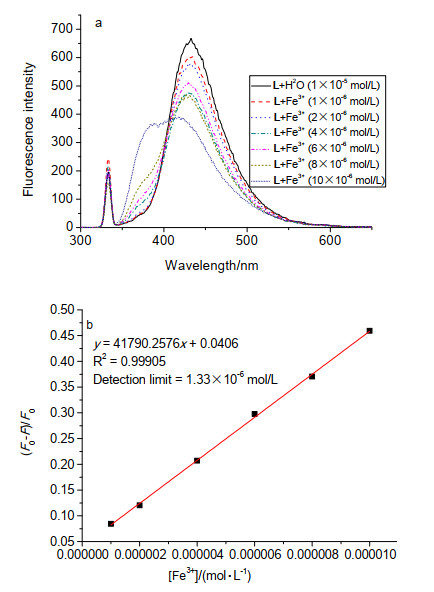
To explore the complexation ratio of L (2.9 mL, 1× 10⁻⁵ mol•L-1) with Fe3+ ion in DMF solution, concentration-dependent experiments were further taken by UV method (Figure 3a). The absorption intensity of L gradually decreased with the increasing concentration of Fe3+ ion. The Job's curve was given according to the UV concentration curve of L and Fe3+ ions (Figure 3b). The results showed that the molar fraction of [Fe3+]/[L+Fe3+] was 0.4 when the curve had inflection point, demonstrating 2: 1 binding stoichiometry ration for L+Fe3+. Moreover, to evaluate the detection effects of L to Fe3+ ion, the fluorescence spectra of L in DMF (2.9 mL, 1×10⁻⁵ mol•L-1) with different concentrations of Fe3+ ion were carried out (Figure 4a). The experimental result showed that with the addition of different concentrations Fe3+ ion, the fluorescence intensity of L gradually decreases and shows a highly broad linear relationship with the concentration of Fe3+ ion from 1×10⁻⁶ to 1×10⁻⁵ mol•L-1 expressed as an equation of y=41790.2576x+0.0406 and R=0.99905, where y is the ratio of (F0-F)/F0 and x is the concentration of Fe3+ ion. The other reported sensors for Fe3+ ion detection are generally within 1.25×10⁻³ mol•L-1 of Fe3+.[39, 40] According to the fluorescence intensity of L, different concentration of Fe3+ and Benesi-Hildebrand equation, the detection limit of Fe3+ in L solution is calculated to be 1.33×10⁻⁶ mol/L (Figure 4b).
(a) [L]=2.9 mL, 1×10⁻⁵ mol•L-1; [Fe3+]=0.1 mL, 1×10⁻⁶~10×10-5 mol•L-1. (b) complexation ratio of L and Fe3+, [Fe3+]=0.1 mL, 1× 10⁻⁶~10×10-5 mol•L-1
(a) [L]=2.9 mL, 1×10⁻⁵ mol•L-1; [Fe3+]=0.1 mL, 1×10⁻⁶~10×10-6 mol• L-1; (b) Detection limit of Fe3+, [Fe3+]=0.1 mL, 1×10⁻⁶~10× 10-6 mol•L-1
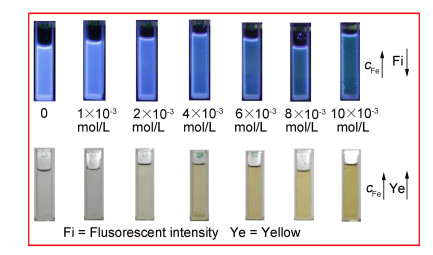
Obviously, the addition of different concentration Fe3+ ion to the DMF solution of L could give rise to a visible colorless-to-yellow change, and clear fluorescence quen- ching while the concentration of Fe3+ is up to 10×10-3 mol•L-1 (Figure 5). The initial fluorescence intensity of L (1×10⁻⁵ mol•L-1) was decreased by 99.9% when only 0.1 mL (1×10⁻¹ mol•L-1) Fe3+ was added. Further, the quenching efficiency can be rationalized by the Stern- Volmer (SV) equation, F0/F=1+KSV[M], where F0 and F are the relative fluorescence intensity before and after adding Fe3+, [M] is the molar concentration of the Fe3+ ion, and KSV (L•mol-1) is the Stern-Volmer quenching constant. The KSV (Fe3+) value is calculated as 7.111×10⁴ L•mol-1, suggesting a strong quenching effect on fluorescence. Under the same conditions, the quenching constants of other metals are shown in Table 1. The reason of fluo-rescence quenching may be that when Fe3+ and L form 2: 1 complex, the structure is isomerized, the imine (NH) bond is broken, and the bond length is shortened, which makes ligand L show color change when encountering Fe3+ ions. And there may be electron and energy transfer between the paramagnetism of Fe3+ and the unfilled d orbital in L, which makes the fluorescence quenching. Meanwhile, the antijamming experiments of Fe3+ ion specifically demonstrate that L can detect Fe3+ ion in the presence of other metal ions (Co2+, Ni2+, Cu2+, Pb2+, Ag+, Sr2+, Ba2+, Ca2+, Na+, K+, Cd2+, Mg2+, Cr2+) (Figure 6).
 下载:
导出CSV
下载:
导出CSV
| Cation | Quenching constant/ (L•mol-1) |
| K+ | 0.424 |
| Ag+ | -0.323 |
| Ba2+ | 0.071 |
| Co2+ | 1.099 |
| Cu2+ | 2.779 |
| Mg2+ | 0.899 |
| Pb2+ | -0.011 |
| Fe3+ | 7.111×10⁴ |
| Na+ | 0.071 |
| Ca2+ | -0.471 |
| Sr2+ | -0.212 |
| Cr2+ | 2.000 |
| Ni2+ | 2.036 |
| Cd2+ | -1.519 |
| Zr4+ | -2.904 |
| a L: 2.9 mL, 1×10⁻³ mol/L; b Concentration of metal ions: 0.1 mL, 1×10⁻¹ mol/L; λex=365 nm. | |
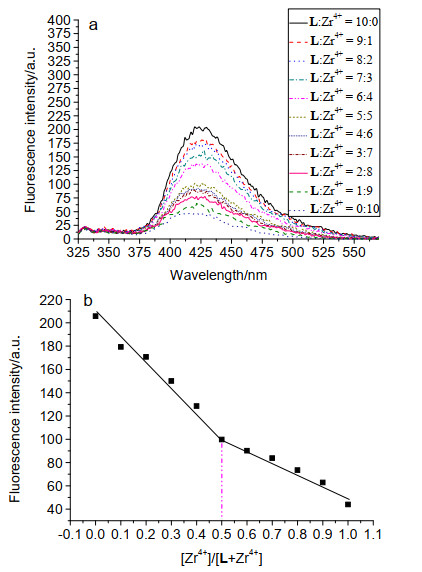
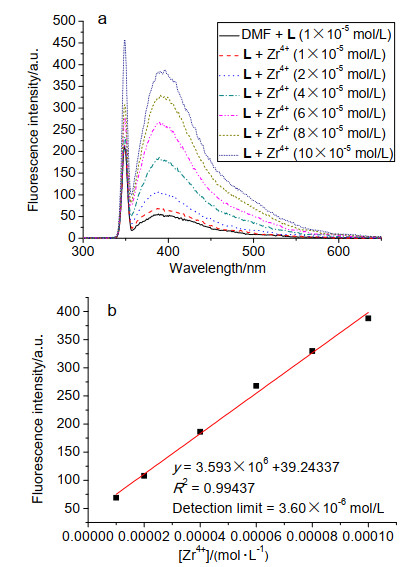
Compared with Fe3+ ion, Zr4+ ion exhibits superior fluorescence enhancement effect on L. To explore the detection effects of L in DMF (2.9 mL, 1×10⁻⁶ mol•L-1) as the fluorescence probe of Zr4+, concentration-dependent experiments were further taken (Figure 7). The fluorescence intensity of L gradually enhanced with the increasing concentration of Zr4+ ion. The fluorescence enhancement may be attributed to the formation of Zr-O and Zr-N bonds in L and Zr4+ ions, which enhance the rigid structure of the complexes. Simultaneously, the transition from n-π* to π-π* in the complexes may also be the reason of fluorescence enhancement. The Job's curve was given according to the fluorescence concentration curve of L and Zr4+ions (Figure 7b). The results showed that the molar fraction of [Zr4+]/[L+Zr4+] was 0.5 when the curve has inflection point, demonstrating 1: 1 binding stoichiometry ration for L+Zr4+. Moreover, to evaluate the detection effects of L to Zr4+ ion, the fluorescence spectra of L in DMF (2.9 mL, 1×10⁻⁵ mol•L-1) with different concentrations of Zr4+ ion were taken (Figure 8). The experimental results show that with the addition of different concentrations Zr4+ ion, the fluorescence intensity of L gradually enhanced and showed a highly broad linear relationship with the concentration of Zr4+ ion from 1×10⁻⁵ to 1× 10⁻⁴ mol•L-1 expressed as an equation of y=3.592× 10⁶x+39.24337 and R=0.99437, where y is fluorescence intensity of L with different concentration Zr4+ and x is the concentration of Zr4+ ion. According to the fluorescence intensity of L, different concentration of Zr4+ and benesi-Hildebrand equation, the detection limit of Zr4+ in L solution is calculated to be 3.60×10⁻⁶ mol/L.
(a) [L]=2.9 mL, 1×10⁻⁵ mol•L-1; [Zr4+]=0.1 mL, 1×10⁻⁶~10×10-6 mol•L-1. (b) Complexation ratio of L and Zr4+, [Zr4+]=0.1 mL, 1× 10⁻⁶~10×10-6 mol•L-1
(a) [L]=2.9 mL, 1×10⁻⁵ mol•L-1; [Zr4+]=0.1 mL, 1×10⁻⁵~10×10-5 mol• L-1. (b) Detection limit of Zr4+; [Zr4+]=0.1 mL, 1×10⁻⁵~10× 10-5 mol•L-1
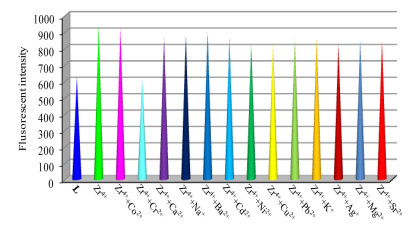
Of course, the antiinterference ability is also very important for sensors, so a series of antijamming experiments were performed for L (Figure 9). Initially, the fluorescence intensity of L containing Zr4+ ion shows negligible change with the addition of other metal ions except Cr2+ ion. The negligible change of the fluorescence intensity indicates that L can detect Zr4+ ion in the presence of other metal ions (Co2+, Ni2+, Cu2+, Pb2+, Ag+, Sr2+, Ba2+, Ca2+, Na+, K+, Cd2+, Mg2+).
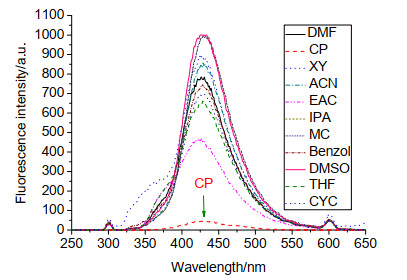
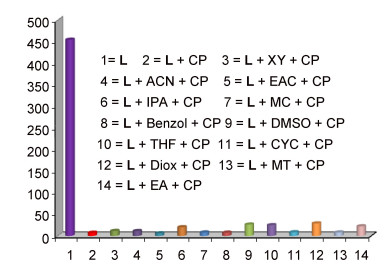
The solvents play an important role in the fluorescence of compound L. Different organic solvents have different effects on the fluorescence of compound L. The fourteen different organic solvents, DMF, acetone (CP), xylene (XY), acetonitrile (ACN), ethyl acetate (EAC), isopropyl alcohol (IPA), dichloromethane (MC), benzene (Benzol), dimethyl sulfoxide (DMSO), tetrahydrofuran (THF), cyclohexane (CYC), 1, 4-dioxane (Diox), methanol (MT) and ethanol (EA), in DMF solution were investigated and obtained experimental data finally (Figure 10). The solvents Diox, MT and EA have enhanced fluorescence effect on compound L, and the intensity exceeds the upper limit of instrument detection. Compared with DMF, it may be due to the strong polarity and weak p-π conjugation of 1, 4- dioxane, which lead to the fluorescence enhancement and blue shift of L, while the fluorescence enhancement and red shift of L may be due to the strong polarity of methanol and ethanol, forming hydrogen bond with L. The results show that the initial fluorescence intensity of L (1×10⁻⁵ mol•L-1) was decreased by 94.48% when only 0.1 mL of acetone was added. The acetone showed a strong quenching effect on fluorescence of compound L. It may be that there is energy transfer between compound L and acetone, which makes the excitation of compound L and the absorption of acetone has some competitive effect, which leads to the rapid decrease of fluorescence intensity of L. It was subsequently studied a possible interference of various organic solvents on selective quenching of the fluorescence of L caused by acetone (Figure 11). It is found that there is no significant impact of other solvent on the quenching of the fluorescence caused by the presence of acetone. Interestingly, when the λex is larger than 300 nm, the fluorescence quenching of compound L by acetone is not obvious. To some extent, the fluorescence effect of solvent on compound L depends on the specific λex.
The high selectivity and sensitivity make L promising as a fluorescent probe for detecting Fe3+ in aqueous solution. To show its potential for application in biological samples, the fluorescent L probe was applied to the detection of Fe3+ in human urine samples. Six human urine samples were donated by healthy volunteers. The urine samples were acidified with nitric acid and centrifuged at 5000 r/min for 10 min. Add 0.1 mL of urine directly to DMF solution of compound L without any other treatment before test analysis. The concentrations of Fe3+ ions in urine were calculated by Stern-Volmer (SV) equation and the values of y=41790.2576x+0.0406 were shown in Table 2. The range of Fe3+ ions in six urine samples was about 1.68~5.78 μmol•L-1 by calculation. In a sense, compound L can be used as a fluorescence probe to measure the molarity of Fe3+ ion conveniently. Of course, the flow injection ICPMS (inductively coupled plasma mass spectrometry) method can also be used to accurately analyze Fe3+ in human urine.
下载:
导出CSV
| Urine | F0 | F | [Fe3+]/(μmol•L-1) | Error | |
| F0/Fb | Yc | ||||
| 1 | 573.90 | 411.89 | 5.53 | 5.78 | ±0.25 |
| 2 | 573.90 | 449.90 | 3.86 | 4.19 | ±0.33 |
| 3 | 573.90 | 505.17 | 1.91 | 1.89 | ±0.02 |
| 4 | 573.90 | 510.28 | 1.75 | 1.68 | ±0.07 |
| 5 | 573.90 | 435.67 | 4.46 | 4.79 | ±0.33 |
| 6 | 573.90 | 475.64 | 2.91 | 3.12 | ±0.21 |
| a L: 2.9 mL, 1×10⁻⁵ mol/L; sample: 0.1 mL; λex=300 nm. b F0/F=1+KSV [Fe3+]; c y=41790.2576x+0.0406. | |||||
Besides, the tap-water and drinking-water were also tested by the above detection methods, and the concentrations of Fe3+ ions were 10.7 (9.38) and 2.28 (2.36) μmol• L-1, respectively. It should be mentioned that the Environmental Protection Ministry (P. R. China) established the standard (5.4 μmol•L-1) for the presence of Fe3+ ions in drinking H2O. In this way, the tap-water cannot meet the drinking requirements, while the direct-drinking water is within the scope of national standards.
In summary, as a fluorescence probe, L shows high sensitivity and selectivity for Zr4+, Fe3+ ions and acetone, and the detection of Fe3+ ion can be observed by naked eye. Meanwhile, the experimental results show that the trace of Fe3+ ion could remarkably decrease the fluorescence of L. In contrast to this, the trace of Zr4+ ion could remarkably increase the fluorescence of L. The detection of Fe3+ ion in human urine and water was realized above two detection methods. Therefore, It is expected that the compound L can be used as a tunable organic fluorescence material by Fe3+ and Zr4+ ions, and also as a good probe to identify acetone in organic solvent. This study might also provide a new idea of designing fluorescent organic compound chemosensors for the sensitive and selective detection of metal ions and acetone.
All reagents were purchased commercially and used without further purification unless otherwise noted. 1H NMR spectra were recorded using 500 MHz, and 13C NMR spectra were recorded using 125 MHz. Elemental analyses of C, H, N in the solid samples were tested on a Vario EL analyzer (Elementar Analysensysteme GmbH). FT-IR spectra were recorded in the range of 500~4000 cm-1 on a Perkin-Elmer FTIR spectrometer using KBr pellets. The fluorescence spectra were acquired on an F4500 spectrometer with a 850W Xenon lamp as the excitation source at room temperature.
The L was synthesized according to the literature method[41~43] with some modification (Scheme 1). Generally speaking, the reaction of cyanuric chloride is step-by-step. Low temperature is conducive to the first substitution, the second substitution at 50~60 ℃, and the third substitution at 110~120 ℃. It is verified by the following two methods. The results show that they are both suitable for the synthesis of L by step-by-step and one pot reaction.
Method 1: 2.263 g (16.5 mmol) of 2-aminobenzoic acid and 25 mL of AcOH were added to a 100 mL round bottom flask. 0.922 g (5.0 mmol) of cyanuric chloride was dissolved in 20 mL of AcOH and slowly dripped into the round bottom flask under the ice bath. The mixture reacts at 0 ℃ for 5 h. Then, the reaction continued for 5 h at 50 ℃. Finally, the reaction refluxed at 120 ℃ for 20 min. The suspension was filtered and the product was washed several times with boiling water and ethanol, and then the product was dried in vacuum dryer at 80 ℃ for one day. 2.345 g of white powder was collected in 96.4% yield.
Method 2: 0.922 g (5.0 mmol) of cyanuric chloride and 2.263 g (16.5 mmol) of 2-aminobenzoic acid were dissolved in 50 mL of AcOH in a 100 mL round-bottom flask. The mixture was stirred and refluxed immediately at 120 ℃ for 15 min, generating a pink aqueous suspension. Then, the suspension was filtered and the product was washed several times with boiling water and ethanol, and then the mixture was dried in vacuum dryer at 80 ℃ for one day. 2.352 g of white powder was collected in 96.7% yield.
2, 2', 2''-(1, 3, 5-Triazine-2, 4, 6-triimino)tribenzoic acid (L): m.p.≥330 ℃ (dec.); 1H NMR (DMF-d7, 500 MHz) δ: 11.19 (s, 3H, COOH), 8.86 (d, J=10.0 Hz, 3H, ArH), 8.13~8.15 (m, 3H, ArH), 7.68~7.72 (m, 3H, ArH), 7.16~7.20 (m, 3H, ArH); IR (KBr) v: 3440, 3312, 1685, 1610, 1567, 1523, 1413, 1161; 13C NMR (DMF-d7, 125 MHz) δ: 170.1, 164.5, 142.2, 133.8, 131.5, 121.6, 120.9, 123.3, 116.3 cm-1. Anal. calcd for C24H18N6O6: C 59.26, H 3.73, N 17.28; found C 58.31, H 3.58, N 16.57.
Wang, P.; Okamura, T.; Zhou, H. P.; Sun, W. Y.; Tian, Y. P. Chin. Chem. Lett. 2013, 24(1), 20. doi: 10.1016/j.cclet.2012.12.010
Xu, H.; Hu, H. C.; Cao, C. S.; Zhao, B. Inorg. Chem. 2015, 54(10), 4585. doi: 10.1021/acs.inorgchem.5b00113
Wang, J.; Jiang, M.; Yan, L.; Peng, R.; Huangfu, M. J.; Guo, X. X.; Li, Y.; Wu, P. Y. Inorg. Chem. 2016, 55(24), 12660. doi: 10.1021/acs.inorgchem.6b01815
Yan, W.; Zhang, C.; Chen, S. G.; Han, L. J.; Zheng, H. G. ACS Appl. Mater. Interfaces 2017, 9(19), 1629.
Arici, M. Cryst. Growth Des. 2017, 17(10), 5499. doi: 10.1021/acs.cgd.7b01024
Li, P.; Zhou, L. J.; Yang, N. N.; Sui, Q.; Gong, T.; Gao, E. Q. Cryst. Growth Des. 2018, 18(11), 7191. doi: 10.1021/acs.cgd.8b01383
Tang, S. F.; Hou, X. M. Cryst. Growth Des. 2019, 19(1), 45.
Zheng, M.; Tan, H. Q.; Xie, Z. G.; Zhang, L. G.; Jing, X. B.; Sun, Z. C. ACS Appl. Mater. Interfaces 2013, 5(3), 1078. doi: 10.1021/am302862k
Xu, X. Y.; Yan, B. ACS Appl. Mater. Interfaces 2015, 7(1), 721. doi: 10.1021/am5070409
Wen, G. X.; Wu, Y. P.; Dong, W. W.; Zhao, J.; Li, D. S.; Zhang, J. Inorg. Chem. 2016, 55(20), 10114. doi: 10.1021/acs.inorgchem.6b01876
Rao, P. C.; Mandal, S. Inorg. Chem. 2018, 57(19), 11855. doi: 10.1021/acs.inorgchem.8b02017
Gogoi, C.; Biswas, S. Dalton Trans. 2018, 47(41), 14696. doi: 10.1039/C8DT03058H
Yu, C. Y.; Sun, X. D.; Zou, L. F.; Li, G. H.; Zhang, L. R.; Liu, Y. L. Inorg. Chem. 2019, 58(6), 4026. doi: 10.1021/acs.inorgchem.9b00204
He, H. M.; Zhu, Q. Q.; Li, C. P.; Du, M. Cryst. Growth Des. 2019, 19(2), 694. doi: 10.1021/acs.cgd.8b01271
贾慧劼, 韩利民, 竺宁, 高媛媛, 王亚琦, 索全伶, 有机化学, 2019, 39(6), 1753. doi: 10.6023/cjoc201811024Jia, H. J.; Han, L. M.; Zhu, N.; Gao, Y. Y.; Wang, Y. Q.; Suo, Q. L. Chin. J. Org. Chem. 2019, 39(6), 1753(in Chinese). doi: 10.6023/cjoc201811024
Liu, M. L.; Chen, B. B.; Li, C. M.; Huang, C. Z. Sci. China:Chem. 2019, 62(8), 968. doi: 10.1007/s11426-019-9449-y
Yu, L.; Qiao, Y. M.; Miao, L. X.; He, Y. Q.; Zhou, Y. Chin. Chem. Lett. 2018, 29(11), 1545. doi: 10.1016/j.cclet.2018.09.005
庞楚明, 罗时荷, 郝志峰, 高健, 黄召昊, 余家海, 余思敏, 汪朝阳, 有机化学, 2018, 38(10), 2606. doi: 10.6023/cjoc201804009Pang, C. M.; Luo, S. H.; Hao, Z. F.; Gao, J.; Huang, Z. H.; Yu, J. H.; Yu, S. M.; Wang, Z. Y. Chin. J. Org. Chem. 2018, 38(10), 2606(in Chinese). doi: 10.6023/cjoc201804009
Sheng, K.; Lu, H. F.; Sun, A. B.; Wan, Y. M.; Liu, Y. T.; Chen, F.; Bian, W. C.; Li, Y.; Kuang, R.; Sun, D. Chin. Chem. Lett. 2019, 30(4), 895. doi: 10.1016/j.cclet.2019.01.027
Wang, J. H.; Fan, Y. d.; Lee, H. W.; Yi, C. Q.; Cheng, C. M.; Zhao, X.; Yang, M. ACS Appl. Nano Mater. 2018, 1(7), 3747. doi: 10.1021/acsanm.8b01083
Huang, J. J.; Yu, J. H.; Bai, F. Q.; Xu, J. Q. Cryst. Growth Des. 2018, 18(9), 5353. doi: 10.1021/acs.cgd.8b00773
Lu, S. Q.; Liu, Y. Y.; Duan, Z. M.; Wang, Z. X.; Li, M. X.; He, X. Cryst. Growth Des. 2018, 18(8), 4602. doi: 10.1021/acs.cgd.8b00575
Smith, J. A.; Singh-Wilmot, M. A.; Carter, K. P.; Cahill, C. L.; August Ridenour, J. Cryst. Growth Des. 2019, 19(1), 305.
Fan, K.; Bao, S. S.; Nie, W. X.; Liao, C. H.; Zheng, L. M. Inorg. Chem. 2018, 57(3), 1079.
Zhang, H. J.; Fan, R. Q.; Chen, W.; Fan, J. Z.; Dong, Y. W.; Song, Y., Du, X.; Wang, P.; Yang, Y. L. Cryst. Growth Des. 2016, 16(9), 5429. doi: 10.1021/acs.cgd.6b00903
Zhang, C. H.; Shi, H. Z.; Sun, L. B.; Yan, Y.; Wang, B. L.; Liang, Z. Q.; Wang, L.; Li, J. Y. Cryst. Growth Des. 2018, 18(12), 7683. doi: 10.1021/acs.cgd.8b01535
Yoon, C. S.; Choi, M. J.; Jun, D. W.; Zhang, Q.; Kaghazchi, P.; Kim, K. H.; Sun, Y. K. Chem. Mater. 2018, 30(5), 1808. doi: 10.1021/acs.chemmater.8b00619
Yoon, C. S.; Kim, U. H.; Park, G. T.; Kim, S. J.; Kim, K. H.; Kim, J.; Sun, Y. K. Energy Lett. 2018, 3(7), 1634. doi: 10.1021/acsenergylett.8b00805
Meng, H. M.; Fu, T.; Zhang, X. B.; Wang, N. N.; Tan, W. H.; Shen, G. L.; Yu, R. Q. Anal. Chem. 2012, 84(5), 2124. doi: 10.1021/ac300005f
Wang, B; Yang, Q.; Guo, C.; Sun, Y. X.; Xie, L. H.; Li, J. R. ACS Appl. Mater. Interfaces 2017, 9(11), 10286. doi: 10.1021/acsami.7b00918
Xu, M. M.; Kong, X. J.; He, T.; Wu, X. Q.; Xie, L. H.; Li, J. R. Inorg. Chem. 2018, 57(22), 14260. doi: 10.1021/acs.inorgchem.8b02282
何平, 汤立军, 钟克利, 侯淑华, 燕小梅, 有机化学, 2017, 37(2), 423. doi: 10.6023/cjoc201608003He, P.; Tang, L. J.; Zhong, K. L.; Hou, S. H.; Yan, X. M. Chin. J. Org. Chem., 2017, 37(2), 423(in Chinese). doi: 10.6023/cjoc201608003
Yu, L.; Qiao, Y. M.; Miao, L. X.; He, Y. Q.; Zhou, Y. Chin. Chem. Lett. 2018, 29(11), 1545. doi: 10.1016/j.cclet.2018.09.005
Wang, T.; Liu, Q. H.; Gao, Y, ; Yang, X. Y.; Yang, W. T.; Dang, S. Chin. Chem. Lett. 2016, 27(4), 497. doi: 10.1016/j.cclet.2016.01.011
Zhang, Q. S.; Wang, J.; Kirillov, A. M.; Dou, W.; Xu, C.; Xu, C. L.; Yang, L. Z.; Fang, R.; Liu, W. S. ACS Appl. Mater. Interfaces 2018, 10(28), 23976. doi: 10.1021/acsami.8b06103
Zhao, X. X.; Wang, S. L.; Zhang, L. Y.; Liu, S. Y.; Yuan, G. Z. Inorg. Chem. 2019, 58(4), 2444.
Wang, X.; Fan, W. D.; Zhang, M.; Shang, Y. Z.; Wang, Y. T.; Liu, D.; Guo, H. L.; Dai, F. N.; Sun, D. F. Chin. Chem. Lett. 2019, 30(3), 801. doi: 10.1016/j.cclet.2018.12.009
Huang, W. H.; Ren, J.; Yang, Y. H.; Li, X. M.; Wang, Q.; Jiang, N.; Yu, J. Q.; Wang, F.; Zhang, J.. Inorg. Chem. 2019, 58(2), 1481.
Chen, Z.; Sun, Y. W.; Zhang, L. L.; Sun, D.; Liu, F. L.; Meng, Q. G.; Wang, R. M.; Sun, D. F. Chem. Commun. 2013, 49(98), 11557. doi: 10.1039/c3cc46613b
Wang, R.; Dong, X. Y.; Xu, H.; Pei, R. B.; Ma, M. L.; Zang, S. Q.; Hou, H. W.; Mak, T. C. W. Chem. Commun. 2014, 50(65), 9153. doi: 10.1039/C4CC03268C
Karuehanon, W.; Fanfuenha, W.; Rujiwatra, A.; Pattarawarapan, M. Tetrahedron Lett. 2012, 53(27), 3486. doi: 10.1016/j.tetlet.2012.04.124
Wang, X. S.; Liang, J; Li, L.; Lin, Z. J.; Bag, P. P.; Gao, S. Y.; Huang, Y. B.; Cao, R. Inorg. Chem. 2016, 55(5), 2641. doi: 10.1021/acs.inorgchem.6b00019
Kolmakov, K. A. J. Heterocycl. Chem. 2008, 45(2), 533. doi: 10.1007/s10953-008-9298-7

Figure 2 Fluorescence spectra of L (2.9 mL, 1×10⁻⁵ mol•L-1) with different metal cations (0.1 mL, 10-1 mol•L-1) (λex=365 nm)

Figure 3 (a) UV-vis spectra of L with different concentration Fe3+ and (b) Job's plot of L with Fe3+
(a) [L]=2.9 mL, 1×10⁻⁵ mol•L-1; [Fe3+]=0.1 mL, 1×10⁻⁶~10×10-5 mol•L-1. (b) complexation ratio of L and Fe3+, [Fe3+]=0.1 mL, 1× 10⁻⁶~10×10-5 mol•L-1

Figure 4 Fluorescence spectra (a) of L with different concentration Fe3+ and detection limit (b) of L with Fe3+ (λex=324 nm)
(a) [L]=2.9 mL, 1×10⁻⁵ mol•L-1; [Fe3+]=0.1 mL, 1×10⁻⁶~10×10-6 mol• L-1; (b) Detection limit of Fe3+, [Fe3+]=0.1 mL, 1×10⁻⁶~10× 10-6 mol•L-1

Figure 7 (a) Fluorescence spectra of L with different concentration Zr4+ and (b) Job's plot of L with Zr4+ (λex=300 nm)
(a) [L]=2.9 mL, 1×10⁻⁵ mol•L-1; [Zr4+]=0.1 mL, 1×10⁻⁶~10×10-6 mol•L-1. (b) Complexation ratio of L and Zr4+, [Zr4+]=0.1 mL, 1× 10⁻⁶~10×10-6 mol•L-1

Figure 8 (a) Fluorescence spectra of L with different concentration Zr4+ and (b) detection limit of L with Zr4+ (λex=348 nm)
(a) [L]=2.9 mL, 1×10⁻⁵ mol•L-1; [Zr4+]=0.1 mL, 1×10⁻⁵~10×10-5 mol• L-1. (b) Detection limit of Zr4+; [Zr4+]=0.1 mL, 1×10⁻⁵~10× 10-5 mol•L-1
Table 1. Quenching constants of different metals in DMF solution of La
| Cation | Quenching constant/ (L•mol-1) |
| K+ | 0.424 |
| Ag+ | -0.323 |
| Ba2+ | 0.071 |
| Co2+ | 1.099 |
| Cu2+ | 2.779 |
| Mg2+ | 0.899 |
| Pb2+ | -0.011 |
| Fe3+ | 7.111×10⁴ |
| Na+ | 0.071 |
| Ca2+ | -0.471 |
| Sr2+ | -0.212 |
| Cr2+ | 2.000 |
| Ni2+ | 2.036 |
| Cd2+ | -1.519 |
| Zr4+ | -2.904 |
| a L: 2.9 mL, 1×10⁻³ mol/L; b Concentration of metal ions: 0.1 mL, 1×10⁻¹ mol/L; λex=365 nm. | |
 下载: 导出CSV
Table 2. Detection of Fe3+ ion concentration in human urine by fluorescence of compound La
| Urine | F0 | F | [Fe3+]/(μmol•L-1) | Error | |
| F0/Fb | Yc | ||||
| 1 | 573.90 | 411.89 | 5.53 | 5.78 | ±0.25 |
| 2 | 573.90 | 449.90 | 3.86 | 4.19 | ±0.33 |
| 3 | 573.90 | 505.17 | 1.91 | 1.89 | ±0.02 |
| 4 | 573.90 | 510.28 | 1.75 | 1.68 | ±0.07 |
| 5 | 573.90 | 435.67 | 4.46 | 4.79 | ±0.33 |
| 6 | 573.90 | 475.64 | 2.91 | 3.12 | ±0.21 |
| a L: 2.9 mL, 1×10⁻⁵ mol/L; sample: 0.1 mL; λex=300 nm. b F0/F=1+KSV [Fe3+]; c y=41790.2576x+0.0406. | |||||
下载: 导出CSV

 扫一扫看文章

扫一扫关注我们