
Figure 1.
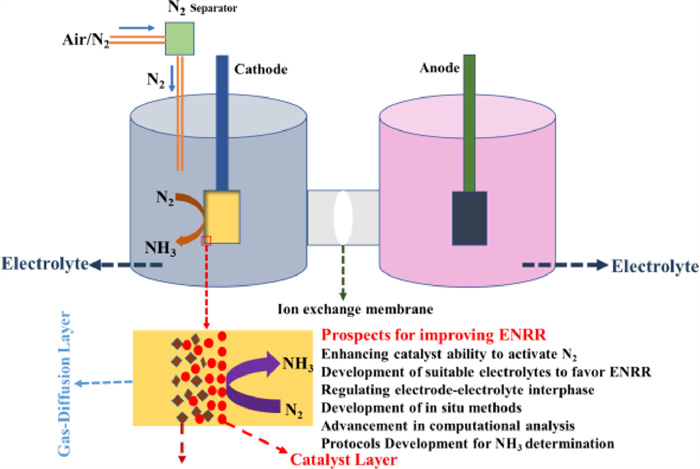
Schematic diagram for the recent progress on the electrolytes for ENRR toward NH3.
Recent progress and prospects of electrolytes for electrocatalytic nitrogen reduction toward ammonia
Sajid Mahmood , Haiyan Wang , Fang Chen , Yijun Zhong , Yong Hu

Ammonia (NH3) has been used as fertilizer in the past century and contributed to population growth. Besides, NH3 is recognized as a clean energy transporter for chemical energy storage because of its high gravimetric density of hydrogen (17.8 wt%) [1–4]. As the most widely formed industrial compound in the world, 89.9% of NH3 is synthesized by the Haber-Bosch method [2,5,6]. The Haber-Bosch process has been revolutionary in agriculture, but it requires extreme temperature and high pressure to break the N≡N triple bond, including pressures of 20–40 MPa and temperatures of 400–600 ℃ even using Fe-based catalysts. Another drawback is that low temperature is required to capture nitrogen (N2) for the Haber-Bosch process. Besides, hydrogen gas (H2) produced from fossil fuels has extremely endothermic processes. Keeping in mind, the cost of H2 owns about 75% of NH3 production cost [7]. The remaining 25% of expenditure is for separating and synthesizing NH3. Moreover, an estimated 300 million metric tons of carbon dioxide (CO2) are produced, seriously aggravating the greenhouse effect [7–10]. Hence, it is urgent to discover a more efficient approach that can operate under more moderate conditions for synthesizing NH3.
Over the past decade, several attempts, such as non-thermal plasma catalysis, low-temperature thermal catalysis, photocatalysis, electrochemical catalysis, and enzymatic catalysis, have been made to fix N2 toward NH3 under favorable reaction conditions [11]. Among them, electrochemical N2 reduction reaction (ENRR) using renewable electricity can provide a promising candidate for sustainable NH3 synthesis [12]. ENRR has several potential advantages. First, NH3 can be synthesized electrochemically under mild conditions. Second, NH3 can be synthesized locally and on a small-scale using electrochemical synthesis and renewable energy derived from solar or wind sources. Finally, water is typically employed directly as the H source in the electrochemical synthesis of NH3 without requiring fossil energy [2]. Despite experiments being reported in 1960, ENRR to NH3 has recently received major attention, and therefore, the number of studies has dramatically expanded.
The N2 reduction process on electrode surface can be summed up as follows: N2 molecules adsorb on the electrode surface, which is further reduced by the external circuit electrons while the protons are simultaneously supplied to produce NH3. Significant advancements have been made in ENRR over the past several years under benign conditions. However, the poor NH3 production rates and low Faradaic efficiency (FE) severely limit its practical applications [13,14]. The main limitations are shown as follows: (1) Due to small overpotential, hydrogen evolution reaction (HER) is the key competing reaction that impedes FE progression [15]; (2) Low electrochemical performance is caused by N2 molecules being difficult to adsorb and activate due to their high dissociation energy (941 kJ/mol) and low proton affinity [16]; (3) The electrocatalytic performance is significantly affected by the slight solubility and poor mass transfer of N2 in electrolyte solutions.
Since electrode materials are essential for ENRR, it has undergone extensive research, including unsupported and supported noble metals, metal nitrides, metal oxides, and non-metals, expecting to improve the excellent electrochemical efficiency. In addition to electrocatalysts, electrolytes, as the significant component for electrolysis, significantly influence the performance and catalytic process. Liquid electrolytes such as aqueous alkaline and acidic electrolytes, ionic liquids (ILs), alkali metal hydroxides or chloride salts, and so on have been adopted in the electrochemical synthesis of NH3. However, the rational selection of a new system for heterogeneous electrocatalytic reduction of N2 needs to comprehend the mechanisms of electrode materials and electrolytes, which are still immature. Previously, many reviews have focused on the advances of electrocatalysts for ENRR, while the performance of electrocatalysts in various electrolytes has received comparatively little attention. Therefore, a timely review of the most recent developments in this field is urgently needed.
Herein, the recent progress on the electrolytes for ENRR toward NH3 is reviewed (Fig. 1). First, the fundamentals of ENRR are provided, with a brief discussion of reaction pathways, reaction kinetics, and thermodynamics, as well as methods for NH3 detection. Then, the important recent contributions of electrolytes and mediators in converting N2 to NH3 with some representative electrocatalysts in various types of electrolytes are summarized. Finally, the perspective of this technology is provided which also offers thoughts on current issues and opportunities in this focus field.
Typically, the ENRR is carried out in a three-electrode system with cathodic and anodic cells separated by a membrane for proton exchange. N2 is used as the N source, while the H source is supplied by acid electrolytes or water electrolysis in basic electrolytes [17]. The oxygen evolution reaction (OER) is an anodic reaction, and ENRR happens in the cathodic cell, dependent on pH of electrolytes.
In acidic electrolytes, electrode reactions are represented as following equations.
Anodic reaction:
|
|
(1) |
Cathodic reaction:
|
|
(2) |
Under alkaline conditions, N2 molecules directly combine with water and electrons in the cathode to produce NH3, unlike in acidic electrolytes. The anodic reaction and cathodic reactions are shown as follows [18].
Anodic reaction:
|
|
(3) |
Cathodic reaction:
|
|
(4) |
The overall reaction:
|
|
(5) |
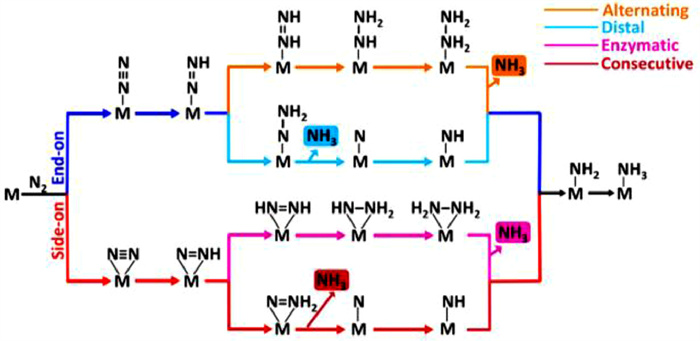
Due to its complexity, the reaction mechanisms for the ENRR to NH3 are not entirely understood. Generally, the associative and dissociative mechanisms are two main categories used to classify the reaction mechanism [19,20]. The specific reaction pathways adopted by N2 reduction reaction are determined by the configurations in which N2 molecules are adsorbed. As shown in Fig. 2, N2 adsorption using an end-on pattern occurs through distal and alternate pathways for the ENRR. Alternatively, the N2 molecule is adsorbed with a side-on pattern through enzymatic and consecutive pathways for the reduction reaction [21]. Before hydrogenation, the dissociative pathway breaks the triple bond of the adsorbed N2 molecule, leaving N atoms on the catalyst surface. The left N atom subsequently hydrogenates to form NH3 [22]. Such dissociative pathway generally occurs in Haber-Bosch process and is difficult to realize in ambient conditions due to its high energy consumption. In an associative alternating pathway, the adsorbed N2 with two N centers are protonated until the final N–N bond is dissociated. In particular, the first NH3 is produced with the last N–N bond dissociation, while another NH3 is formed by proton addition one by one. The first NH3 is produced through consecutive hydrogenation, which occurs predominantly at the N atoms located far away from the catalyst for associative distal pathway. Then, the generation of the second NH3 is accomplished by adding protons to the N atom. According to the thermodynamics prospectus, the associative mechanism is the preferred pathway for the ENRR to produce NH3 [23].
The hydrogenation of N2 to produce NH3 is thermodynamically preferred (△GfƟ = −16.48 kJ/mol, △HfƟ = −92.22 kJ/mol), but kinetics hindered. The negative electron affinity (−1.9 eV), high ionization potential (15.83 eV), significant energy gap (10.82 eV), low proton affinity (493.8 kJ/mol), and high dissociation energy (941.0 kJ/mol) between the lowest unoccupied and highest occupied molecular orbitals of the N2 molecule all work together to prevent electron transfer. Additionally, the partially hydrogenated diazene (N2H2) (△HfƟ = 212.90 kJ/mol) and hydrazine (N2H4) (△HfƟ = 95.34 kJ/mol) molecules exhibit extremely high formation enthalpies. As a result, even in a very acidic environment, N2 is difficult to activate and cannot immediately protonate [17,24].
The ENRR is a multi-step reduction involving the transfer of six electrons and six protons. The respective equilibrium potentials for HER and ENRR in acidic and alkaline conditions are shown as follows [25,26].
|
|
(6) |
|
|
(7) |
|
|
(8) |
|
|
(9) |
Equilibrium potentials for Eqs. 6 and 8 that create H2 are comparable to those for Eqs. 7 and 9 for N2 reduction. In contrast, during a single half-reaction, the HER process only takes two electrons to make one hydrogen. On the other hand, the average of several stages is used to compute the standard electrode potential (EƟ) for the 6e− reductions of N2 to NH3. The thermodynamic parameters for 2e− reductions from N2 to NH3 are provided in Eqs. 10–12 in terms of EƟ values. EƟ values are calculated using experimentally determined standard generating Gibbs free energy (△GfƟ, 298 K). Some EƟ values in the primary source have questionable attribution and different values have been reported. References to △GfƟ (298.0 K) are used for aqueous conditions whenever available to prevent ambiguity. The △GfƟ (298.0 K) values used to determine EƟ, unless otherwise stated, were obtained from the National Bureau of Standardization database [27].
|
|
(10) |
|
|
(11) |
|
|
(12) |
Poor FEs for NH3 production are consistent with the highly endoergic process in Eq. 10 [19]. The thermodynamic restrictions imposed for hypothetical one-electron reduction intermediates can be used to understand the N2 reduction cycle. EƟ establishes oneelectron reduction by the gas phase electron affinity for N2 (Eq. 13) [28].
|
|
(13) |
Hence, HER is more energetically favorable than the ENRR to NH3, as demonstrated by Eqs. 6–9. Significant barriers exist to forming potential intermediate species linked with the first reduction processes, that must be overcome through electrolytes and catalyst design.
The thermodynamic technique has also demonstrated an energy link, known as the scale relationship, between the intermediates in catalytic reactions involving several intermediates [29]. As the binding energies of N2H and NH2 are not independent, ENRR requires a limiting overvoltage of 0.4 V [11]. Therefore, it is possible to find alternative reaction routes that can link the intermediates in various ways [29,30].
Besides, from a kinetic perspective, the ENRR may undergo either proton-coupled electron transfer (PCET) process or sequential proton-electron transfer (SPET) process. Yet, compared to SPET, the PCET process is thermodynamically preferable. Besides, due to the involving of proton and electron during the PCET processes, the HER process would be more competitive as it only requires two protons and two electrons [31,32]. Additionally, it has been theoretically established that H atoms adhere to electrocatalyst surfaces far more readily than N2 molecules, resulting in H atoms occupying most of the active sites [32]. Hence, the HER displays substantially faster kinetics and is more favorable compared to the ENRR process, acting as the bottleneck problem for ENRR [14]. Additionally, the NH3 yield rate is constrained by the difficulty of N2 activation due to the thermodynamic stability and chemical inertness of the N2 molecules [26,33].
Generally, the PCET process, the desorption of products, and the transport and adsorption of reactants including proton donors or N2 molecules all occur concurrently at the electrode/electrolyte interface where both the HER and ENRR take place [25,34]. The components of the electrolytes and the local microenvironment close to the electrode/electrolyte interface may significantly influence the mass diffusion, the protons and electron availability for the two processes, which have a significant impact on the ENRR and HER performances [35]. Hence, electrolyte engineering and microenvironment regulation at the electrode/electrolyte interface with a focus on adjusting the diffusion, availability, and local concentration of proton donors are crucial to the trade-off between ENRR and HER and, in the end, facilitates the ENRR process [26,36].
The key parament to evaluate the electrocatalyst performance is based on the quantity of NH3 produced. Ion-selective electrode detection, isotope detection, ion chromatography, and spectrophotometry are primary techniques for NH3 detection [26]. The most common spectrophotometric techniques are known as the indophenol blue method and Nessler reagent method. These two methods are generally adopted for NH3 detection because of their high sensitivity levels and low cost. Indophenol blue method has higher color rendering, low detection limits (10× 10−6 mol/L), and excellent reproducibility. In contrast, the Nessler reagent method is better in reducing reagent consumption and saving time, but it is a mercury-containing color reagent that failed to protect the environment. However, specific metal ions that have been dissolved in the solution can lead to inaccurate measurements. To get rid of interference, it has been proposed that a controlled experiment should be carried out [37]. The ion-selective electrode is straightforward, rapid, and has a broad dynamic range for detection (0.01– 17, 000 ppm). During the experiment, you must maintain control of both the temperature and the stirring speed. Ion chromatography is notable for its high repeatability, precision, and low detection limitation of 3 × 10⁻⁷ mol/L. Because of the short retention time, electrolytes containing Li+ and Na+ are inappropriate, and organic electrolytes are also irrelevant [26]. Furthermore, the NH3 source for the catalyst responsible for the ENRR can only be identified by experiments involving the 15N2 isotope. To determine the number of products, employing at least two distinct detection techniques is recommended since this can yield more convincing results [38]. Moreover, Nafion membrane is frequently used for ENRR to separate NH3 from anode products. It has been found Nafion membrane can allow NH3 to travel through, be adsorbed, and even interact with the membrane [39]. This results in a measurement error and speeds up the membrane deterioration process, both of which are detrimental to NH3 quantification and long-term stability. In this case, using a salt bridge (saturated KCl) to replace Nafion membrane is demonstrated to be a feasible method. Besides, further research on membrane engineering is needed to solve this problem, which is essential to NH3 quantification and electrocatalyst evaluation.
Recent advances in ENRR toward NH3 have depended significantly on the theoretical and empirical development of novel types of electrolytes along with compatible electrocatalysts. In the recent past, several efforts have been made to increase the NH3 production rate and FE using different electrolytes under ambient conditions. Choosing an appropriate electrolyte is crucial in boosting the electrocatalysts performance for N2 reduction to NH3. The supporting electrolytes break down into charged ions during ionization, which scatters evenly throughout the solvent. When an electrochemical system is active, charged ions flow predictably, forming a conductive route with the external electron transfer circuit. The conductivity of the electrolytes is crucial for achieving charge equilibrium rapidly and reducing the resistance to charge transfer. N2 has very poor solubility in aqueous electrolytes (0.66 mmol/L at room temperature), resulting in insufficient reactants [37]. The solubility of N2 has a close relationship with the proton concentration in the electrolytes. Using a fixed saturated N2 concentration and different HCl concentrations, higher proton concentrations may reduce the N2 concentration near the catalyst surface [40]. Apart from the proton concentration, the concentrations of salt in the electrolyte have a notable impact on N2 solubility. At concentrations higher than 0.6 mol/L LiClO4, a decrease in N2 solubility and diffusivity is observed, as well as an increase in SEI conductivity as measured [41]. Therefore, there is animmediate need for an electrolyte with a high gas solubility to circumvent this limitation.
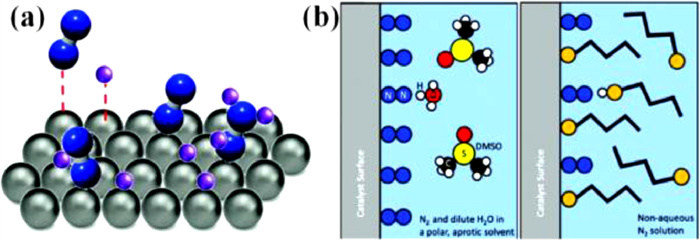
Moreover, the electrolyte serves as the source of the protons involved in the electrocatalytic reduction reaction. According to density functional theory (DFT) calculations and the findings, H atoms predominate the active site both thermodynamically and kinetically [42,43]. In this scenario, the competitive HER is mostly produced by the overstock of protons (Fig. 3a). Consequently, it is of considerable importance to manage the concentration of the protons or raise the proton transfer barrier to the surface of catalyst by adjusting the electrolyte (Fig. 3b). Overall, when improving the electrolysis performance based on the crucial roles of electrolytes, several electrolyte characteristics, such as gas solubility, ion conductivity, pH, and proton transfer rate, affect electrocatalyst activity and selectivity, must be taken into consideration.
Aqueous electrolytes feature low cost, environmental friendliness, excellent conductivity, and a large electrochemical working window, making it possible to carry out electrochemical reduction processes within a wide potential range [44]. Besides, it is simple to collect the necessary protons to create important intermediates such as NNH* in aqueous electrolytes (* denotes an active site on the surface of the electrocatalyst) [45]. Benefiting from these advantages, aqueous electrolytes have been extensively investigated in ENRR. Aqueous electrolytes are generally divided into alkaline, neutral, acidic, and water-in-salt (WiS) electrolytes. Moreover, Table 1 compares the electrochemical performance of catalysts in various types of aqueous and non-aqueous electrolytes [46–70]. The following will briefly introduce some representative works linked to these.
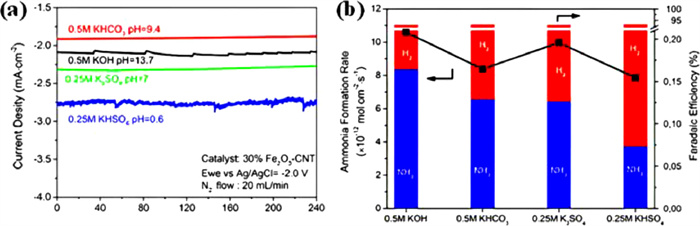
Alkaline electrolytes are widely used in ENRR due to their capability to suppress HER and promote selectivity toward NH3 formation. For instance, the evaluation of ENRR in 0.1 mol/L KOH and 0.1 mol/L HCl over CF-ZIF-1100–1 h catalyst shows that the NH3 yield is higher in a basic electrolyte than that of an acidic medium [71]. Besides, the NH3 production rate in an acidic medium drops with temperature, but it increases with the rise of temperature in 0.1 mol/L KOH. These findings indicate that higher proton concentration in acidic electrolytes significantly enhanced the HER, thus suppressing the ENRR. Chen et al. [72] investigated the effect of pH of electrolytes on the ENRR to produce NH3 over a 30% Fe2O3—CNT electrocatalyst at a constant potential. The rate of NH3 production is observed to be 1.06 × 10⁻¹¹ mol cm−2 s−1 in 0.5 mol/L KOH, which is higher than the rate of NH3 production achieved in 0.25 mol/L KHSO4 electrolyte (Fig. 4). It is believed that the transfer of H2O is the determining factor of the production rate of NH3 in alkaline ENRR. Herein, the ENRR requires a careful pH adjustment of the electrolyte environment to achieve desired results.
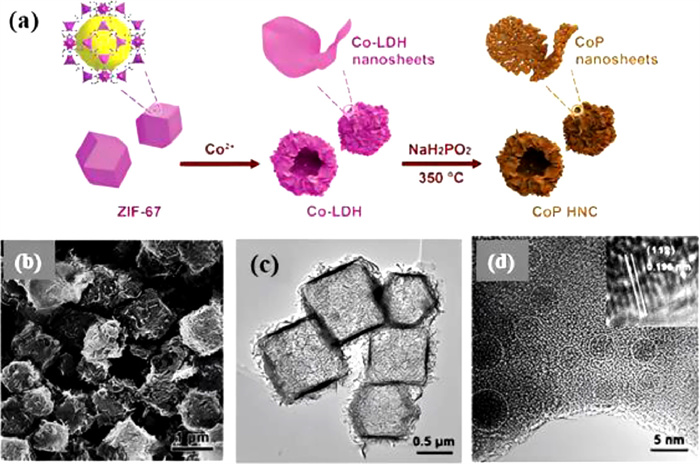
To enhance the alkaline ENRR performance, Guo et al. developed a ZIF-67-derived CoP hollow nanocage (CoP HNC) as an electrocatalyst with 1.0 mol/L KOH solution (pH 14, Fig. 5) as the electrolyte [73]. The CoP HNC catalyst with a structure of 3D hierarchical of nanoparticles, nanosheets, and nanocage provides a surface with rich active sites. It exhibited a high FE of 7.36% at 0 V vs. RHE, and the rate of NH3 yield improved exponentially without hydrazine. It reached 10.78 µg mgcat.−1 h−1 at −0.4 V vs. RHE. Ma et al. [74] attained a high NH3 yield of 45.7 g mgcat.−1 h−1 in 0.1 mol/L KOH (pH 13) with 3D unalloyed nanoporous Au as the extremely efficient and durable electrocatalyst. It was believed that the numerous surface steps and bends on the Au ligament surface of NPG were the N2 reduction's active sites, making it an efficient catalyst for ENRR with a FE as high as 3.41%.
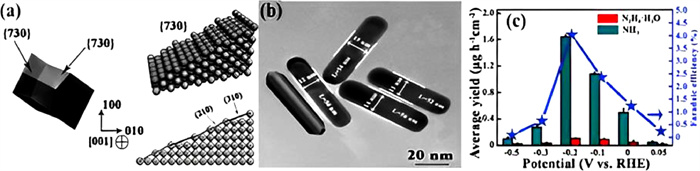
Bao et al. used the seeded growth method to produce tetrahexahedral Au nanorods with a stepped (730) face and a multi-step face composed of (210) and (310) sub-faces for ENRR in 0.1 mol/L KOH electrolyte (Figs. 6a and b) [70]. The maximal rate of NH3 production and FE were 1.648 g h−1 cm−2 and 3.879%, respectively. Meanwhile, hydrazine hydrate was produced to be 0.102 g h−1 cm−2. NH3 production rate and FE reduce considerably as HER dominates the electrode reaction when the potential is lower than −0.2 V vs. RHE (Fig. 6c). The significant number of high-index (310) and (210) facets exposed on the catalysts, which provide considerable active sites for N2 reduction, was respond for the extraordinarily high activity of Au nanorods. According to DFT calculations, N2 electroreduction on Au nanorods followed an associative alternating pathway rather than an associative distal pathway, as evidenced by the concurrent synthesis of hydrazine of NH3. Mukherjee et al. [71] performed ENRR using ZIF-8-derived N-doped and defect-rich nanoporous carbon as an electrocatalyst prepared by one-step thermal activation. At benign temperature conditions, the as-prepared electrocatalyst reveals a remarkable rate of NH3 synthesis and FE of 3.4 × 10⁻⁶ mol cm−2 h−1 and 10.2%, respectively, using alkaline electrolyte. The N-doped nanoporous carbon electrocatalyst also demonstrated excellent stability for a continuous test of 18 h with a constant rate of NH3 production. Further, the catalytic activity of N-doped nanoporous carbon with Fe doping was investigated. The rate of NH3 production was significantly decreased, as the Fe doping blocked the active sites of the electrocatalyst and facilitated HER.
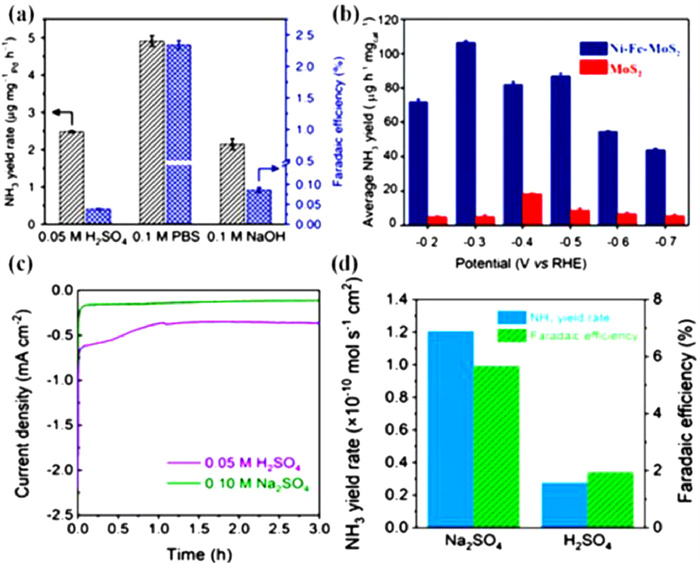
The method of ENRR is greatly desired in neutral electrolytes in light of averting corrosion issues in both acidic and alkaline electrolytes. Moreover, neutral electrolytes with lower proton concentrations can be applied quickly and easily to reduce the competition from HER by lowering the coverage of *H, thus improving electrocatalytic selectivity. The ENRR activity in acidic and neutral electrolytes were investigated using Au catalyst [65,75]. The catalytic activity decreases at potentials greater than −0.5 V vs. RHE in both acidic and neutral electrolytes. Theoretically, the presence of plentiful protons in acidic electrolytes would cause a large amount of *H to cover the metals that prevent *N2 adsorption, whereas the presence of protons in neutral electrolytes might increase the activity of ENRR on those metals. Consequently, the current densities, NH3 production, and FEs vary with the different pH values of electrolytes over Pd/C electrocatalyst and operate best in phosphate buffer solution (PBS) of neutral pH (Fig. 7a) [76]. An NH3 production rate of ~4.5 µg mg−1 h−1 and FE of 8.2% were achieved at −0.1 V vs. RHE. Mukherjee et al. [77] used three electrolytes, including 0.01 mol/L HCl with pH 1, 0.5 mol/L LiClO4 with pH 8, and 0.1 mol/L KOH with pH 13, to compare their catalytic activity for ENRR. The optimal NH3 production is 115 mg cm−2 h−1 in a neutral medium, and the maximum FE is 18.5% for the atomic Ni site on N-doped carbon. Wu et al. analyzed the most recent findings and developments in Fe-based catalysts for N2 reduction processes and found that these are well-suited for NH3 production, especially in the presence of neutral electrolytes at lower potentials [78,79]. Liu et al. [80] reported a FE of 18.6% ± 0.8% and an NH3 yield rate of 62.9 ± 2.7 µg h−1 mg−1 were produced using a Fe single-atom catalyst for ENRR in 0.1 mol/L PBS electrolyte. Hu et al. [81] employed Fe/Fe3O4 catalyst for ENRR and attained a maximum 0.19 µg cm−2 h−1 of NH3 production rate with an 8.29% of FE at −0.3 V vs. RHE in 0.1 mol/L PBS electrolyte (pH 7.2). Chen et al. successfully created NiFe-MoS2 nanocubes (NiFe@MoS2 NCs) as a catalyst and evaluated their ENRR performance by adopting an electrolyte of 0.1 mol/L Na2SO4 solution [82]. Excellent electrocatalytic performances due to trimetallic synergistic interactions and the hollow NC structure with a high NH3 yield rate\break (128.17 µg h−1 mg−1) and FE (11.34%) are obtained at a temperature of 40 ℃, at −0.3 V vs. RHE (Fig. 7b). To investigate the impact of H+ concentration on ENRR performance, Li et al. examined the current density, NH3 yield rate, and FE in 0.05 mol/L H2SO4 and 0.1 mol/L Na2SO4 electrolytes [83]. Particularly the cathodic current density at negative potentials, is significantly higher in Ar-saturated 0.05 mol/L H2SO4 aqueous solution than in Ar-saturated 0.1 mol/L Na2SO4 aqueous solution, indicating the active HER in acidic electrolytes. As shown in Fig. 7c, similar patterns may be seen in the chronoamperometry test at −0.45 V. Lastly, the NH3 yield rate as well as FE are much larger in 0.1 mol/L Na2SO4 than those in 0.05 mol/L H2SO4 electrolyte (Fig. 7d). Yu et al. [84] reported a FE of 42.68% and an NH3 yield rate of 13.09 µg h−1 mg−1 using a Sn-based electrocatalysts for ENRR in 0.1 mol/L Na2SO4 electrolyte at −0.2 V vs. RHE. Zheng et al. designed a series of dual metal single atom catalysts containing adjacent M-N-C dual active centers to uncover the structure-activity relationship through combined theoretical and experimental study [85]. The catalyst revealed promising ENRR activity with the limiting potential of −0.64 ~0.62 V in aqueous electrolyte. As an effective electrocatalyst for ENRR to NH3, a hybrid of TiO2 and juncus effusus-derived carbon microtubes with a three-dimensional cross-linked hollow tubular structure is presented, which provides a significant NH3 yield of 20.03 µg h−1 mgcat.−1 and a high FE of 10.76% at −0.50 V vs. RHE, as well as greater electrochemical and structural durability in 0.1 mol/L Na2SO4 [86].
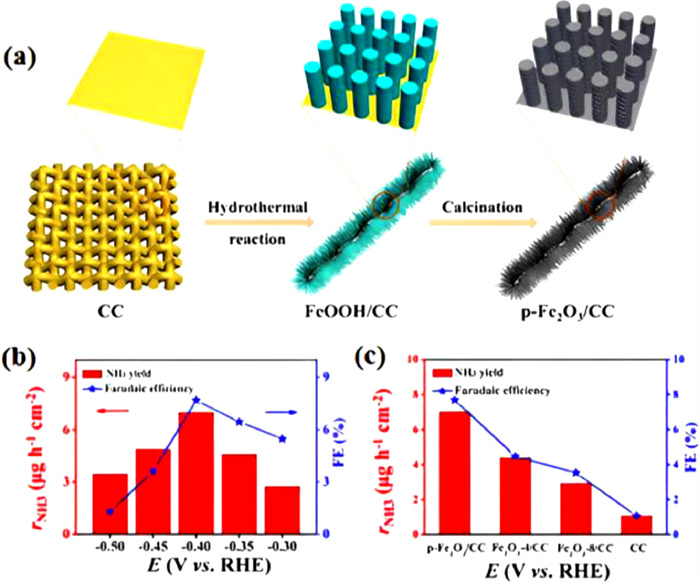
By engineering efficient electrocatalysts, the ENRR performance in natural electrolytes can be significantly enhanced. Fe2O3 nanorods with porous nature on carbon cloth (p-Fe2O3/CC) were created by Wang et al. [87] using the hydrothermal technique and high-temperature calcination (Fig. 8a). The binder-free porous structure of p-Fe2O3/CC exhibits active sites in large numbers and available open channels for N2 adsorption, contributing to the reduction of NH3. As a result, the p-Fe2O3/CC catalyst presents excellent stability, with a maximal NH3 production rate of 13.56 µg mgcat.−1 h−1 and a FE of 7.69% in 0.1 mol/L Na2SO4 (Fig. 8b). Moreover, the highest NH3 production rate and FE were achieved over p-Fe2O3/CC catalyst with a hydrothermal time of 6 h. The high efficiency of p-Fe2O3/CC was ascribed to its higher value of double layer capacitance, which offers a larger electrochemical active surface area and exposes active sites for N2 reaction (Fig. 8c).
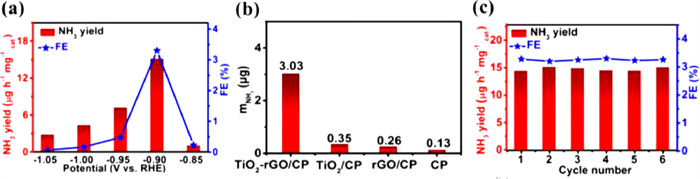
Zhang et al. [46] synthesized TiO2/Ti catalyst using a hydrothermal method, and achieved a maximum NH3 production rate of 9.16 × 10⁻¹¹ mol s−1 cm−2 in 0.1 mol/L Na2SO4 electrolyte, which is superior to most reported electrocatalysts for ENRR (Table 1). The highest FE of TiO2/Ti electrocatalyst for NH3 production was obtained to be 3.34% at −0.6 V and reduced to 2.50% at −0.7 V due to the competing HER. Zhang et al. [50] loaded TiO2-reduced graphene oxide (rGO) on carbon paper (CP) to prepare TiO2-rGO/CP electrocatalyst for the ENRR to NH3. The TiO2-rGO/CP electrocatalyst revealed a maximum rate of NH3 production (15.13 µg mgcat.−1 h−1) and high FE (3.3%) in 0.1 mol/L Na2SO4 at −0.90 V vs. RHE. The NH3 yield rate was also compared with CP, rGO/CP, TiO2/CP, and TiO2-rGO/CP electrocatalyst (Figs. 9a and b). A negligible performance of the CP as an electrocatalyst is observed, and the performance of the TiO2-rGO/CP was superior to those of the TiO2/CP and rGO/CP electrocatalysts. The superior performance is attributed to the well-dispersed TiO2 nanoparticles over rGO, which provides maximum exposure of active sites for N2 adsorption and reduction to NH3. Furthermore, the NH3 production rate and FE maintain for six successive recycling tests at −0.9 V, indicating the good electrochemical stability of the TiO2-rGO/CP electrocatalyst (Fig. 9c).
Zhang et al. developed MnO nanoparticles on a Ti mesh (MnO/Ti) for natural ENRR and achieved a very high NH3 production rate of 1.11 × 10⁻¹⁰ mol s−1 cm−2 and FE of 8.02% in 0.1 mol/L Na2SO4 at −0.39 V vs. RHE [47]. After ten repeated cycles, no loss of NH3 production rate, and FE are observed at −0.39 V, suggesting outstanding electrochemical stability. DFT calculations demonstrate low adsorption energy of N on the Mn atom than that of H on the O atom of the MnO (200) surface, indicating the high selectivity of MnO/Ti catalyst for N2. Multi-shelled hollow Cr2O3 microspheres (MHCMs) served as useful electrocatalysts for ENRR to NH3 [49]. The highest value of NH3 production rate by MHCMs electrocatalysts is 25.3 g mgcat.−1 h−1 with a FE of 6.78% in 0.1 mol/L Na2SO4. DFT calculations were executed to understand the mechanism on the MHCMs electrocatalyst surface for ENRR. The calculations and results suggest that the first N2 adsorbed on the Cr3+ species of MHCMs, followed by the hydrogenation, took place by (H + e−) pair addition. Thus, both partially alternative routes and distal associative are involved during the ENRR over the MHCMs electrocatalysts. To improve the ENRR performance in natural aqueous electrolytes, Li et al. [88] hydrothermally synthesized Y2O3 nanosheets. The NH3 production rate and FE are attained to be 1.06 × 10⁻¹⁰ mol s−1 cm−2 and 2.53%, respectively, in 0.1 mol/L Na2SO4 aqueous solution utilizing Y2O3 nanosheets at −0.9 V vs. RHE. DFT simulations show that the *N2 hydrogenation to generate *N2H is the potential deciding step of the reaction. Song et al. [89] used the chemical vapor deposition method to synthesize N-doped carbon nano-spikes (CNS) as an effective electrocatalyst for ENRR to NH3. Using CNS electrocatalyst, the maximum NH3 production rate (97.18 µg h−1 cm−2) and FE (11.56%) are obtained at −1.19 V vs. RHE in 0.25 mol/L LiClO4. The remarkable electrocatalytic activity of CNS catalyst for ENRR is ascribed to its sharp tip texture that amplifies the strong electric field and significantly affects molecular orbital energy levels in N2.
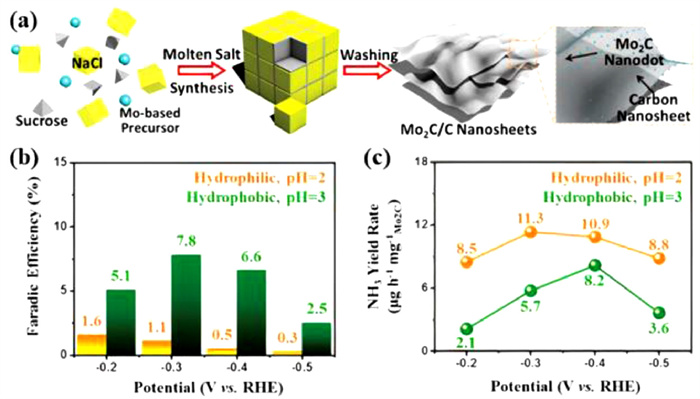
Typically, acidic electrolytes exhibit a higher solubility of N2 compared to alkaline and natural media [90]. Nevertheless, HER often dominates the electrochemical process due to the adequate supply of protons. Therefore, the acidic ENRR performance can be efficiently adjusted by regulating the mass transfer of protons. For instance, Cheng et al. [91] used molten salt synthesis and fabricated Mo2C/C catalyst by embedding Mo2C nanodots on ultra-thin carbon nanosheets with a particle size of 2–3 nm (Figs. 10a). Figs. 10b and c show the activity of N2 reduction over Mo2C/C catalyst supported on hydrophilic CC as well as hydrophobic CC in aqueous solutions of 0.5 mol/L Li2SO4 with pH of 2 and 3. It is anticipated that hydrophobic CC and an electrolyte with a higher pH value are thought to reduce HER by limiting the number of protons available at the electrode surface, hence boosting FE. The results of the experiments corroborated with this theory show that when the accessibility of protons decreased, the highest FE increases from 1.6% to 7.8%. Yet, higher FEs are met with lower NH3 formation rates. This suggests that while severe HER suppression can increase faradic efficiency, more is needed to accomplish a high NH3 generation rate. These results illustrate the challenges to establish a high NH3 production rate and FE at an electrode surface. Han et al. obtain the highest NH3 production rate of 4.80 × 10⁻¹⁰ mol s−1 cm−2 and FE of 0.8% at −0.50 V vs. RHE in 0.1 mol/L HCl with MoO3 nanosheets as electrocatalysts [63,92]. Besides, Excellent performance in the ENRR to NH3 on Nb2O5 nanofibers was reported, and a maximum NH3 production rate of 43.6 µg mgcat.−1 h−1 and FE of 9.26% at −0.55 V vs. RHE in 0.1 mol/L HCl is attained. DFT simulations show that the surface Nb-edge atoms of Nb2O5 (181) are responsible for polarizing and activating N2 molecules, which is necessary for their reduction to NH3.
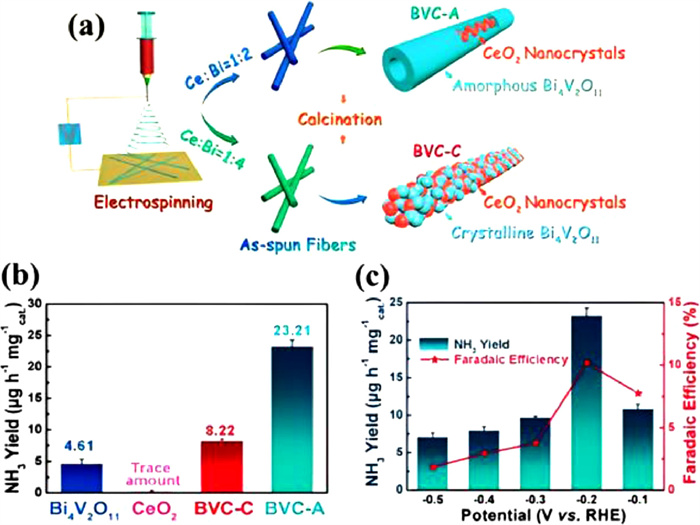
To improve the performance of acidic ENRR, Du et al. [64] reported the Cr2O3 nanofiber as the catalyst for N2 reduction. The Cr2O3 nanofiber reached a high production rate of 28.13 µg mgcat.−1 h−1 and FE of 8.56% in 0.1 mol/L HCl at −0.7 V vs. RHE with strong electrochemical durability after six cycles during electrolysis. Lv et al. [60] used electrospinning followed by calcination in the air to prepare a Bi4V2O11/CeO2 hybrid catalyst for ENRR to NH3 under benign conditions. The molar ratio of Ce and Bi can affect the crystallinity of Bi4V2O11 in a hybrid catalyst profoundly. The obtained Bi4V2O11/CeO2 hybrid with an amorphous phase (BVC-A) hybrid catalyst exhibited crystalline CeO2 and amorphous Bi4V2O11 when the molar ratio of Bi and Ce was 2:1 (Fig. 11a). The BVC-A hybrid catalyst outperformed in terms of NH3 production rate than Bi4V2O11/CeO2 hybrid with a crystal phase (BVC-C) with the Bi and Ce molar ratio of 4:1, Bi4V2O11, and CeO2 (Fig. 11b). In 0.1 mol/L HCl, a maximum NH3 generation rate of 23.32 µg mgcat.−1 h−1 and a FE of 10.16% are achieved with the BVC-A hybrid catalyst (Fig. 11c). The inclusion of amorphous Bi4V2O11 species, which can offer abundant faulty sites and a low energy barrier for N2 reduction to NH3, is credited with the outstanding performance of the BVC-A hybrid catalyst.
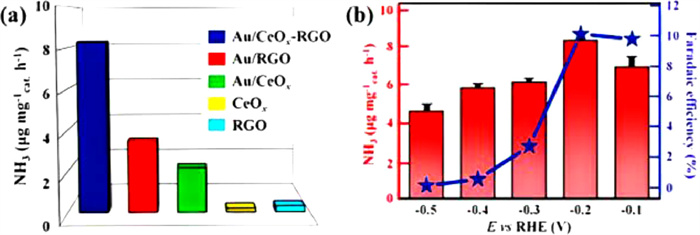
By thermal nitriding in an NH3 flow environment, Zhang et al. [93] created VN nanosheet arrays on a Ti grid (VN/TM) and VN nanowire arrays on CC (VN/CC). In N2-saturated 0.1 mol/L HCl, an NH3 production rate of 8.40 × 10⁻¹¹ mol s−1 cm−2 with a corresponding FE of 2.25% is realized at −0.50 V vs. RHE. Additionally, the catalyst maintains a steady voltage of −0.50 V vs. RHE during recycling. Zhang et al. sythesized an array of MoN nanosheets on carbon fabric (MoN/CC) and similarly used a method similar to that of VN nanostructures [67]. Ren et al. used a N2-saturated 0.1 mol/L HCl electrolyte and investigated the Mo2N nanorods as an electrocatalyst to obtain an NH3 production rate of 78.4 µg mgcat.−1 h−1 and FE of 4.5% for N2 reduction at −0.3 V vs. RHE [58]. The Mars Van Krevelen mechanism is responsible for the N2 reduction over the Mo2N catalyst. Li et al. [66] used the facile co-reduction method to deposit Au and CeOx nanoparticles on RGO (Au/CeOx-RGO) for ERNN. Au nanoparticles amorphous formation is observed, having a particle size of ~5 nm. Compared with Au/CeOx and Au/RGO, Au/CeOx-RGO electrocatalyst is a more efficient catalyst in acidic ENRR (Fig. 12a). Its superior performance is attributed to amorphous Au nanoparticles on the substrate having abundant unsaturated coordination sites. The maximum NH3 synthesis rate of 8.3 µg mgcat.−1 h−1 and FE of 10.10% are obtained using Au/CeOx-RGO catalyst having 1.31 wt% loading of Au at −0.2 V vs. RHE in 0.1 mol/L HCl. A noteworthy decline in the rate of NH3 production, as well as the FE, are observed due to the HER at higher negative potentials (Fig. 12b).
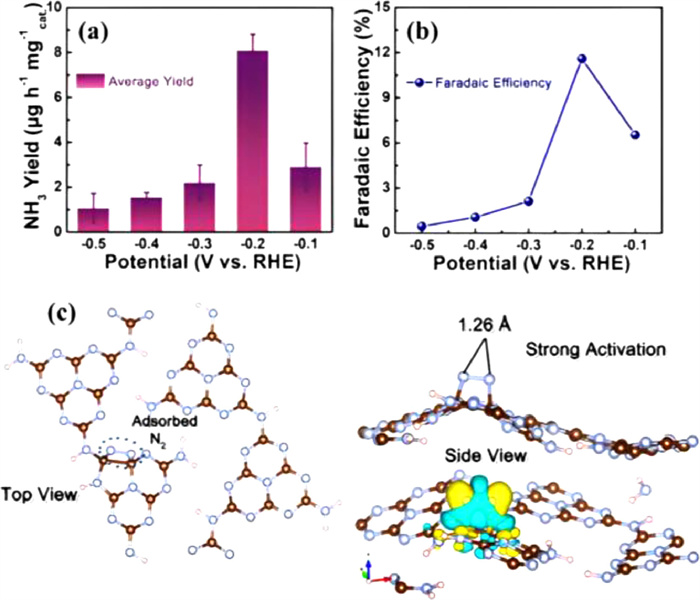
Liu et al. [61] used the same approach to formulate an electrocatalyst composed of ZIF-8 derived N-doped nanoporous carbon and 0.05 mol/L H2SO4 electrolyte to achieve a maximum NH3 production rate (2.6 × 10⁻¹⁰ mol s−1 cm−2) as well as FE (0.9%) at −1.1 V vs. RHE. Under optimal conditions, Cu3P nanoribbon is developed as a highly effective electrocatalyst for the conversion of N2 to NH3. Such Cu3P nanoribbon exhibits remarkable FE up to 37.8% and a significant yield of 18.9 µg h−1mgcat.−1 at −0.2 V when measured in N2-saturated 0.1 mol/L HCl [94]. Chen et al. fabricated plasma-etched Ti2O3 with oxygen vacancies which presents outstanding N2 fixation performances with the maximum NH3 yield and FE of up to 37.24 µg h−1 mgcat.−1 and 19.29%, respectively in 0.1 mol/L HCl [95]. Ti2O3 nanoparticles function effectively as a pure Ti3+ system for NH3 electrosynthesis. According to the investigation, the Ti3+ ions serve as the primary catalytically active sites and considerably boost ENRR activity. In an acidic electrolyte, Ti2O3 performs exceptionally well with high NH3 yield and FE, outperforming the majority of titanium-based catalysts previously reported [96]. Lv et al. [97] also used the thermal treatment method and fabricated polymeric carbon nitride (PCN) for ENRR. The PCN catalyst reveals excellent electrocatalytic efficiency with an NH3 synthesis rate of 8.09 µg mgcat.−1 h−1 and FE of 11.59% in 0.1 mol/L HCl electrolyte (Figs. 13a and b). DFT calculations suggest that the N-vacancy of the PCN catalyst is the active site for N2 molecule, which dramatically increases the N2 bond length from 1.10 Å (for free N2 molecule) to 1.26 Å due to the electrons transfer between adsorbed N2 and adjacent carbon atoms (Fig. 13c). This N2 bond length falls between diazene (1.20 Å) and hydrazine (1.47 Å) and facilitates the reduction of N2 into NH3.
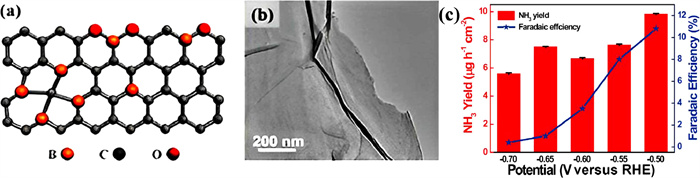
Yu et al. [98] performed a thermal reduction to yield a boron-doped graphene electrocatalyst. The graphene framework retains its conjugated planar structure and sp2 hybridization but induces electron deficiency by doping boron atoms (Figs. 14a and b). The boron being positively charged atoms not only offers active sites for N2 adsorption but also prohibits the binding of protons, resulting in an outstanding electrocatalytic performance and high FE for N2 reduction to NH3. According to DFT calculation, the BC3 structure of boron-doped graphene reveals the lowest energy barrier between the various boron doping positions such as B4C, BC3, BC2O, and BCO2 and is beneficial for N2 adsorption and its reduction to NH3. The boron-doped graphene having 6.2% boron concentration shows a maximum NH3 production rate of 9.8 µg h−1 cm−2 and FE of 10.8% in 0.05 mol/L H2SO4 electrolyte at −0.5 V vs. RHE under benign conditions (Fig. 14c).
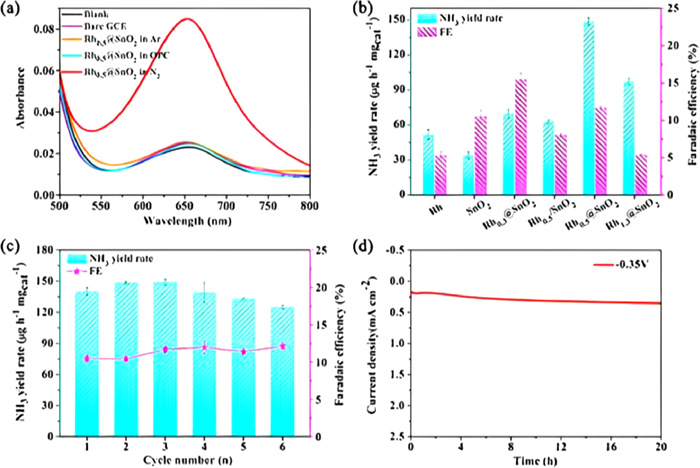
Through interfacial engineering approach, Rh atomic layer-coated SnO2 hetero-structured catalyst was rationally designed with the maximum NH3 yield rate (149 µg mgcat.−1 h−1) and FE (11.69%) in 0.05 mol/L H2SO4 electrolyte (Fig. 15) [99]. According to DFT and X-ray absorption spectra calculations, the SnO2 heterostructure and the Rh atomic layer exhibit strong electron interactions, efficiently controlling the interfacial electron transfer and d-band center. The adsorption energy of H is significantly lowered, and the reaction kinetics for N2 reduction is dramatically expedited as a result of the downshift of the d-band center. By reducing H adsorption and further enhancing the electrocatalytic N2 reduction, this work offers unique insight into the regulation of interfacial electrons.
WiS, as a novel type of electrolyte, has extremely high salt concentrations and have been explored for boosting the efficiency of ENRR. Two benefits would be anticipated from such a system. First, the high quantity of salt has a substantial solvation effect, locking down water molecules, reducing the amount of free water available, and effectively suppressing HER [100,101]. Also, the WiS electrolyte provides a chance to fine-tune the H2O concentration for electrokinetic studies of ENRR, a parameter that is previously challenging to change but crucial to understanding the intricate mechanisms. It also has safety benefits and low toxicity.
It should be noted that WiS electrolytes can increase the electrochemical stability window to over 3.0 V, which could overcome the restricted electrochemical windows of HER/OER for conventional aqueous electrolytes [102,103]. As a result, WiS electrolyte is a desirable choice for ENRR research in the future. Wu et al. recently described an NH3 production method with 20 mol/L lithium bis(trifluoromethanesulfonyl)imide (LiTFSI) as a super-concentrated WiS system. As the catalyst for ENRR, oxygen vacancy-rich TiO2 loaded with Au nanoparticles was used. A high FE of 37.2% and NH3 yield of 20.3 µg h−1 cm−2 were achieved at −0.4 V vs. RHE. According to theoretical calculations, the H2O molecules are effectively stopped from accessing the catalytic surface by the extremely concentrated LiTFSI salt solution, which deactivates them by intense ionic contact. Hence, in this WiS electrolyte, the energy barrier for the HER is raised, and the H2O diffusion is severely constrained. Since the current density and the onset potential decrease drastically due to the unique action of the WiS electrolyte, the HER is severely slowed down [104].
Similarly, Wang et al. carried out ENRR in highly concentrated LiCl electrolytes. This proof-of-concept system accomplishes a high FE of 71.9% even when utilizing a metal-free electrocatalyst. They believed the effectiveness of H2O as both a proton source and a solvent is severely hampered by establishing a hydration shell caused by the solute ions of highly concentrated electrolytes' significant attraction for the nearby H2O molecules. Hence, a significant N2 flux and an effective inhibition of the HER occur at the reaction interface, enhancing activity and selectivity during the following reduction phase [105]. Chu et al. evaluated the ENRR performances in various concentrations of LiClO4 WiS electrolytes and obtained a good FE of 62.5% and NH3 production of 181.3 µg h−1 mg−1 in 12 mol/L LiClO4 WiS electrolytes. They discovered that the water molecules are slowed down by being encased in solvation sheaths as the electrolyte concentration was raised, effectively blocking the HER. The decline in N2 affinity on the catalyst surface is caused by the extremely low diffusion rate at extremely high concentrations, which limits the movement of N2 to the catalyst surface. Meanwhile, WiS can support transfer electrons to antibonding orbitals of N2 molecules favorably and promote N2 activation, as shown in XPS studies. As a result, the WiS system effectively promotes ENRR activity and selectivity [106].
Aqueous electrolytes are generally the most popular choice for N2 reduction reactions due to their ease of production, low cost, and minimal toxicity. ENRR has demonstrated an astonishing advance by effectively selecting suitable aqueous electrolytes. The previous literatures have reviewed that acidic electrolytes are generally more favorable for ENRR in terms of selectivity and activity compared to alkaline and neutral solutions. This may be ascribed to two reasons. First, in acidic electrolytes, the solubility of N2 is generally higher than those in alkaline and natural solutions. Besides, as the rate-determining step for ENRR is the formation of *N2H through a PCET process, acidic electrolyte may be beneficial for ENRR if the electrocatalysts are designed to has weak adsorption of H species. Therefore, more efforts can be devoted to acidic ENRR. However, the comparatively poor N2 solubility in the aqueous phase, even in acidic electrolytes, continues to impede the advancement of ENRR. In addition, the lower FE for ENRR resulting from the unavoidable HER side reactions are still far from satisfactory. Hence, there is still a need of further advancement in each category of aqueous electrolyte in terms of solubility of N2. Besides, it is also crucial to develop alternative techniques or optimize the catalysts to offset the disadvantage of aqueous electrolytes by combining the HER suppression techniques [32,78,107,108].
Since non-aqueous electrolytes have much lower water content than aqueous electrolytes and are good options considering that many protons would be unfavorable for the required reactions. Moreover, N2 is far more soluble in non-aqueous solutions than in aqueous solutions [90]. Interestingly, alternative reaction pathways to promote ENRR are possible in non-aqueous electrolytes [109]. As a result, non-aqueous electrolyte research has great potential and receives great interest. Three categories of non-aqueous electrolytes have been established by their varied chemical compositions: organic electrolytes, ILs, and mixed water-organic electrolytes. Table 2 compares the electrochemical performance of catalysts in various types of non-aqueous electrolytes [110–116]. These will be introduced as follows.
Organic electrolytes have received extensive attention in electrocatalysis. As mentioned above, to slow down HER, we can either raise the proton transfer barrier to the catalyst surface or lower the concentration of proton in the bulk solution [36].
For example, the HER is suppressed by employing DMF to reduce proton donors [117], and a protective layer to prevent transport of proton in the context of electrocatalysis for the production and consumption of fuels [118]. In addition, the chemical structure of proton donor substantially affects the HER activity in acetonitrile. With the donor, tetraethylammonium hydroxide (TEAH+), which is less bulky, exhibits higher HER activity at all observed potentials than the bulkier donor, N,N-diisopropylethylamine (protonated) (DIPEAH+) [119]. Hence, organic electrolytes offer essential approaches to regulating the transfer of both electrons and protons. Gorodisky et al. [120]. reported the Ti(OH)3−Mo(Ⅲ) system for catalytic N2 reduction. It has been suggested that clusters of Ti(Ⅲ) and Mo(Ⅲ) hydroxides must have adhered to the cathode, which forms a complex with Mo(Ⅲ) for electrons to move from the anode to the N2 molecule at a suitable negative potential. However, a more precise mechanism is still unknown. The highest NH3 and N2H4 yields are observed when the electrolyte contains up to 3% water, indicating that water is also important for NH3 synthesis. Lee et al. [116] employed a solvent mixture of ethanol and 0.2 mol/L lithium trifluoromethanesulfonate (LiCF3SO4) in tetrahydrofuran as the electrolyte to increase the selectivity of NH3 under ambient conditions, in which ethanol is used as the proton source. Ag NCs were first positioned on an Au electrode and then covered in a superhydrophobic ZIF layer to produce the ZIF/Ag-Au electrocatalyst. The super-hydrophobic ZIF is employed to stop water molecules from getting to catalyst surface. The ZIF with strong gas adsorptive ability is used to concentrate the catalyst surface with reactant molecules and N2. The ZIF/Ag-Au electrocatalyst enhances N2 adsorption, promotes the ENRR, and blocks the competing HER. The NH3 production rate and FE of the ZIF/Ag-Au electrode superior to those of the Ag-Au electrode. Remarkably, the Ag-Au@ZIF electrocatalyst achieves a FE of 18% ± 4% when converting N2 to NH3 electrochemically.
Organic electrolytes are the most widely studied for the Li-mediated ENRR process. Li metal and N2 combine to form Li3N at room temperature, as is well known. After that, Li3N produces NH3 as a result of a reaction with water and ethanol as proton sources. Li may be used in the ENRR to NH3 as a catalyst, as the initial potential for HER is substantially larger than that for reducing Li+ to Li. Li metal very quickly reacts with water to form H2, and therefore this process cannot be used in aqueous solutions. As a result, aprotic solvents are frequently employed in this reaction. One of the earliest demonstrations was provided by Tsuneto et al. [121] using Zn, Ag, Cu, Ni, Co, Fe, Mo, Ti, Pb, and Al as cathode materials and THF solution (0.18 mol/L ethanol and 0.2 mol/L LiClO4) as electrolyte for ENRR in a electrochemical cell with single-compartment having a metal cathode and a Pt anode. With respective values of 8.2% and 8.4% for the production of NH3 when N2 was present as atmospheric pressure, the highest FE was offered by Ti and Ag among them. When the electrolysis was carried out without adding ethanol to the electrolyte or when Ar was used as the working medium, controlled investigations revealed that only a trace amount of NH3 was produced. Additionally, the amount of NH3 production was insignificant when water replaced ethanol as the electrolyte or NaClO4, or Bu4NClO4 replaced LiClO4. Ma et al. [122] described a rechargeable Li-N battery based on the reaction of Li and N2 that utilized a Li-foil anode, a CC cathode, an ether-based electrolyte comprising 1 mol/L LiCF3SO3, and a glass fiber separator. When N2 molecules mix with Li+ at the cathode during discharge, Li-containing discharge products (mainly Li3N) are formed; these discharge products break down during charging. NH3 is formed when the discharge products are hydrolyzed, and the best FE for NH3 production is 59%.
ILs are suitable nonaqueous electrolytes for the ENRR due to their high solubility of N2 and low water content. Zhou et al. used two different ILs ([C4mpyr][eFAP] and [P6,6,6,14][eFAP]) to study the performance of ENRR over Fe deposited F-doped SnO2 glass, Fe deposited nickel foam, and Fe deposited stainless steel cloth [111,123]. The lack of N atoms in [P6,6,6,14][eFAP] IL makes it possible to rule out IL as a N source. The ILs contain only 100 ppm of water, which serves as the sole source of protons for the ENRR. All systems obtain a minimum NH3 generation rate of 2.9 mg h−1 m−2 and a 60% FE (Figs. 16a–c). Suryanto et al. employed carbon fiber paper with α-Fe nanorods as electrodes, and they produced NH3 by reacting an aprotic fluorinated solvent with an IL [70]. The electrode material was produced hydrothermally by β-FeOOH growth on carbon fiber paper, which was then transformed into α-Fe by annealing in the presence of a steady flow of H2. A thin Fe2O3 layer of ~5 nm thickness is formed on the surface of α-Fe because of exposure to air oxygen. Applying a negative voltage will electrochemically decrease this layer to the active α-Fe surface. Because it has a high N2 solubility, the authors of this work utilized the aprotic fluorinated solvent 1H,1H,5H-octauoropentyl-1,1,2,2-tetrafluoroethyl ether (FPEE) to control the delivery of protons to the electrode. These solvents, however, typically have poor solubility when it comes to salts that are frequently utilized in aprotic electrolyte media. As a supporting electrolyte, [C4mpyr][eFAP], a strongly fluorinated IL, was used to solve this issue. In these tests, the electrolyte's water content was 106 ppm. It was discovered that the ideal applied potential is −0.65 V vs. NHE and IL mole fraction is 0.23. Under these conditions, the NH3 formation rate and FE reach 1.58 × 10⁻¹¹ mol s−1 cm−2 and 23.8%, respectively. These values increase to 2.35 × 10⁻¹¹ mol s−1 cm−2 and 32% when the water content in the electrolyte reached 114 ppm; however, both values decrease as the water concentration increased (Figs. 16d and e) [110].
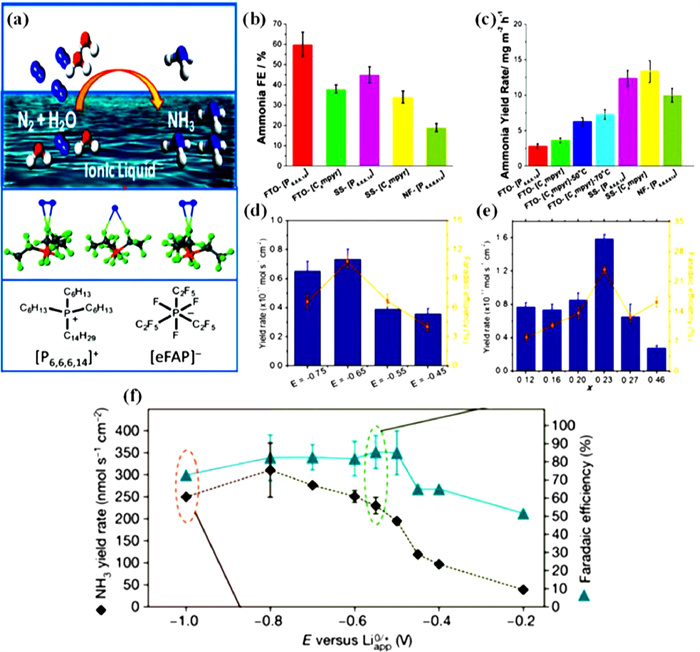
Hoang-Long et al. presented a high-efficiency, reliable technique made possible by compacting ionic stacking at the electrode-electrolyte interface [124]. A high concentration of imide-based Li salt is used as the electrolyte to create the interface, which prevents electrolyte breakdown and promotes steady N2 reduction (Fig. 16f). Consequently, stabilized NH3 yield rates of 150 ± 20 nmol s−1 cm−2 and NH3 conversion efficiencies near 100% are acquired. This research emphasized the connection between the physicochemical characteristics of the electrode-electrolyte interface and the ENRR performance, which could serve as a roadmap for creating a reliable and highly efficient method for NH3 production.
A mixture of water and organic solvents was often used as an electrolyte for ENRR, which can also reduce the competition from HER and boost the solubility of N2 in the electrolyte. The NH3 production rate increases initially as the proton donor concentration is increased from 0.015 mol/L to 0.03 mol/L but decreases when the concentration is increased to 0.06 mol/L in a methanol/LiClO4/H+ solution on a Pt-plate coated with a polyaniline film. After electrolysis, a maximum concentration of 57 µmol/L is produced with a maximum current efficiency of 16% [112]. Recently, Ren et al. [115] proposed a high-efficiency electrode-electrolyte interface engineering strategy to promote ENRR by adopting an innovative alcohol-water electrolyte system. This new-type mixed alcohol-water electrolyte was found possessing the ability to control the proton-donating ability and adjust the microenvironment at the electrode-electrolyte interface, thus significantly suppressing the competitive HER and enhancing the selectivity and reaction rate for NH3 generation. As a result, using the methanol-water electrolyte system, a distinguished FE of 75.9% ± 4.1% and a record high NH3 yield rate of 262.5 ± 7.3 µg h−1 mgcat.−1 were achieved on the FeOOH nanospindles anchored on CNTs (FeOOH/CNTs) catalyst, further demonstrating its superiority for ENRR.
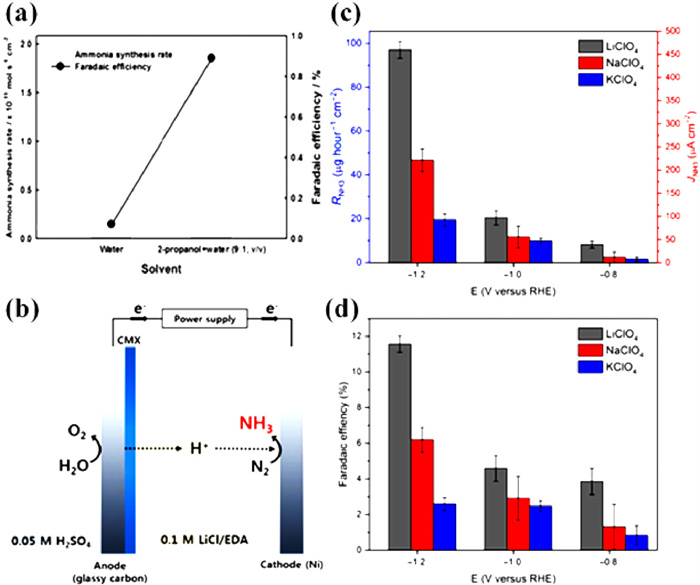
A workable strategy to improve ENRR selectivity is to limit the proton donor concentration. Kim et al. utilized a mixture of 2-propanol and water (9:1, v/v) as an electrolyte and observed that 2-propanol better suppressed HER and dissolved more N2 than pure water for ENRR [113]. The mixed electrolyte (2-propanol and water) reveals a high FE of 0.98% compared to 0.07% in pure water (Fig. 17a). Kim et al. [114] employed 0.05 mol/L H2SO4 as the anodic electrolyte and 0.1 mol/L LiCl/ethylenediamine (EDA) as the cathodic electrolyte. The effect of EDA on ENRR performance towards NH3 is studied. The presence of EDA has a considerable influence on the FE, resulting in a significantly higher FE. It is conceivable because of the large electrochemical window of EDA to attain a much higher FE of 17.2% (Fig. 17b). In addition, alkali metal ions could interact strongly with molecular N2 in an electrolyte and hinder the HER. It is also discovered that the selection of counter ions in the aqueous electrolyte has a significant effect, and the order of Li+ > Na+ > K+ in terms of NH3 production rate shows that the smallest counter ions are the most advantageous (Figs. 17c and d) [89]. This might be the case because the ENRR is affected by the steric effect and a significant interaction between counter ions and N2 [54].
Since non-aqueous electrolytes improve reactant gas capture and partially suppress HER, the yield and FE of the ENRR are often superior to those in aqueous electrolytes. Nonaqueous electrolytes, however, still have a lot of challenges. First, their volatility, flammability, and probable toxicity under ambient conditions vary from the objective of green synthesis. In addition, the cost of nonaqueous electrolytes is quite high, particularly for ILs, and the current density is limited. Furthermore, the complicated structure of non-aqueous solvents such as ILs and mixed electrolytes makes it challenging to carry out thorough and clear investigations in the electrocatalytic process. A unique reaction mechanism for the different electrolytes has not been proposed. Therefore, a thorough investigation of the potential of non-aqueous electrolytes for ENRR in large-scale applications is necessary.
The environmentally friendly N2 electroreduction procedure, which has the potential to be used to store renewable energy in chemical bonds, is anticipated to replace the outdated Haber-Bosch process. The scientific community has been working hard to speed up and improve the N2 electroreduction process since 2015. The majority of research has concentrated on developing electrocatalysts, which has given researchers insights into how to boost the activity and selectivity of the ENRR while stifling the rival HER. If the catalyst design is the exclusive focus of the research, the significance and requirements of the overall reaction system may be missed. As discussed in this review, electrolytes serve as a proton source, a medium to trap N2, a method of transferring protons and intermediates during the reaction process, and a way of proton transfer during the development of effective systems for ENRR. Several exemplary works pertinent to the modulation of electrolytes are listed according to the types of solvents, including aqueous electrolytes and non-aqueous electrolytes. Even though FE and the yield of ENRR have greatly improved, the industrialization of ENRR is still a long way off. Several important aspects remain to be considered (Fig. 18).
There is a further need to explore these tough but essential areas to know how electrolytes affect electrocatalytic performance properly in the future. More complex in situ methods, such as in situ spectroscopy and in situ mass spectrometry, should be developed in order to identify the real active sites and keep track of significant intermediates. These kinds of advanced in-situ techniques greatly improve catalytic performance and provide essential resources to support deepgoing analysis of the electrolyte in electrochemical reduction processes. Besides, it is urgently necessary to make significant advancements in theoretical calculations and computational analysis to provide a deeper insight into the electrocatalytic mechanism, electrolyte effects (e.g., pH, buffer ability), and the change that occurred on the surface of the catalyst under different electrolytes. Computational analysis can identify the active N2 activation sites in different electrolytes and reveal the least-energetic chemical pathway. The method of DFT-guided synthesis can also be used to tailor the electrolytes to improve the quantity of N2 activation sites, encourage a reaction with lower free energy, and require less overpotential. According to the findings of the published experiments, the operating parameters, electrolytes, and catalysts have a considerable impact on the generation and distribution of intermediates, as well as the mass transfer of reactants and products, etc. But most of these components have been overlooked. Further research is required to develop multiscale techniques that can take into account the impacts of mass transit, electrolytes, and catalysts to better understand the ENRR in this setting. For the ENRR method to be used in practice, an N2-electrolyzer that incorporates the anode reaction into the overall NH3 production process is required. Because the OER at the anode can absorb a portion of the excess potential in the aqueous phase, it is recommended to use flowing organic electrolytes (ethanol, methanol, and urea) to reduce anodic overpotential. Hence, in this interdisciplinary subject, collaboration between chemists, electrochemists, materials scientists, and chemical engineers may lead to significant advancement. Only if ENRR is made economically viable will they be a useful and practical option to store renewable energy and drastically lower energy use and CO2 emissions.
The authors declare that they have no known competing financial interests or personal relationships that could have appeared to influence the work reported in this paper.
This work was financially supported by the National Natural Science Foundation of China (No. 22272150), the Major Program of Zhejiang Provincial Natural Science Foundation of China (Nos. LD22B030002 and LZ23B030002), the Zhejiang Provincial Ten Thousand Talent Program (No. 2021R51009), and the Key Science and Technology Project of Jinhua City (No. 2020-1-044).
T. Xu, B. Ma, J. Liang, et al., Acta Phys. Chim. Sin. 37 (2021) 2009043.
G. Qing, R. Ghazfar, S.T. Jackowski, et al., Chem. Rev. 120 (2020) 5437–5516. doi: 10.1021/acs.chemrev.9b00659
X. Li, G. Zhang, P. Shen, X. Zhao, K. Chu, Inorg. Chem. Front. 10 (2023) 280–287. doi: 10.1039/d2qi02118h
W. Song, J. Wang, L. Fu, et al., Chin. Chem. Lett. 32 (2021) 3137–3142. doi: 10.1016/j.cclet.2021.02.043
Q. Liu, T. Xu, Y. Luo, et al., Curr. Opin. Electrochem. 29 (2021) 100766. doi: 10.1016/j.coelec.2021.100766
C. Smith, A.K. Hill, L. Torrente-Murciano, Energy Environ. Sci. 13 (2020) 331–344. doi: 10.1039/c9ee02873k
A. Klerke, C.H. Christensen, J.K. Nørskov, T. Vegge, J. Mater. Chem. 18 (2008) 2304–2310. doi: 10.1039/b720020j
J. Liang, Q. Liu, A.A. Alshehri, X. Sun, Nano Res. Energy 1 (2022) e9120010. doi: 10.26599/nre.2022.9120010
Y. Tan, L. Yan, C. Huang, et al., Small 17 (2021) 2100372. doi: 10.1002/smll.202100372
S. Licht, B. Cui, B. Wang, et al., Science 345 (2014) 637–640. doi: 10.1126/science.1254234
R. Shi, X. Zhang, G.I. Waterhouse, Y. Zhao, T. Zhang, Adv. Energy Mater. 10 (2020) 2000659. doi: 10.1002/aenm.202000659
Y. Luo, P. Shen, X. Li, Y. Guo, K. Chu, Nano Res. 15 (2022) 3991–3999. doi: 10.1007/s12274-022-4097-9
J. Kibsgaard, J.K. Nørskov, I. Chorkendorff, ACS Energy Lett. 4 (2019) 2986–2988. doi: 10.1021/acsenergylett.9b02286
B.H. Suryanto, H.L. Du, D. Wang, et al., Nat. Catal. 2 (2019) 290–296. doi: 10.1038/s41929-019-0252-4
J.H. Montoya, C. Tsai, A. Vojvodic, J.K. Nørskov, ChemSusChem 8 (2015) 2180–2186. doi: 10.1002/cssc.201500322
N. Cao, G. Zheng, Nano Res. 11 (2018) 2992–3008. doi: 10.1007/s12274-018-1987-y
C.J. van der Ham, M.T. Koper, D.G. Hetterscheid, Chem. Soc. Rev. 43 (2014) 5183–5191. doi: 10.1039/C4CS00085D
J. Hou, M. Yang, J. Zhang, Nanoscale 12 (2020) 6900–6920. doi: 10.1039/d0nr00412j
H. Xu, K. Ithisuphalap, Y. Li, et al., Nano Energy 69 (2020) 104469. doi: 10.1016/j.nanoen.2020.104469
D. Ma, Z. Zeng, L. Liu, Y. Jia, J. Energy Chem. 54 (2021) 501–509. doi: 10.1016/j.jechem.2020.06.032
D. Ma, Z. Zeng, L. Liu, X. Huang, Y. Jia, J. Phys. Chem. C 123 (2019) 19066–19076. doi: 10.1021/acs.jpcc.9b05250
Q. Wang, J. Guo, P. Chen, J. Energy Chem. 36 (2019) 25–36. doi: 10.30564/jams.v2i2.514
J. Yang, W. Weng, W. Xiao, J. Energy Chem. 43 (2020) 195–207. doi: 10.1016/j.jechem.2019.09.006
H.P. Jia, E.A. Quadrelli, Chem. Soc. Rev. 43 (2014) 547–564. doi: 10.1039/C3CS60206K
J. Deng, J.A. Iñiguez, C. Liu, Joule 2 (2018) 846–856. doi: 10.1016/j.joule.2018.04.014
X. Cui, C. Tang, Q. Zhang, Adv. Energy Mater. 8 (2018) 1800369. doi: 10.1002/aenm.201800369
D.D. Wagman, W.H. Evans, V.B. Parker, et al., J. Phys. Chem. Ref. Data 18 (1989) 1807–1812. doi: 10.1063/1.555845
N. Bauer, J. Phys. Chem. 64 (1960) 833–837. doi: 10.1021/j100836a001
M.T. Koper, Chem. Sci. 4 (2013) 2710–2723. doi: 10.1039/c3sc50205h
D.E. Brown, T. Edmonds, R.W. Joyner, J.J. McCarroll, S.R. Tennison, Catal. Lett. 144 (2014) 545–552. doi: 10.1007/s10562-014-1226-4
G.F. Chen, S. Ren, L. Zhang, et al., Small Methods 3 (2019) 1800337. doi: 10.1002/smtd.201800337
Y. Ren, C. Yu, X. Tan, et al., Energy Environ. Sci. 14 (2021) 1176–1193. doi: 10.1039/d0ee03596c
D.R. MacFarlane, P.V. Cherepanov, J. Choi, et al., Joule 4 (2020) 1186–1205. doi: 10.1016/j.joule.2020.04.004
L. Suo, O. Borodin, T. Gao, et al., Science 350 (2015) 938–943. doi: 10.1126/science.aab1595
L. Hu, Z. Xing, X. Feng, ACS Energy Lett. 5 (2020) 430–436. doi: 10.1021/acsenergylett.9b02679
A.R. Singh, B.A. Rohr, J.A. Schwalbe, et al., ACS Catal. 7 (2017) 706–709. doi: 10.1021/acscatal.6b03035
C. Tang, S.Z. Qiao, Chem. Soc. Rev. 48 (2019) 3166–3180. doi: 10.1039/c9cs00280d
Y.C. Hao, Y. Guo, L.W. Chen, et al., Nat. Catal. 2 (2019) 448–456. doi: 10.1038/s41929-019-0241-7
Y. Ren, C. Yu, X. Tan, et al., Small Methods 3 (2019) 1900474. doi: 10.1002/smtd.201900474
H. Tao, C. Lian, H. Jiang, et al., AIChE J. 68 (2022) e17549. doi: 10.1002/aic.17549
O. Westhead, M. Spry, A. Bagger, et al., J. Mater. Chem. A 11 (2023) 12746—12758. doi: 10.1039/D2TA07686A
E. Skúlason, T. Bligaard, S. Gudmundsdóttir, et al., Phys. Chem. Chem. Phys. 14 (2012) 1235–1245. doi: 10.1039/C1CP22271F
J.G. Howalt, T. Bligaard, J. Rossmeisl, T. Vegge, Phys. Chem. Chem. Phys. 15 (2013) 7785–7795. doi: 10.1039/c3cp44641g
M.C. Leech, K. Lam, Nat. Rev. Chem. 6 (2022) 275–286. doi: 10.1038/s41570-022-00372-y
L.V. Haynes, D.T. Sawyer, Anal. Chem. 39 (1967) 332–338. doi: 10.1021/ac60247a013
R. Zhang, X. Ren, X. Shi, et al., ACS Appl. Mater. Interfaces 10 (2018) 28251–28255. doi: 10.1021/acsami.8b06647
Z. Wang, F. Gong, L. Zhang, et al., Adv. Sci. 6 (2019) 1801182. doi: 10.1002/advs.201801182
L. Zhang, X. Ji, X. Ren, et al., Adv. Mater. 30 (2018) 1800191. doi: 10.1002/adma.201800191
Y. Zhang, W. Qiu, Y. Ma, et al., ACS Catal. 8 (2018) 8540–8544. doi: 10.1021/acscatal.8b02311
X. Zhang, Q. Liu, X. Shi, et al., J. Mater. Chem. A 6 (2018) 17303–17306. doi: 10.1039/c8ta05627g
X. Xiang, Z. Wang, X. Shi, M. Fan, X. Sun, ChemCatChem 10 (2018) 4530–4535. doi: 10.1002/cctc.201801208
X. Li, T. Li, Y. Ma, et al., Adv. Energy Mater. 8 (2018) 1801357. doi: 10.1002/aenm.201801357
Q. Liu, X. Zhang, B. Zhang, et al., Nanoscale 10 (2018) 14386–14389. doi: 10.1039/C8NR04524K
M. Nazemi, S.R. Panikkanvalappil, M.A. El-Sayed, Nano Energy 49 (2018) 316–323. doi: 10.1016/j.nanoen.2018.04.039
X. Zhu, Z. Liu, Q. Liu, et al., Chem. Commun. 54 (2018) 11332–11335. doi: 10.1039/c8cc06366d
V. Kordali, G. Kyriacou, C. Lambrou, Chem. Commun. (2000) 1673–1674.
D. Yang, T. Chen, Z. Wang, J. Mater. Chem. A 5 (2017) 18967–18971. doi: 10.1039/C7TA06139K
X. Ren, G. Cui, L. Chen, et al., Chem. Commun. 54 (2018) 8474–8477. doi: 10.1039/c8cc03627f
B.H. Suryanto, D. Wang, L.M. Azofra, et al., ACS Energy Lett. 4 (2018) 430–435.
C. Lv, C. Yan, G. Chen, et al., Angew. Chem. 130 (2018) 6181–6184. doi: 10.1002/ange.201801538
Y. Liu, Y. Su, X. Quan, et al., ACS Catal. 8 (2018) 1186–1191. doi: 10.1021/acscatal.7b02165
W. Qiu, X.Y. Xie, J. Qiu, et al., Nat. Commun. 9 (2018) 1–8. doi: 10.1038/s41467-017-02088-w
J. Han, Z. Liu, Y. Ma, et al., Nano Energy 52 (2018) 264–270. doi: 10.1016/j.nanoen.2018.07.045
H. Du, X. Guo, R.M. Kong, F. Qu, Chem. Commun. 54 (2018) 12848–12851. doi: 10.1039/c8cc07186a
M.M. Shi, D. Bao, B.R. Wulan, et al., Adv. Mater. 29 (2017) 1606550. doi: 10.1002/adma.201606550
S.J. Li, D. Bao, M.M. Shi, et al., Adv. Mater. 29 (2017) 1700001. doi: 10.1002/adma.201700001
L. Zhang, X. Ji, X. Ren, et al., ACS Sustain. Chem. Eng. 6 (2018) 9550–9554. doi: 10.1021/acssuschemeng.8b01438
K. Kugler, M. Luhn, J.A. Schramm, K. Rahimi, M. Wessling, Phys. Chem. Chem. Phys. 17 (2015) 3768–3782. doi: 10.1039/C4CP05501B
Z. Wang, Y. Li, H. Yu, et al., ChemSusChem 11 (2018) 3480–3485. doi: 10.1002/cssc.201801444
D. Bao, Q. Zhang, F.L. Meng, et al., Adv. Mater. 29 (2017) 1604799. doi: 10.1002/adma.201604799
S. Mukherjee, D.A. Cullen, S. Karakalos, et al., Nano Energy 48 (2018) 217–226. doi: 10.1016/j.nanoen.2018.03.059
S. Chen, S. Perathoner, C. Ampelli, et al., ACS Sustain. Chem. Eng. 5 (2017) 7393–7400. doi: 10.1021/acssuschemeng.7b01742
W. Guo, Z. Liang, J. Zhao, et al., Small Methods 2 (2018) 1800204. doi: 10.1002/smtd.201800204
H. Ma, Z. Chen, Z. Wang, Nanoscale 13 (2021) 1717–1722. doi: 10.1039/d0nr07362h
M. Nazemi, M.A. El-Sayed, J. Phys. Chem. Lett. 9 (2018) 5160–5166. doi: 10.1021/acs.jpclett.8b02188
J. Wang, L. Yu, L. Hu, et al., Nat. Commun. 9 (2018) 1795. doi: 10.1038/s41467-018-04213-9
S. Mukherjee, X. Yang, W. Shan, et al., Small Methods 4 (2020) 1900821. doi: 10.1002/smtd.201900821
H. Zhu, X. Ren, X. Yang, et al., SusMat 2 (2022) 214–242. doi: 10.1002/sus2.70
M. Wang, S. Liu, T. Qian, et al., Nat. Commun. 10 (2019) 341. doi: 10.1038/s41467-018-08120-x
F. Lü, S. Zhao, R. Guo, et al., Nano Energy 61 (2019) 420–427. doi: 10.1016/j.nanoen.2019.04.092
L. Hu, A. Khaniya, J. Wang, et al., ACS Catal. 8 (2018) 9312–9319. doi: 10.1021/acscatal.8b02585
L. Zeng, X. Li, S. Chen, et al., J. Mater. Chem. A 8 (2020) 7339–7349. doi: 10.1039/c9ta13336d
X. Yi, X. He, F. Yin, et al., J. Mater. Sci. 55 (2020) 12041–12052. doi: 10.1007/s10853-020-04777-2
Y. Yan, H. Qu, X. Zheng, et al., Chin. Chem. Lett. 33 (2022) 4655–4658. doi: 10.1016/j.cclet.2021.12.054
X. Zheng, Y. Liu, Y. Yan, X. Li, Y. Yao, Chin. Chem. Lett. 33 (2022) 1455–1458. doi: 10.1016/j.cclet.2021.08.102
H. Chen, J. Liang, K. Dong, et al., Inorg. Chem. Front. 9 (2022) 1514–1519. doi: 10.1039/d2qi00140c
Z. Wang, K. Zheng, S. Liu, et al., ACS Sustain. Chem. Eng. 7 (2019) 11754–11759. doi: 10.1021/acssuschemeng.9b01991
X. Li, L. Li, X. Ren, et al., Ind. Eng. Chem. Res. 57 (2018) 16622–16627. doi: 10.1021/acs.iecr.8b04045
Y. Song, D. Johnson, R. Peng, et al., Sci. Adv. 4 (2018) e1700336. doi: 10.1126/sciadv.1700336
Q. Zhang, B. Liu, L. Yu, Y. Bei, B. Tang, ChemCatChem 12 (2020) 334–341. doi: 10.1002/cctc.201901519
H. Cheng, L.X. Ding, G.F. Chen, et al., Adv. Mater. 30 (2018) 1803694. doi: 10.1002/adma.201803694
J. Han, X. Ji, X. Ren, et al., J. Mater. Chem. A 6 (2018) 12974–12977. doi: 10.1039/C8TA03974G
X. Zhang, R.M. Kong, H. Du, L. Xia, F. Qu, Chem. Commun. 54 (2018) 5323–5325. doi: 10.1039/c8cc00459e
Q. Liu, Y. Lin, S. Gu, et al., Nano Res. 15 (2022) 7134–7138. doi: 10.1007/s12274-022-4568-z
H.J. Chen, Z.Q. Xu, S. Sun, et al., Inorg. Chem. Front. 9 (2022) 4608–4613. doi: 10.1039/d2qi01173e
H. Chen, J. Liang, L. Li, et al., ACS Appl. Mater. Interfaces 13 (2021) 41715–41722. doi: 10.1021/acsami.1c11872
C. Lv, Y. Qian, C. Yan, et al., Angew. Chem. 130 (2018) 10403–10407. doi: 10.1002/ange.201806386
X. Yu, P. Han, Z. Wei, et al., Joule 2 (2018) 1610–1622. doi: 10.1016/j.joule.2018.06.007
Y.Q. Liu, L. Huang, Y. Fang, et al., ACS Appl. Mater. Interfaces 14 (2022) 12304–12313. doi: 10.1021/acsami.1c25240
W. Ye, H. Wang, J. Ning, Y. Zhong, Y. Hu, J. Energy Chem. 57 (2021) 219–232. doi: 10.1016/j.jechem.2020.09.016
J. Thompson, G. Morrison, Anal. Chem. 23 (1951) 1153–1157. doi: 10.1021/ac60056a029
T. Ali, H. Wang, W. Iqbal, et al., Adv. Sci. 10 (2023) 2205077. doi: 10.1002/advs.202205077
S.H. Yuen, A.G. Pollard, J. Sci. Food Agric. 3 (1952) 441–447. doi: 10.1002/jsfa.2740031002
L. Zhou, C.E. Boyd, Aquaculture 450 (2016) 187–193. doi: 10.1016/j.aquaculture.2015.07.022
M. Wang, S. Liu, H. Ji, et al., Nat. Commun. 12 (2021) 3198. doi: 10.1038/s41467-021-23360-0
P. Shen, X. Li, Y. Luo, et al., ACS Nano 16 (2022) 7915–7925. doi: 10.1021/acsnano.2c00596
Y. Ren, C. Yu, X. Tan, et al., Energy Environ. Sci. 15 (2022) 2776–2805. doi: 10.1039/d2ee00358a
Y. Ren, C. Yu, X. Song, et al., J. Mater. Chem. A 9 (2021) 13036–13043. doi: 10.1039/d1ta02681j
C.M. Gabardo, A. Seifitokaldani, J.P. Edwards, et al., Energy Environ. Sci. 11 (2018) 2531–2539. doi: 10.1039/c8ee01684d
B.H. Suryanto, C.S. Kang, D. Wang, et al., ACS Energy Lett. 3 (2018) 1219–1224. doi: 10.1021/acsenergylett.8b00487
F. Zhou, L.M. Azofra, M. Ali, et al., Energy Environ. Sci. 10 (2017) 2516–2520. doi: 10.1039/C7EE02716H
F. Köleli, T. Röpke, App. Catal. B: Environ. 62 (2006) 306–310. doi: 10.1016/j.apcatb.2005.08.006
K. Kim, N. Lee, C.Y. Yoo, et al., J. Electrochem. Soc. 163 (2016) F610. doi: 10.1149/2.0231607jes
K. Kim, C.Y. Yoo, J.N. Kim, H.C. Yoon, J.I. Han, J. Electrochem. Soc. 163 (2016) F1523. doi: 10.1149/2.0741614jes
Y. Ren, C. Yu, X. Han, et al., ACS Energy Lett. 6 (2021) 3844–3850. doi: 10.1021/acsenergylett.1c01893
H.K. Lee, C.S.L. Koh, Y.H. Lee, et al., Sci. Adv. 4 (2018) eaar3208. doi: 10.1126/sciadv.aar3208
A. Gennaro, A.A. Isse, M.G. Severin, et al., J. Chem. Soc. Faraday Trans. 92 (1996) 3963–3968. doi: 10.1039/FT9969203963
S. Malkhandi, B. Yang, A.K. Manohar, G.K.S. Prakash, S.R. Narayanan, J. Am. Chem. Soc. 135 (2013) 347–353. doi: 10.1021/ja3095119
M.N. Jackson, Y. Surendranath, J. Am. Chem. Soc. 138 (2016) 3228–3234. doi: 10.1021/jacs.6b00167
A. Gorodyskii, V. Danilin, O. Efimov, N. Nechaeva, V. Tsarev, React. Kinet. Catal. Lett. 11 (1979) 337–342. doi: 10.1007/BF02079722
A. Tsuneto, A. Kudo, T. Sakata, Chem. Lett. 22 (1993) 851–854. doi: 10.1246/cl.1993.851
J.L. Ma, D. Bao, M.M. Shi, J.M. Yan, X.B. Zhang, Chem 2 (2017) 525–532. doi: 10.1016/j.chempr.2017.03.016
S. Stevanovic, M.F. Costa Gomes, J. Chem. Thermodyn. 59 (2013) 65–71. doi: 10.1016/j.jct.2012.11.010
H.L. Du, M. Chatti, R.Y. Hodgetts, et al., Nature 609 (2022) 722–727. doi: 10.1038/s41586-022-05108-y

Figure 1 Schematic diagram for the recent progress on the electrolytes for ENRR toward NH3.

Figure 2 Schematic diagram of ENRR to NH3 over catalyst via associative and dissociative pathways. Reproduced with permission [21]. Copyright 2019, American Chemical Society.

Figure 3 (a) Schematic illustration of the competitive adsorption and surface coverage on the catalyst during the ENRR and HER process (blue, N2; purple, proton; gray, catalyst). (b) Illustration of the limiting proton transfer rate by decreasing bulk solution proton concentration and increasing the surface proton transfer barrier. Reproduced with permission [36]. Copyright 2017, American Chemical Society.

Figure 4 (a) Current density profiles in different electrolytes. (b) Average NH3 formation rates and FEs in different electrolytes. Reproduced with permission [47]. Copyright 2017, American Chemical Society.

Figure 5 (a) Schematic procedure, (b) HIM image, (c) TEM image, and (d) HRTEM image of CoP HNC. Reproduced with permission [73]. Copyright 2018, Wiley-VCH.

Figure 6 (a) Geometric models and (b) TEM image of Au nanorods. (c) Average yield of NH3 and hydrazine hydrate and FEs of Au nanorods in 0.1 mol/L KOH. Reproduced with permission [70]. Copyright 2016, Wiley-VCH.

Figure 7 (a) NH3 yield rates and FEs in different electrolytes. Reproduced with permission [76]. Copyright 2018, Springer Nature. (b) NH3 yields of Ni-Fe-MoS2 and MoS2. Reproduced with permission [82]. Copyright 2020, Royal Society of Chemistry. (c) Chronoamperometric curves of NH2-MIL-88B-Fe in 0.1 mol/L Na2SO4 and 0.05 mol/L H2SO4 measured at −0.45 V. (d) NH3 yield rates and FEs in 0.1 mol/L Na2SO4 and 0.05 mol/L H2SO4 electrolytes. Reproduced with permission [83]. Copyright 2020, Springer Nature.

Figure 8 (a) schematic illustration for preparing p-Fe2O3/CC catalyst. (b) NH3 production rates and FEs of p-Fe2O3/CC catalyst. (c) NH3 production rates and FEs of p-Fe2O3/CC, Fe2O3–4/CC, Fe2O3–8/CC, and CC catalysts. Reproduced with permission [87]. Copyright 2019, American Chemical Society.

Figure 9 (a) NH3 production rates and FEs for TiO2-rGO/CP in 0.1 mol/L Na2SO4. (b) NH3 production rates using various electrodes at −0.90 V. (c) NH3 production rates and FEs at −0.90 V during recycling tests. Reproduced with permission [50]. Copyright 2018, Royal Society of Chemistry.

Figure 10 (a) An illustration of a schematic for synthesizing Mo2C/C using the molten salt approach. (b) FEs and (c) NH3 yield rates over Mo2C/C on hydrophilic CC and hydrophobic CC with pH of 2 and 3 in 0.5 mol/L Li2SO4. Reproduced with permission [91]. Copyright 2018, Wiley-VCH.

Figure 11 (a) Schematic illustration for prrparing BVC-A and BVC—C catalysts. (b) Electrochemical performances of Bi4V2O11, CeO2, BVC-A, and BVC—C at −0.2 V vs. RHE. (c) NH3 formation rates and FEs of BVC-A in 0.1 mol/L HCl. Reproduced with permission [60]. Copyright 2018, Wiley-VCH.

Figure 12 (a) NH3 synthesis rates achieved using several catalysts at −0.2 V vs. RHE. (b) NH3 synthesis rate and FEs of the Au/CeOx-RGO composite in 0.1 mol/L HCl. Reproduced with permission [66]. Copyright 2017, Wiley-VCH.

Figure 13 (a) NH3 formation rates and (b) FEs of PCN in 0.1 mol/L HCl which is N2-saturated. (c) The charge density difference of the N2-adsorbed PCN with N-vacancies and the geometry of N2 adsorption on PCN with N-vacancies. Reproduced with permission [97]. Copyright 2018 Wiley-VCH.

Figure 14 (a) Schematic illustration for preparing boron-doped graphene. (b) TEM image, (c) NH3 yields and FEs of boron-doped graphene. Reproduced with permission [98]. Copyright 2018, Elsevier.

Figure 15 (a) UV–vis spectra of NH3 production rate after electrolysis for 2 h at −0.35 V vs. RHE. (b) Comparison of NH3 yield rates and FEs on pure Rh, SnO2, Rh0.3@SnO2, Rh0.5@SnO2, Rh1.3@SnO2, and mechanically mixed Rh0.5/SnO2 catalysts at −0.35 V vs. RHE. (c) NH3 yield rates and FEs on Rh0.5@SnO2 at −0.35 V vs. RHE after consecutive tests. (d) Chronoamperometry curve for 20 h on Rh0.5@SnO2. Reproduced with permission [99]. Copyright 2022, American Chemical Society.

Figure 16 (a) Schematic of Fe-SS electrode based N2 reduction process. (b) FEs for electro-reduction of N2-saturated ILs on different electrodes at −0.8 V vs. NHE. (c) NH3 production rates on several electrodes and ILs at −0.8 V vs. NHE. Reproduced with permission [111]. Copyright 2017, Royal Society of Chemistry. (d) FEs and the NH3 yields at XIL = 0.16. (e) NH3 yields and FEs at −0.65 V vs. NHE. Reproduced with permission [110]. Copyright 2018, American Chemical Society. (f) Corresponding FEs and NH3 yield rates. After chronoamperometry, the electrode was either coated with visible degradation products or was not, as indicated by the pink and light-green shading, respectively. Reproduced with permission [124]. Copyright 2022, Nature.

Figure 17 (a) Effect of the electrolyte medium on NH3 synthesis rate and FE. Reproduced with permission [113]. Copyright 2016, Electrochemical Society. (b) A schematic representation of ethylenediamine (EDA)-based NH3 synthesis. Reproduced with permission [114]. Copyright 2016, Electrochemical Society. (c, d) Comparison of electrolyte counterion effect of Li+, Na+, and K+ on NH3 synthesis rate and FE. Reproduced with permission [89]. Copyright 2018, Science.

 扫一扫看文章

扫一扫关注我们
 DownLoad:


 下载:
下载:

 下载:
下载: