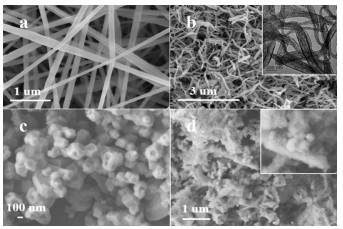
Figure 1.
SEM images of (a) PAN/Ti(OiPr)4 composite nanofibers; (b) TiO2 hollow nanofibers; (c) Individual Ag2O and (d) AT-4
Insight into Superior Visible Light Photocatalytic Activity for Degradation of Dye over Corner-truncated Cubic Ag2O Decorated TiO2 Hollow Nanofibers
Yi-Lan CHEN , Yu-Xian XU , Dai-Feng LIN , Yong-Jin LUO , Hun XUE , Qing-Hua CHEN

Nowadays, the major concern of the environmentalist is the presence of recalcitrant dyes in effluents because they cause serious environmental and health threats[1, 2]. There are more than 100, 000 commercial dyes with an annual production of over 7 × 10⁵ tonnes/year[3]. The total dye consumption in the textile industry worldwide is more than 10, 000 tonnes/year and approximately 100 tonnes/year of dyes entered into water streams[4]. Methyl orange (MO) is one of the well-known acidic/anionic dyes, which has been widely used in textile, printing and paper industries and research laboratories[5]. Thus, it is imperative to develop alternative processes to remove MO from wastewater.
Semiconductor photocatalysis offers great potential opportunities to remove MO from waters due to its high efficiency, no secondary pollution and low cost. TiO2 is one of the most extensively used photocatalysts for photodegradation of toxic organic pollutants[6]. However, its wide band gap and rapid recombination of photogenerated electron and hole pairs limit its application[7]. In recent years, fabricating p-n heterojunction photocatalysts is one of the most ingenious approaches to improve the visible light responsive activity and facilitate the separation of photogenerated carriers.
Ag2O has the strong absorption in the visible light region. However, individual Ag2O still exhibits poor photocatalytic activity for the low quantum yield, poor light stability and short life of charge carriers[8-10]. Thereby, Ag2O/TiO2 heterostructure has been proposed by researchers. As Zhou et al. reported[11, 12] that cubic Ag2O (c-Ag2O) decorated TiO2 has better photocatalytic performance than individual Ag2O and TiO2 under ultraviolet (UV) irradiation, but the degradation curve for Ag2O/TiO2 was observed to be very close to that for Ag2O under visible-light irradiation. It should be because the conduction band (CB) minimum of Ag2O is more positive than that of TiO2, and the photogenerated electron from Ag2O cannot transfer to the CB of TiO2. However, amorphous TiO2/hexagonal Ag2O (h-Ag2O) heterostructures prepared by Xu et al[13] exhibited excellent photocatalytic activity under UV and visible light irradiation, much better than TiO2 and Ag2O, which is based on the ∼2.45 ± 0.05 eV band gap of h-Ag2O. It is controversial with the Yu et al.'s study[14], in which the band gap of h-Ag2O is found to be lower than 1.55 eV. Therefore, how two different phases of Ag2O play roles in Ag2O/TiO2 for enhanced visible light photocatalytic performance is confusing. It is worth investigating the role of Ag2O structure and content, as well as the energy band engineering in Ag2O/TiO2. Meanwhile, our recent work demonstrates that TiO2 hollow nanofibers can contribute to higher surface area for enhancing adsorption capability and improves the stability of Ag/AgCl[15].
Hence, in this paper, we synthesized TiO2 hollow nanofibers via an electrospinning method, then corner-truncated cubic Ag2O was loaded on the surface of TiO2 hollow nanofibers by a simple precipitation method. The photodegradation experiments indicate that c-Ag2O in Ag2O/TiO2 plays important roles in enhancing the visible-light photodegradation activity. The enhanced photocatalytic activity over Ag2O/TiO2 is due to the formation of metallic Ag during the photocatalytic process which exhibits the SPR effect. Combining the characterization analysis and energy band calculation results, a possible photocatalytic mechanism was proposed.
Ag2O/TiO2 was prepared by an electrospinning-precipitation method. The preparation of TiO2 hollow nanofiber was following our previous report[15]. Then, 0.16 g above TiO2 was dispersed in 30 mL deionized water, and then an appropriate amount of AgNO3 was added into the solution. After that, 0.2 mol NaOH was slowly added to the mixture suspension followed by continuous stirring for 5 min. Then the resulting precipitate was collected, washed and dried. By controlling the amount of AgNO3 to be 0.4, 0.8, 1.2, 1.6 and 2.0 mmol, the obtained Ag2O/TiO2 was labeled as AT-1 to AT-5, respectively. A similar process was adopted to synthesize Ag2O without the addition of TiO2.
The phase of samples was determined on an X-ray diffraction analyzer (XRD, D8 Advance, Bruker) using graphite-monochromatized CuKα radiation, with the accelerating voltage and the applied current to be 40 kV and 40 mA, respectively. Samples morphology was observed by a field emission scanning electron microscope (FESEM, JEOL, JSM-7500F). Transmission electron microscopy (TEM) images were taken with a JEM-2100F transmission electron microscope with an accelerating voltage of 200 kV. The BET specific surface areas (SBET) were analyzed by N2 adsorption-desorption at 77 K on a BELSORP-mini surface area analyzer (BELSORP Co., Japan). X-ray photoelectron spectroscopy (XPS) was measured using a Thermo ESCALAB 250Xi XPS, and the C 1s peak at 284.8 eV of the adventitious carbon was referenced to rectify the binding energies. The UV-visible diffuse reflectance absorption features were investigated on a UV-visible spectrophotometer (Cary 500 Scan Spectrophotometers, Varian, USA).
Each sample (100 mg) was suspended in 100 mL methyl orange (MO) aqueous solution with a concentration of 10 mg·L-1 in a Pyrex glass vessel. A 300 W Xe lamp (PLS-SXE300C, Perfectligt, China) with a UV cutoff filter (providing visible light with ≥ 420 nm) was used as a light source. Prior to irradiation, the suspension was magnetically stirred for 1 h to reach adsorption/desorption equilibrium. At a given time interval, 3 mL of suspension was withdrawn regularly and centrifuged, and the supernatant was analyzed to determine the residual concentration of MO with the colorimetric method at 464 nm by a UV-vis spectrophotometer (Shimadzu UV-1750).
The morphology of the samples is investigated by SEM and TEM. The representative SEM image of PAN/Ti(OiPr)4 composite nanofibers is shown in Fig. 1a. It is clearly that composite nanofibers are continuous and smooth. After calcination (Fig. 1b), the composite nanofibers breakage and bend, and the hollow porous structure is confirmed by TEM images (the inset of Fig. 1b). From Fig. 1c, corner-truncated cubic Ag2O already exhibit slightly etched square faces. Regarding Ag2O/TiO2 (Fig. 1d), corner-truncated cubic Ag2O is distributed on the surface of TiO2. Compared to individual Ag2O, the morphology of Ag2O in Ag2O/TiO2 has change, the face-etching is not observed.
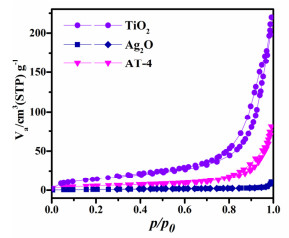
N2 adsorption-desorption analysis is used to examine the BET specific surface area of the obtained samples, and the results are shown in Fig. 2. The adsorption-desorption isotherm of TiO2 can be classified as a type Ⅳ isotherm with a H1-type hysteresis loop, which is characteristic of mesopores, giving a high SBET of 55 m2/g. Compared with individual Ag2O, the N2 adsorption-desorption isotherm of AT-4 shifts upward, indicating the increase of BET specific surface area. The SBET of Ag2O and AT-4 are 3 and 20 m2/g, respectively. It demonstrates that the presence of TiO2 hollow structure and mesopores in AT-4 results in a larger surface area, which will provide the enhanced capability for pollutant adsorption.
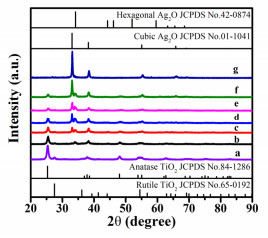
The phase analysis of the samples is performed using XRD and is reported in Fig. 3. In individual Ag2O, the diffraction peaks at 2θ of 33.0°, 38.3° and 55.2° are attributed to the respective (111), (200) and (220) planes of c-Ag2O (JCPDS No.01-1041). An additional peak for (003) planes of h-Ag2O is also detected at 34.2° (JCPDS No.42-0874). For TiO2, most of the diffraction peaks can be clearly indexed as the anatase TiO2 (JCPS No. 84-1286), and the additional peaks attribute to (110) planes of rutile TiO2 (JCPDS no. 65-0192). In the case of Ag2O/TiO2, the peaks of Ag2O and TiO2 are observed without any other impurities. For AT-1, only the peaks of h-Ag2O and TiO2 are observed. When increasing the content of Ag2O in Ag2O/TiO2, the peak intensity of c-Ag2O appears and gradually increases. Therefore, the change of morphology for Ag2O in AT-4 (Fig. 1d) may be due to the co-existence of c-Ag2O and h-Ag2O in AT-4.
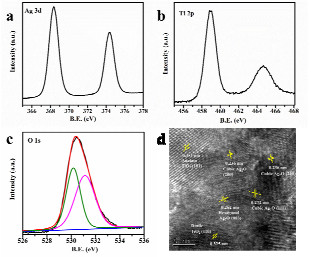
The elemental compositions and chemical states of AT-4 are measured by XPS. Fig. 4a demonstrates the high-resolution XPS spectra for Ag 3d 3/2 and Ag 3d 5/2 photoelectrons at 374.37 and 368.37 eV, respectively. These binding energies are consistent with previous report for Ag2O[16]. As for Ti 2p element (Fig. 4b), two peaks at 458.2 and 464.6 eV for AT-4 are assigned to Ti 2p1/2 and Ti 2p3/2, respectively, which are corresponding to Ti4+ in individual TiO2[17]. The O 1s spectrum region shows two peaks with approximately binding energies of 531.17 and 530.17 eV (Fig. 4c), which belong to surface-adsorbed hydroxyl groups and the lattice O. The result clearly indicates the presence of Ag2O and TiO2. The HRTEM image of AT-4 (Fig. 4d) shows that the interplanar spacing of 0.272 and 0.236 nm corresponds to the (111) and (200) planes of c-Ag2O, and that of 0.262 nm matches with the lattice spacing of h-Ag2O (003). While the distinct lattice fringes of 0.351 and 0.325 nm are related to the crystallographic planes of anatase TiO2 (101) and rutile TiO2 (110), respectively, the observation of HRTEM image matches with the XRD and XPS analysis. Moreover, the continuity of lattice fringes between the interface of Ag2O and TiO2 can favor the charge transfers between them.
Photocatalytic performance is evaluated for degrading aqueous solution of MO under visible light irradiation. As presented in Fig. 5a, the removal of MO for individual Ag2O is 42.6% within 3 min, while there is almost no degradation for individual TiO2 under the same condition. The content of Ag2O in Ag2O/TiO2 plays a significant impact on their photocatalytic performances. The removal efficiencies of MO are about 16.7%, 47.5%, 60.7%, 78.9% and 76.2% for AT-1, AT-2, AT-3, AT-4 and AT-5 within 3 min, respectively. Note that the photocatalytic activity enhanced when the content of AgNO3 increased from 0.4 to 1.6 mmol. When the loading amount of AgNO3 increases to 2.0 mmol, the photocatalytic activity is slightly decreased. AT-4 exhibits the highest degradation efficiency towards MO degradation. Combined with XRD analysis, the photocatalytic performance of AT-1 is obviously lower than individual Ag2O, indicating the h-Ag2O plays a negative role in Ag2O/TiO2. However, more contents of c-Ag2O decrease the photocatalytic activity, since AT-4 has better photodegradation performance than AT-5. It may be attributed to the fact that the higher content of Ag2O covers the adsorption sites for MO[18].
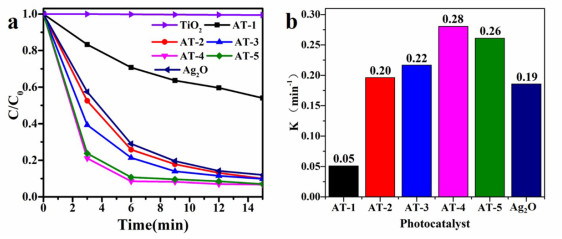
In addition, the pseudo-first-order model[19] is applied to quantitatively compare the reaction kinetics of decomposition rate of MO. The various rate constant (k) is depicted in the form of columns of different colors (Fig. 5b). Undoubtedly, AT-4 displays the highest rate constant (0.28 min−1) 1.5 times higher than that of individual Ag2O. Moreover, the observed photocatalytic performance of AT-4 is far better compared to most of the reported Ag2O/TiO2 which has been summarized in Table 1.
 DownLoad:
CSV
DownLoad:
CSV
| Photocatalyst | Conc. and volume of MO | Light source | Degradation time (min) | Degradation (%) | Reference |
| Ag2O/TiO2 hollow NFs (100 mg) | 3*10-5 M, 100 mL | Visible | 6 | 93 | Our work |
| 3D Ag2O/TiO2 heterojunction (40 mg) | 10−5 M, 40 mL | UV | 15 | 93 | [20] |
| Ag2O/TiO2 nanobelts (20 mg) | 20 mg/L, 20 mL | Visible | 24 | 80 | [8] |
| Ag2O/TiO2 heterostructure (20 mg) | 20 mg/L, 20 mL | UV | 25 | 100 | [9] |
| Ag2O/TiO2 sphere (20 mg) | 14 mg/L, 50 mL | Simulated sunlight | 60 | 98 | [21] |
| Ag2O/TiO2 nanobelts (10 mg) | 10 mg/L, 20 mL | UV | 20 | 100 | [18] |
| TiO2(B)/Ag2O (20 mg) | 10 mg/L, 100 mL | Visible | 30 | 88 | [22] |
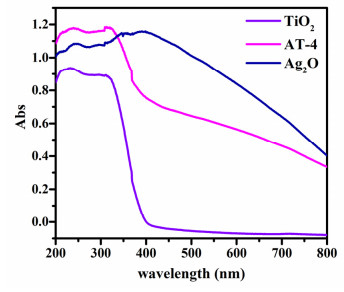
In order to verify the enhanced visible-light photocatalytic activity and improve the charge separation of Ag2O/TiO2, the UV-vis diffuse reflectance spectra of Ag2O, TiO2 and AT-4 are measured (Fig. 6). The UV-vis diffuse reflectance spectra show that TiO2 has a clear edge around 396 nm, and the band gap value is estimated to be 3.13 eV, corresponding to the absorbance in the ultraviolet region. After p-Ag2O/n-TiO2 heterojunction being formed, the optical absorption increases in the visible-light region, and the band gap is determined to be around 2.01 eV thanks to the band gap of the obtained Ag2O (1.18 eV). Thus, Ag2O/TiO2 has great effects on its optical property and enhances the utilized efficiency of visible light for TiO2.
Theoretical band structure of Ag2O/TiO2 heterojunction is constructed to evaluate the effects of structure on their properties. First, the band gaps of TiO2 and Ag2O are characterized by UV-vis diffuse reflectance spectra, and the band positions of Ag2O and TiO2 can be predicted by the following Eqs. 1 and 2[23], respectively.
|
|
(1) |
|
|
(2) |
where Eg is the band gap energy of semiconductor, EVB is the valence band (VB) edge potentials, ECB is the conduction band (CB) edge potentials, X is the electronegativity of semiconductor (XTi = 3.45 eV, XAg = 4.44 eV, XO = 7.54 eV) and Ee is the energy of free electrons on hydrogen scale (~4.5 eV). The values of calculated X, EVB, ECB, and Eg are listed in Table 2.
DownLoad:
CSV
| Semiconductor | X(eV) | EVB(eV) | ECB(eV) | Eg(eV) |
| Ag2O | 5.30 | 1.39 | 0.21 | 1.18 |
| TiO2 | 5.81 | 2.87 | -0.26 | 3.13 |
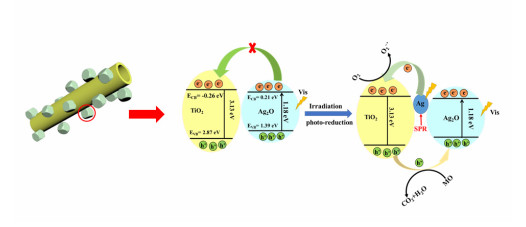
Based on the data listed in Table 2, the theoretical band structure of Ag2O/TiO2 heterojunctions can be proposed. From the valence and conduction band positions for Ag2O and TiO2, it can be concluded that photogenerated electrons in the CB of Ag2O cannot drift to that of TiO2 under visible light illumination. Thus, it should have a similar visible light photocatalytic performance to Ag2O. However, in this work, Ag2O/TiO2 exhibits obviously enhanced visible light photocatalytic activity. Hence, XRD patterns, XPS patterns and UV-vis DRS spectra of AT-4 before and after photocatalytic reaction are performed to reveal the cause of excellent photocatalytic activity.
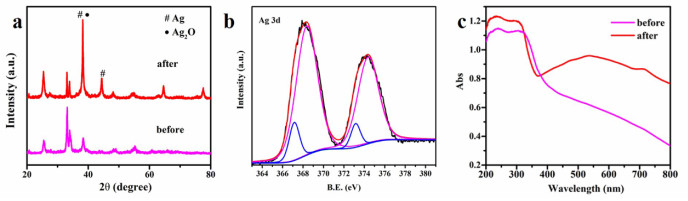
The comparison of XRD patterns of AT-4 before and after photocatalytic reaction is shown in Fig. 7a. After photocatalytic reaction, the XRD patterns exhibit an obvious change, and the diffraction peaks at 38.1° and 44.3° appear. The two diffraction peaks respectively match with the (111) and (200) crystalline planes of metallic Ag, which are marked with "#" (38.1° also belong to (200) planes of Ag2O, marked with "•"). To further provide the presence of Ag0, XPS spectra of Ag 3d in AT-4 after photocatalysis are performed (Fig. 7b). Compared with Fig. 4a, the Ag species add two bands at 367.17 and 373.17 eV after photocatalysis, which ascribes to the metallic Ag0. From Fig. 7c, it can be found a stronger broad absorption band in the range of 400~700 nm in used AT-4, which attributes to the SPR effect of metallic Ag. These observations conclude that the Ag2O undergoes in-situ photoreduction during photocatalysis reaction and forms metallic Ag on the TiO2 surface. The SPR absorption of Ag under visible light may have a great influence on the photocatalysis.
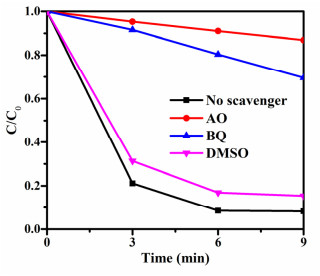
In the photodegradation process, the active species including holes (h+), hydroxyl radicals (·OH) and superoxide radicals (O2−•) can be formed. In order to better understand the mechanism of photodegradation of MO over AT-4 under visible-light irradiation, the trapping experiments of active species involved in the photocatalytic reaction are investigated (Fig. 8). In this study, benzoquinone (BQ)[24], ammonium oxalate (AO)[25] and dimethyl sulfoxide (DMSO)[24] acting as the scavengers for O2−•, h+ and •OH radicals are introduced into the photocatalytic process, respectively. From Fig. 8, photocatalytic activities of AT-4 decreased obviously with the addition of BQ (The conversion of MO was 30.4%) and AO (The conversion of MO was 13.1%), and reduced slightly with adding DMSO (The conversion of MO was 84.6%), indicating O2−• and h+ radicals are the main oxidative species.
Based on the above results, a possible photocatalytic mechanism for Ag2O/TiO2 under visible-light irradiation is proposed in Fig. 9. Under irradiation with visible light, only Ag2O can be excited to generate electrons and holes. However, the photogenerated electrons on Ag2O cannot transfer to TiO2 because of the more positive conduction band potential of Ag2O than that of TiO2. Fortunately, Ag2O can be photo-reduced to form metallic Ag under visible light irradiation. The produced metallic Ag contributes to the activity by transporting the SPR excited electrons into CB of TiO2, and then electrons react with O2 to produce O2−•. Meanwhile, holes in the VB of TiO2 can transfer to Ag2O surface due to the heterostructure between TiO2 and Ag2O. The O2−• and holes are directly involved in the oxidized decomposition of MO. In this way, the recombination of electrons and holes pairs is effectively inhibited due to the SPR effect induced by metallic Ag and Ag2O/TiO2 heterostructure, resulting in a higher reaction rate.
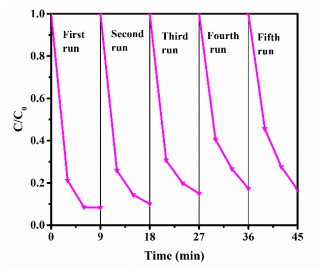
The good repeatability and stability of photocatalysts are beneficial to reduce water treatment costs and avoid secondary pollution. To confirm the stability of AT-4, the circulating runs in the photocatalytic degradation of MO is checked (Fig. 10). The photocatalytic performance of AT-4 is maintained at a high level, indicating good photostability of the as-prepared samples.
In this study, corner-truncated cubic Ag2O decorated TiO2 hollow nanofibers was successfully synthesized through electrospinning combined with precipitation method. The optimal catalyst is AT-4, with which MO can be degraded 93% within 6 min under visible light irradiation. In the case of AT-1, only h-Ag2O was observed, showing the negative effect in photodegradation compared to individual Ag2O. Regarding AT-5, however, excessive c-Ag2O will cover the adsorption sites for MO, leading to a decreased photocatalytic activity related to AT-4. UV-Vis DRS confirms the SPR effect of metallic Ag in Ag2O/TiO2, benefiting the transfer of excited electrons to CB of TiO2. The existence of metallic Ag is evidenced by XRD and XPS analysis of used AT-4. The energy band calculation indicates that the holes can transfer from VB of TiO2 to that of Ag2O due to the successful construction of Ag2O/TiO2 heterostructure. As a result, the separation efficiency of photogenerated carriers is promoted. Scavenger tests demonstrate that O2−• and h+ radicals play the dominant role in the photodegradation of MO. Moreover, AT-4 shows good stability during the photocatalytic reaction, which can be a promising candidate for the photodegradation of dye organic pollution.
Haldorai, Y.; Shim, J. J. An efficient removal of methyl orange dye from aqueous solution by adsorption onto chitosan/MgO composite: a novel reusable adsorbent. Appl. Surf. Sci. 2014, 292, 447–453. doi: 10.1016/j.apsusc.2013.11.158
Robati, D.; Mirza, B.; Rajabi, M.; Moradi, O.; Tyagi, I.; Agarwal, S.; Gupta, V. K. Removal of hazardous dyes-BR 12 and methyl orange using graphene oxide as an adsorbent from aqueous phase. Chem. Eng. J. 2016, 284, 687–697. doi: 10.1016/j.cej.2015.08.131
Yagub, M. T.; Sen, T. K.; Afroze, S.; Ang, H. M. Dye and its removal from aqueous solution by adsorption: a review. Adv. Colloid Interfac. 2014, 209, 172–184. doi: 10.1016/j.cis.2014.04.002
Yagub, M. T.; Sen, T. K.; Ang, H. M. Equilibrium, kinetics, and thermodynamics of methylene blue adsorption by pine tree leaves. Water Air Soil. Pollut. 2012, 223, 5267–5282. doi: 10.1007/s11270-012-1277-3
Gu, Q.; Zhao, W.; Yuan, J. Adsorption and photodegradation behaviors of in-situ growth TiO2 films with various nano-structures. Chem. Phys. Lett. 2019, 736, 136804–136812. doi: 10.1016/j.cplett.2019.136804
Priyanka, K. P.; Sankararaman, S.; Balakrishna, K. M.; Varghese, T. Enhanced visible light photocatalysis using TiO2/phthalocyanine nanocomposites for the degradation of selected industrial dyes. J. Alloy. Compd. 2017, 720, 541–549. doi: 10.1016/j.jallcom.2017.05.308
Dong, R. L.; Na, C.; Zhang, H. P.; Chen, Z. D.; Jin, C. C. TiO2/SiO2 mesoporous microspheres with intelligently controlled texture. Mater. Design 2016, 89830–89838.
Mohaghegh, N.; Kamrani, S.; Tasviri, M.; Elahifard, M.; Gholami, M. Nanoporous Ag2O photocatalysts based on copper terephthalate metal-organic frameworks. J. Mater. Sci. 2015, 50, 4536–4546. doi: 10.1007/s10853-015-9003-3
Wen, X. J.; Niu, C. G.; Zhang, L.; Liang, C.; Zeng, G. M. A novel Ag2O/CeO2 heterojunction photocatalysts for photocatalytic degradation of enrofloxacin: possible degradation pathways, mineralization activity and an in depth mechanism insight. Appl. Catal. B: Environ. 2018, 221, 701–714. doi: 10.1016/j.apcatb.2017.09.060
Sarkar, D.; Ghosh, C. K.; Mukherjee, S.; Chattopadhyay, K. K. Three dimensional Ag2O/TiO2 type-Ⅱ (p–n) nanoheterojunctions for superior photocatalytic activity. Acs. Appl. Mater. Inter. 2012, 5, 331–337.
Zhou, W.; Liu, H.; Wang, J.; Liu, D.; Du, G.; Cui, J. Ag2O/TiO2 nanobelts heterostructure with enhanced ultraviolet and visible photocatalytic activity. ACS Appl. Mater. Inter. 2010, 2, 2385–2392. doi: 10.1021/am100394x
Zhou, W.; Liu, H.; Wang, J.; Liu, D.; Du, G.; Han, S.; Lin, J.; Wang, R. Interface dominated high photocatalytic properties of electrostatic self-assembled Ag2O/TiO2 heterostructure. Phys. Chem. Chem. Phys. 2010, 12, 15119–15123. doi: 10.1039/c0cp00734j
Xu, W.; Wang, S. Q.; Zhang, Q. Y.; Ma, C. Y.; Li, X. N.; Wang, Q.; Wen, D. H. Abnormal oxidation of Ag films and its application to fabrication ofphotocatalytic films with a-TiO2/h-Ag2O heterostructure. J. Phys. Chem. C 2017, 121, 9901–9909. doi: 10.1021/acs.jpcc.7b01229
Yu, C.; Li, G.; Kumar, S.; Yang, K.; Jin, R. Phase transformation synthesis of novel Ag2O/Ag2CO3 heterostructures with high visible light efficiency in photocatalytic degradation of pollutants. Adv. Mater. 2014, 26, 892–898. doi: 10.1002/adma.201304173
Xu, Y.; Lin, D.; Liu, X.; Luo, Y.; Xue, H.; Huang, B.; Qian, Q.; Chen, Q. TiO2 hollow nanofibers grafted Ag/AgCl with more AgCl {111} facet for enhanced photocatalytic activity. Mater. Lett. 2018, 215, 250–253. doi: 10.1016/j.matlet.2017.12.100
Liang, N.; Wang, M.; Jin, L.; Huang, S.; Chen, W.; Xu, M.; He, Q.; Zai, J.; Fang, N.; Qian, X. Highly efficient Ag2O/Bi2O2CO3 p-n heterojunction photocatalysts with improved visible-light responsive activity. ACS. Appl. Mater. Inter. 2014, 6, 11698–11705. doi: 10.1021/am502481z
Parayil, S. K.; Kibombo, H. S.; Wu, C. M.; Peng, R.; Baltrusaitis, J.; Koodali, R. T. Enhanced photocatalytic water splitting activity of carbon-modified TiO2 composite materials synthesized by a green synthetic approach. Int. J. Hydrogen Energy 2012, 37, 8257–8267. doi: 10.1016/j.ijhydene.2012.02.067
He, H.; Miao, Y.; Du, Y.; Zhao, J.; Liu, Y.; Yang, P. Ag2O nanoparticle-decorated TiO2 nanobelts for improved photocatalytic performance. Ceram. Int. 2016, 12, 4297–4302.
Phan, T. N.; Nikoloski A. N.; Bahri, P. A. Facile fabrication of perovskite-incorporated hierarchically mesoporous/macroporous silica for efficient photoassisted-Fenton degradation of dye. Appl. Surf. Sci. 2019, 491, 488–496. doi: 10.1016/j.apsusc.2019.06.133
Sarkar, D.; Ghosh, C. K.; Mukherjee, S.; Chattopadhyay, K. K. Three dimensional Ag2O/TiO2 type-Ⅱ (p-n) nanoheterojunctions for superior photocatalytic activity. ACS Appl. Mater. Inter. 2013, 5, 331–337. doi: 10.1021/am302136y
Hua, H.; Xi, Y.; Zhao, Z.; Xie, X.; Hu, C.; Liu, H. Gram-scale wet chemical synthesis of Ag2O/TiO2 aggregated sphere heterostructure with high photocatalytic activity. Mater. Lett. 2013, 91, 81–83. doi: 10.1016/j.matlet.2012.09.068
Paul, K. K.; Ghosh, R.; Giri, P. K. Mechanism of strong visible light photocatalysis by Ag2O-nanoparticle-decorated monoclinic TiO2(B) porous nanorods. Nanotechnology 2016, 27, 315703–315717. doi: 10.1088/0957-4484/27/31/315703
Zhen, Y.; Wang, J.; Fu, F. The novel Z-scheme ternary-component Ag/AgI/α-MoO3 catalyst with excellent visible-light photocatalytic oxidative desulfurization performance for model fuel. Nanomaterials 2019, 9, 1054–1068. doi: 10.3390/nano9071054
Zheng, W.; Chen, N. N.; Gao, Y. Heterometallic Pb–Ag iodides from 1-D chains to 2-D layers induced by transition metal complex cations: syntheses, crystal structures and photocatalytic properties. Eur. J. Inorg. Chem. 2019, 44, 4752–4759.
Kovacic, M.; Papac, J.; Kusic, H. Degradation of polar and non-polar pharmaceutical pollutants in water by solar assisted photocatalysis using hydrothermal TiO2-SnS2. Chem. Eng. J. 2020, 382, 122826–122838. doi: 10.1016/j.cej.2019.122826

Figure 1 SEM images of (a) PAN/Ti(OiPr)4 composite nanofibers; (b) TiO2 hollow nanofibers; (c) Individual Ag2O and (d) AT-4

Figure 3 XRD patterns of samples: (a) TiO2; (b) AT-1; (c) AT-2; (d) AT-3; (e) AT-4; (f) AT-5; (g) Ag2O

Figure 4 High-resolution XPS spectra of AT-4 (a) Ag, (b) Ti, and (c) O; (d) TEM images of AT-4

Figure 5 (a) Degradation curves and (b) the corresponding reaction rate constants for the photodegradation of MO

Figure 7 (a) XRD patterns and (b) XPS spectra of Ag 3d in used AT-4; (c) UV-vis diffuse reflectance spectra for AT-4 before and after photocatalysis

Figure 9 Photocatalytic mechanism scheme for Ag2O/TiO2 under visible light illumination
Table 1. Performances of Photocatalytic Activity in the Reported Literature
| Photocatalyst | Conc. and volume of MO | Light source | Degradation time (min) | Degradation (%) | Reference |
| Ag2O/TiO2 hollow NFs (100 mg) | 3*10-5 M, 100 mL | Visible | 6 | 93 | Our work |
| 3D Ag2O/TiO2 heterojunction (40 mg) | 10−5 M, 40 mL | UV | 15 | 93 | [20] |
| Ag2O/TiO2 nanobelts (20 mg) | 20 mg/L, 20 mL | Visible | 24 | 80 | [8] |
| Ag2O/TiO2 heterostructure (20 mg) | 20 mg/L, 20 mL | UV | 25 | 100 | [9] |
| Ag2O/TiO2 sphere (20 mg) | 14 mg/L, 50 mL | Simulated sunlight | 60 | 98 | [21] |
| Ag2O/TiO2 nanobelts (10 mg) | 10 mg/L, 20 mL | UV | 20 | 100 | [18] |
| TiO2(B)/Ag2O (20 mg) | 10 mg/L, 100 mL | Visible | 30 | 88 | [22] |
 下载: 导出CSV
Table 2. Values of Calculated X, EVB, ECB, and Eg for Ag2O and TiO2
| Semiconductor | X(eV) | EVB(eV) | ECB(eV) | Eg(eV) |
| Ag2O | 5.30 | 1.39 | 0.21 | 1.18 |
| TiO2 | 5.81 | 2.87 | -0.26 | 3.13 |
下载: 导出CSV

 扫一扫看文章

扫一扫关注我们


