Citation:
Guangjin Li, Jiali Wang, Dongyang Li, Shenghua Liu, Jun Yin, Zhibing Lai, Guangfu Yang. A Hg(Ⅱ)-specific probe for imaging application in living systems and quantitative analysis in environmental/food samples[J]. Chinese Chemical Letters,
2021, 32(4): 1527-1531.
doi:
10.1016/j.cclet.2020.09.040
A Hg(Ⅱ)-specific probe for imaging application in living systems and quantitative analysis in environmental/food samples
English
A Hg(Ⅱ)-specific probe for imaging application in living systems and quantitative analysis in environmental/food samples
Key Laboratory of Pesticide and Chemical Biology, Ministry of Education, Hubei International Scientific and Technological Cooperation Base of Pesticide and Green Synthesis, International Joint Research Center for Intelligent Biosensing Technology and Health, College of Chemistry, Central China Normal University, Wuhan 430079, China
b.
National Key Laboratory of Crop Genetics Improvement, Huazhong Agricultural University, Wuhan 430070, China
Received Date:
15 August 2020 Accepted Date:
23 September 2020 Revised Date:
22 September 2020 Available Online:
15 April 2021
Abstract:
Mercury ions are highly toxic and can accumulate along food chains in water, soil, crops and animals. Effective detection of mercury ions in various media is of great significance for maintaining the ecological environment and protecting people's health. In this work, a mercury ions specific fluorescent probe was developed by a simple one-step reaction of commercial substrates of 4-chloro-7-nitro-2, 1, 3-benzoxadiazole and 1-(2-aminoethyl)-4-methylpiperazine. Investigation on sensing behavior showed that this probe had high sensitivity and selectivity towards mercury ions. Furthermore, this probe could be used as a tool to track the level of mercury ions in living system. In living cells, the probe with green emission emitted a bright red fluorescence when it was bound to mercury ions. In Arabidopsis thaliana, similar red emission could be detected from the root tip and stalk when A. thaliana was grown in culture medium containing mercury ions. The imaging in zebrafish showed that mercury ions were mainly concentrated in the stomach and head of zebrafish. Especially, this probe could be applied in quantitative analysis of mercury ions in tap water, green tea, sea shrimp and soil. This work provided a practical tool for the detection of mercury ions in living systems and quantitative analysis in real samples.
With the rapid development of society, air pollution, soil pollution, water pollution and other environmental problems have become increasingly serious in recent years. Among them, heavy metal pollution exists widely in the nature, and it is one of the main pollution sources that continuously affect the ecological environment [1]. Heavy metal ions can shift from the bottom to the top of the food chain, and eventually accumulate in advanced organisms such as plants and animals [2]. When drinking water or eating food contaminated with heavy metals, they are easy to accumulate in the body because they are difficult to be metabolized. Heavy metal ions can cause a number of serious diseases when the levels in body are high [3]. For example, mercury ions inhibit the activity of enzymes and cause cell dysfunction when they bind to the related enzymes and proteins. Moreover, mercury ions accumulated in the body can also invade the central nervous system of the brain, leading to numbness in limbs, speech disorders, reduced vision, hearing loss and even death [4]. Therefore, it is of great significance to develop rapid, efficient and simple analytical methods for the detection of mercury ions in water, soil, food, plants and animals.
Traditional determining methods of mercury ions mainly include colorimetric method [5], UV–vis spectrophotometry [6], atomic absorption spectrometry [7], atomic fluorescence spectrometry [8], high performance liquid chromatography [9], inductively coupled plasma mass spectrometry [10], inductively coupled plasma atomic emission spectrometry [11], etc. Due to a variety of limitations, e.g., low specificity, poor sensitivity, complicated sample pretreatment, strong interference and time-consuming operation, these approaches are not suitable for detecting mercury ions in living biosystems [12]. In recent years, the fluorescent probes and bioimaging technologies have been rapidly developed and widely applied in the detection of mercury ions in living cells andin vivo [13], due to their advantages of high sensitivity, good selectivity and real-timein-situ detection [14].
For a fluorescent probe with good capability of selectively detecting mercury ions in many media, it is required that probe should have good photostability, low background interference, deep tissue penetrability and multi-media compatibility [15]. Due to excellent performance on photophysical properties, sensing behavior and easy preparation in the field of fluorescent probes, benzoxadiazole- and benzothiadiazole-based chromophores have been frequently used to construct fluorescent probes for the determination of various analytes [16]. Among them, 4-chloro-7-nitro-2, 1, 3-benzoxadiazole (NBD-Cl) was considered as one of the most suitable fluorophores due to its commercial availability and convenient preparation for targeting probes. Based on previous reports and our works [17], herein, we employed the NBD-Cl and 1-(2-aminoethyl)-4-methylpiperazine (MPA) as starting materials to successfully construct a mercury ions-specific fluorescent probe NBD-MPA in this work, and investigated its bioimaging behaviors in living cells, plant, zebrafish and quantitative analysis in real samples such as tap water, green tea, sea shrimp and soil.
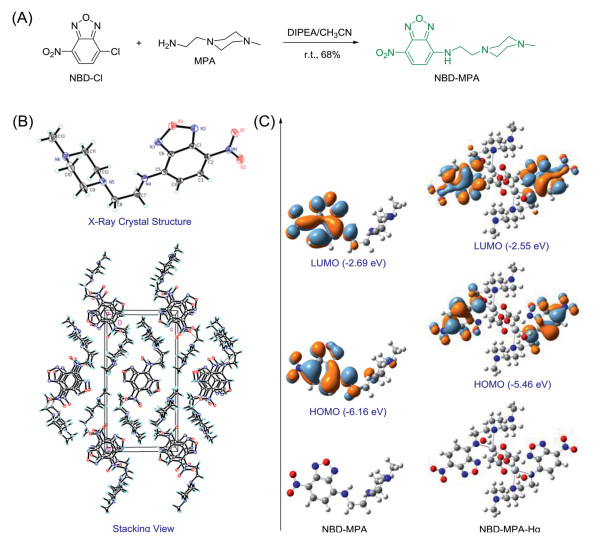
The targeting molecular NBD-MPA was synthesized by synthetic method outlined in Fig. 1A. The commercially available fluorophore NBD-Cl and MPA was employed as the starting materials to carry out the nucleophilic substitution in presence of organic base DIPEA at room temperature, affording the fluorescent probe NBD-MPA in a yield of 68%. Its structure was well defined by NMR and mass spectrometry. To gain further insight into the molecular structure, a single crystal of NBD-MPA suitable for crystallographic analysis was obtained by slow diffusion of hexane into a dichloromethane solution of NBD-MPA. From the crystal structure in Fig. 1B, the fluorophore presented a planar configuration while the piperazine ring showed a stable chair-configuration. More, there were multi hydrogen bond interactions in stacking structure.
Figure 1
Figure 1.
(A) Synthetic method of probe NBD-MPA. (B) Crystal structure and stacking view of probe NBD-MPA. (C) Frontier molecular orbital profiles of probe NBD-MPA and product NBD-MPA-Hg based on TD-DFT (B3LYP/6-31G* and Lanl2dz, respectively) calculations.
The treatment of NBD-MPA with mercury ion generated the complex NBD-MPA-Hg with a ratio of 2:2 in Fig. 1A. To gain initial information about optical property, the theoretical calculations were carried out to gain insight into the frontier molecular orbital electron density distribution. Firstly, we optimized the structure of NBD-MPA by time-dependent density functional theory (TD-DFT) calculations at the B3LYP/6-31G* level with the Gaussian 09 program. As shown in Fig. 1C, NBD-MPA with minimum energy exhibited a similar configuration to crystal structure. According to its the highest occupied molecular orbital (HOMO) and lowest unoccupied molecular orbital (LUMO) transition, a charge transfer was found from piperazine to NBD fluorophore, implying that NBD-MPA was fluorescent. Similar charge transfer was also observed from HOMO and LUMO orbital transitions of NBD-MPA-Hg when it was subjected to carry out the TD-DFT at the Lanl2dz level with the Gaussian 09 program. The result suggested that the complex NBD-MPA-Hg could emit. In comparison to the band gap of probe NBD-MPA (3.47 eV), complex NBD-MPA-Hg (2.91 eV) had a narrower band gap, which indicated that NBD-MPA-Hg had a farther emission.
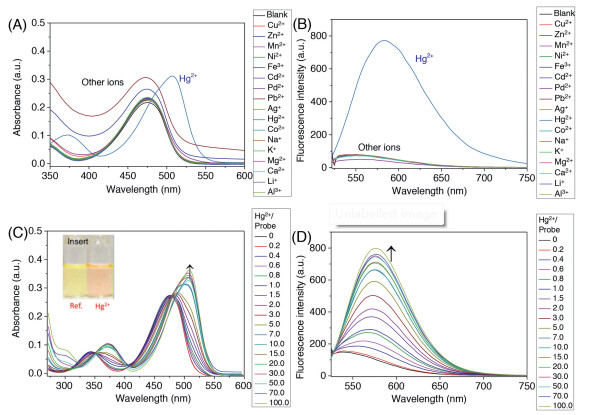
Investigations were carried out to evaluate the selectivity of NBD-MPA for Hg2+. The response of NBD-MPA (10 mmol/L) toward various metal ions was explored first by monitoring the changes of UV–vis absorption and fluorescence spectra in HEPES buffer solution (pH 7.4) containing 10% CH3CN. After mixing probe NBD-MPA with common metal cations (10 equiv.) for 5 min, respectively, their UV–vis absorption and emission spectra were recorded. As shown in Fig. 2A, Hg2+ induced a 30 nm red-shift of absorption peak to reach 510 nm while other metal ions only caused negligible changes of absorption. According to the fluorescence spectra in Fig. 2B, the weak emission of NBD-MPA at 550 nm switched to a sharply enhanced emission at 580 nm only in the presence of Hg2+. These results strongly suggested that probe NBD-MPA possessed a high selectivity towards Hg2+. In addition to selectivity, it was found that NBD-MPA were also strongly resistant to interference from other metal cations (Fig. S1A in Supporting information). Next, investigation on the fluorescence response of NBD-MPA at different pH condition showed that probe NBD-MPA could serve well as a Hg2+-specific fluorescent probe under physiological condition (Fig. S1B in Supporting information), implying that it could be further used to track the Hg2+ in living systems.
Figure 2
Figure 2.
UV–vis absorption spectra (A) and fluorescence spectra (B) of probe NBD-MPA (10 μmol/L) in the presence of different metal ions (100 μmol/L) in CH3CN/HEPES (1/9 (v/v), pH 7.4) solution. UV–vis absorption spectra (C) and fluorescence spectra (D) of probe NBD-MPA (10 μmol/L) upon different concentration of Hg2+ (0–100.0 μmol/L) in CH3CN/HEPES (1/9 (v/v), pH 7.4) solution (λex=510 nm; Slit: 5×10).
Subsequent studies were conducted to determine the effect of Hg2+ concentration for the detection of Hg2+ by NBD-MPA. As shown in Fig. 2C, with the increase of Hg2+, a new absorption peak at 510 nm appeared and accompanied by the color changes from yellow to pink. The isoabsorptive point locating at 480 nm implied a decrease of free NBD-MPA and the generation of a new specie. Likewise, a gradual enhanced fluorescence was detected when the concentration of Hg2+ increased in Fig. 2D. Subsequently, we found that the Na2S could induce the reversible changes of UV–vis absorption (Fig. S2A in Supporting information) and fluorescence spectra (Fig. S2B in Supporting information) when it was added to the HEPES buffer solution (pH 7.4) of complex NBD-MPA-Hg containing 10% CH3CN, ascribing to the dissociation of Hg-complex. The reversible coordination and dissociation were helpful for the quantitative analysis. The Job's plot (Fig. S3 in Supporting information) showed the simplest stoichiometric ratio of 1:1 coordination between NBD-MPA and Hg2+, which was well in agreement with the theoretical calculation. And the lowest detection limit of 9.2 × 10⁻⁷ mol/L was calculated based on the linear fitting results (Fig. S4A in Supporting information). Based on the described above, a non-linear fitting (Fig. S4B in Supporting information) on the fluorescence intensity at 580 nm was carried out to obtain the 1:1 coordination of NBD-MPA with Hg 2+. The calculation results showed that the binding constant ks was 5.8×10⁴L/mol, whose corresponding R2 equaled to 0.99.
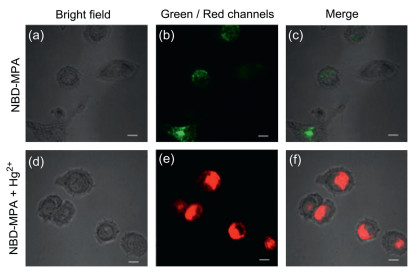
The investigation on Hg-response in vitro showed that probe NBD-MPA had a capability of determining the level of Hg2+ in living cells. For this purpose, we firstly evaluated the cytotoxicity of NBD-MPA through a standard MTT assay. After incubating human lung cancer cell A549 with 1, 5, 10, 20, and 100 μmol/L of NBD-MPA for 24h, the cell viability was measured with a microplate reader. The result of over 90% survival rate indicated that probe NBD-MPA had low cytotoxicity (Fig. S5 in Supporting information). Next, the feasibility of utilizing NBD-MPA for fluorescence imaging of Hg2+ in living cells was explored. Accordingly, A549 cells were incubated with 10 μmol/L NBD-MPA for 30min. As could be seen by viewing the confocal fluorescence microscope images in Figs. 3a–c, a green fluorescence signal was observed through collecting the emission of 500–550 nm upon irradiation of 488 nm light, which was consistent with the observation in vitro. Another group of A549 cells were incubated with Hg2+ (100 μmol/L) for 30min and then NBD-MPA (10 μmol/L) for 30min, respectively. Bright red fluorescence at 570–620 nm (488 nm excitation) was emitted from the cells in Figs. 3d–f, as a result of the formation of complex NBD-MPA-Hg with a red emission. These observations strongly indicated that probe NBD-MPA could permeate into the cells well and track the intracellular Hg2+.
Figure 3
Figure 3.
Confocal microscopy images of A549 cells. Incubated only with probe NBD-MPA (10 μmol/L) for 30min: Bright field (a), green channel at 500–550 nm (b) and the merged (c) image. Incubated with Hg2+ (100 μmol/L) for 30min and probe NBD-MPA (10 μmol/L) for 30min, respectively: Bright field (d), red channel at 570–620 nm (e) and the merged (f) image. Scale: 10 μm.
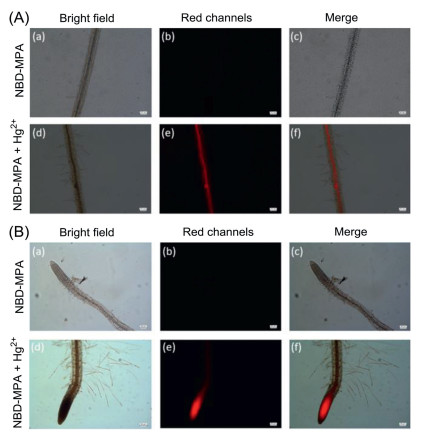
Based on the fact that Hg2+ can be transferred from water and soil to the plants and animals, further studies focused on the application in detecting the Hg2+ level in living biological systems. As a model plant, A. thaliana was selected to carry out the detection of Hg2+ by fluorescence microscope. For this purpose, 10-day-old A. thaliana was selected as an imaging model. By viewing the stem of A. thaliana under fluorescence microscope in Fig. 4A, no obvious fluorescence was found when the A. thaliana was only incubated with NBD-MPA. However, a bright red fluorescence was observed when the 10-day-old A. thaliana was firstly pretreated in an aqueous solution containing Hg2+ (1 mmol/L) for 24h and then incubated with NBD-MPA (10 μmol/L). Similar phenomena were also obtained from the roots of A. thaliana through carrying out the same imaging, as presented in Fig. 4B. These investigations clearly suggested that probe NBD-MPA possessed a remarkable capability of smoothly passing through plant cell walls and cell membranes to track the Hg2+ in plant. These results indicated that NBD-MPA can serve as an effective tool for tracing mercury ions in the process of Hg2+ transfer from water, soil to crops.
Figure 4
Figure 4.
Fluorescence microscope images of the stem (A) and root (B) of A. thaliana. Upper: Incubated only with probe NBD-MPA (10 μmol/L) for 24h; Lower: Incubated with Hg2+ (1 mmol/L) for 24h and probe NBD-MPA (10 μmol/L) for 24h. Bright field (a, d), red channel (b, e) and the merged (c, f) image. Scale bar: 50 μm.
Subsequently, we investigated the imaging of NBD-MPA in vivo by employing an ideal animal mode of Zebrafish. The 3-day-old zebrafish were incubated with NBD-MPA (5 μmol/L) for 20min before being incubated in pure water for 2h. By viewing the images from fluorescence microscope, no obvious fluorescence signal in red channel was detected (Fig. S6 in Supporting information). Next, the same 3-day-old zebrafish were firstly pretreated in an aqueous solution of Hg2+ (20 μmol/L) for 2h, and then incubated with NBD-MPA (5 μmol/L) for 20min. And it was clearly found that the head of zebrafish showed a distinguishable fluorescence enhancement compared to zebrafish in the absence of Hg2+. Accordingly, probe NBD-MPA as a Hg2+-specific fluorescence indicator had a wide range of applications in living cells containing cells, plants and animals.
To further verify the practicability of the probe NBD-MPA, we tested the mercury content in tap water, green tea and sea shrimp by standard addition method. Green tea and sea shrimp were pretreated according to a reported method outlined in Supporting information while tap water was directly used without further treatment. The aqueous solutions of real samples and CH3CN were mixed to form a mixture solution of CH3CN/H2O (1/9 (v/v)). In the Hg2+ range of 0–20 μmol/L, their fluorescence intensity upon the excitation of 510 nm increased linearly depending on the concentration of Hg2+ (Figs. S7–S9 in Supporting information). The calculated results were listed in Tables S1–S3 (Supporting information). The relative standard deviation (RSD) of all data was less than 0.8%, which indicated that probe NBD-MPA had a good stability of responding to Hg2+. Except the over 10% relative error of individual datum, most of the testing results revealed that the relative errors were below 5%. And their recovery rates also exhibited the good results. All tests on real samples intensively showed that the probe NBD-MPA possessed good performance of analyzing the level of heavy metal Hg2+ in water and food.
Just as mercury ions can exist widely in water, food and soil. Subsequently, we directly tested the mercury content in the contaminated soil after pretreatment. The process of pretreatment was described in Supporting Information. The results showed that the fluorescence intensity gradually increased with the increase of soil content (Fig. S10A in Supporting information). Particularly, the changes of fluorescence intensity at 580 nm had a good linearity in a suitable range (Fig. S10B in Supporting information). The testing results indicated that NBD-MPA had an excellent capability of detecting mercury in soil.
In summary, a versatile fluorescent probe for the specific response of mercury ion was developed in this work. The mercury ions could induce it emitted a red emission without any interference from background, which supported that probe could be applied in detecting the level of mercury ions in living cells, A. thaliana and zebrafish. Specially, this probe had a capability of quantitative analysis for measuring the concentration of water, food and soil. This work successfully established a detecting platform of mercury ions along a food chain containing water, soil, food, plants and animals. We believe it will have a widely potential application in the field of ecological environment.
Declaration of competing interest
The authors report no declarations of interest.
Acknowledgments
This work was supported by the National Natural Science Foundation of China (Nos. 21676113, 21772054), Distinguished Young Scholar of Hubei Province (No. 2018CFA079), 111 Project (No. B17019), Scholar Support Program of CCNU (No. 0900-31101090002), the excellent doctoral dissertation cultivation grant of CCNU from the colleges' basic research and operation of MOE (No. 2019YBZZ029).
(a) J.A. Caruso, B. Klaue, B. Michalke, et al., Ecotox. Environ. Saf. 56 (2003) 32-44; (b) T.T. Shih, W.Y. Tseng, K.H. Tsai, et al., Microchem. J. 99 (2011) 260-266.
[11]
(a) S. Saracoglu, M. Soylak, D.K. Peker, et al., Anal. Chim. Acta 575 (2006) 133-137; (b) Y. Boukraa, D. Barkat, T. Benabdellah, et al., Phys. Chem. Liq. 44 (2006) 693-700.
[12]
(a) F. Deng, Z. Xu, Chin. Chem. Lett. 30 (2019) 1667-1681; (b) D. Wu, L. Chen, W. Lee, et al., Coord. Chem. Rev. 354 (2018) 74-97; (c) J. Yin, Y. Hu, J. Yoon, Chem. Soc. Rev. 44 (2015) 4619-4644.
[13]
(a) L. Yu, Y. Qiao, L. Miao, et al., Chin. Chem. Lett. 29 (2018) 1545-1559; (b) H.N. Kim, W.X. Ren, J.S. Kim, et al., Chem. Soc. Rev. 41 (2012) 3210-3244; (c) P.R. Sahoo, K. Prakash, S. Kumar, Coord. Chem. Rev. 357 (2018) 18-49; (d) G. Zhu, C. Zhang, Analyst 139 (2014) 6326-6342; (e) Q. Zhao, F. Li, C. Huang, Chem. Soc. Rev. 39 (2010) 3007-3030; (f) X. Ma, L. Hu, X. Han, et al., Chin. Chem. Lett. 29 (2018) 1489-1492; (g) W. Chen, Y. Pan, J. Chen, et al., Chin. Chem. Lett. 29 (2018) 1429-1435.
[14]
(a) L. Li, Y. Chen, W. Chen, et al., Chin. Chem. Lett. 30 (2019) 1689-1703; (b) Y. Chen, L. Li, W. Chen, et al., Chin. Chem. Lett. 30 (2019) 1353-1360; (c) H. Xiao, W. Zhang, P. Li, et al., Angew. Chem. Int. Ed. 59 (2020) 4216-4230; (d) S. Park, N. Kwon, J. Lee, et al., Chem. Soc. Rev. 49 (2020) 143-179; (e) A. Aliyan, N.P. Cook, A.A. Marti, Chem. Rev. 119 (2019) 11819-11856; (f) H. Singh, K. Tiwari, R. Tiwari, et al., Chem. Rev. 119 (2019) 11718-11760; (g) Y. Wen, F. Huo, C. Yin, Chin. Chem. Lett. 30 (2019) 1834-1842; (h) M. Yang, J. Fan, J. Du, et al., Chem. Sci. 11 (2020) 5127-5141; (i) W. Chi, Jie Chen, W. Liu, et al., J. Am. Chem. Soc. 142 (2020) 6777-6785.
[15]
(a) J. Zhu, P. Jia, N. Li, et al., Chin. Chem. Lett. 29 (2018) 1445-1450; (b) Z. Lei, X. Li, X. Luo, et al., Angew. Chem. Int. Ed. 56 (2017) 2979-2983; (c) J. Zhu, X. Liu, J. Huang, et al., Chin. Chem. Lett. 30 (2019) 1767-1774.
(a) X. Han, X. Lv, Z. Chen, et al., Chin. J. Chem. 33 (2015) 1064-1068; (b) G. Li, Y. Guan, F. Ye, et al., Spectrochim. Acta A: Mol. Biomol. Spectrosc. 239 (2020); (c) Y. Zhang, H. Chen, D. Chen, et al., Sens. Actuators B: Chem. 224 (2016) 907-914; (d) S. Oh, J. Jeon, J. Jeong, et al., Anal. Chem. 92 (2020) 4917-4925; (e) J.J. Lee, Y.S. Kim, E. Nam, et al., Dalton Trans. 45 (2016) 5700-5712; (f) Y. Liu, M. Chen, T. Cao, et al., J. Am. Chem. Soc. 135 (2013) 9869-9876; (g) Z. Guo, W. Zhu, L. Shen, et al., Angew. Chem. Int. Ed. 46 (2007) 5549-5553; (h) J. Du, J. Fan, X. Peng, et al., Org. Lett. 12 (2010) 476-479; (i) Y. Zhang, W. Shi, D. Feng, et al., Sens. Actuators B: Chem. 153 (2011) 261-265; (j) A. CosKun, E.U. Akkaya, J. Am. Chem. Soc. 128 (2006) 14474-14475; (k) E.M. Nolan, S.J. Lippard, J. Am. Chem. Soc. 125 (2003) 14270-14271; (l) X. Zhang, Y. Xiao, X. Qian, Angew. Chem. Int. Ed. 47 (2008) 8025-8029; (m) G. Feng, Y. Ding, Z. Gong, et al., Anal. Sci. 29 (2013) 735-740; (n) L. Tang, H. Yu, K. Zhong, et al., RSC Adv. 9 (2019) 23316-23323.
Figure 1
(A) Synthetic method of probe NBD-MPA. (B) Crystal structure and stacking view of probe NBD-MPA. (C) Frontier molecular orbital profiles of probe NBD-MPA and product NBD-MPA-Hg based on TD-DFT (B3LYP/6-31G* and Lanl2dz, respectively) calculations.
Figure 2
UV–vis absorption spectra (A) and fluorescence spectra (B) of probe NBD-MPA (10 μmol/L) in the presence of different metal ions (100 μmol/L) in CH3CN/HEPES (1/9 (v/v), pH 7.4) solution. UV–vis absorption spectra (C) and fluorescence spectra (D) of probe NBD-MPA (10 μmol/L) upon different concentration of Hg2+ (0–100.0 μmol/L) in CH3CN/HEPES (1/9 (v/v), pH 7.4) solution (λex=510 nm; Slit: 5×10).
Figure 3
Confocal microscopy images of A549 cells. Incubated only with probe NBD-MPA (10 μmol/L) for 30min: Bright field (a), green channel at 500–550 nm (b) and the merged (c) image. Incubated with Hg2+ (100 μmol/L) for 30min and probe NBD-MPA (10 μmol/L) for 30min, respectively: Bright field (d), red channel at 570–620 nm (e) and the merged (f) image. Scale: 10 μm.
Figure 4
Fluorescence microscope images of the stem (A) and root (B) of A. thaliana. Upper: Incubated only with probe NBD-MPA (10 μmol/L) for 24h; Lower: Incubated with Hg2+ (1 mmol/L) for 24h and probe NBD-MPA (10 μmol/L) for 24h. Bright field (a, d), red channel (b, e) and the merged (c, f) image. Scale bar: 50 μm.

 DownLoad:

 下载:
下载:


