Citation:
Yuxin Wang, Zhengxuan Song, Yutao Liu, Yang Chen, Jinping Li, Libo Li, Jia Yao. Methyl functionalization of trimesic acid in copper-based metal-organic framework for ammonia colorimetric sensing at high relative humidity[J]. Chinese Chemical Letters,
2024, 35(6): 108779.
doi:
10.1016/j.cclet.2023.108779
Methyl functionalization of trimesic acid in copper-based metal-organic framework for ammonia colorimetric sensing at high relative humidity
English
Methyl functionalization of trimesic acid in copper-based metal-organic framework for ammonia colorimetric sensing at high relative humidity
College of Chemical Engineering and Technology, Shanxi Key Laboratory of Gas Energy Efficient and Clean Utilization, Taiyuan University of Technology, Taiyuan 030024, China
b.
Department of Gastroenterology, Shanxi Bethune Hospital, Shanxi Academy of Medical Sciences, Tongji Shanxi Hospital, Third Hospital of Shanxi Medical University, Taiyuan 030024, China
Received Date:
29 March 2023 Accepted Date:
05 July 2023 Revised Date:
06 June 2023 Available Online:
15 June 2024
Abstract:
Exhaled ammonia (NH3) can be used as a crucial biomarker of kidney and liver diseases. However, the high humidity in the detection conditions remains a challenge for accurate detection by gas sensors. Herein, a copper-based metal-organic framework (CH3-Cu-BTC) with methyl (CH3-) functionalization of trimesic acid was synthesized for NH3 colorimetric sensing. The CH3-Cu-BTC exhibited a strong response for 5 ppm NH3 with high selectivity under high relative humidity (75% RH). Density functional theory (DFT) simulations indicated that the NH3 molecules interacted more strongly with CH3-Cu-BTC than H2O molecules did, and the corresponding color switching was attributed to the lone-pair electron in NH3 changing the coordination environment of Cu2+ ions, leading to an obviously visible color switching response from ruby green to blue. Based on the tailor-made pore chemistry, the precise detection of trace amounts of NH3 in exhaled air was realized through functionalized MOF materials. The strategy used in this study not only offers a new pathway for the rapid detection of low concentration NH3 under humid conditions, but also shows a method for early respiration diagnosis of kidney and liver diseases.
Ammonia (NH3), a colorless gas with a pungent odor, in recent years, it has been confirmed to be a biomarker of kidney and liver diseases [1-3]. According to related report, the NH3 amount in the exhaled air of healthy people is about 0.05–1.5 ppm [4-6], whereas that in the exhaled air of kidney patients is 0.8–15 ppm and liver patients is about 1.9–4.8 ppm [7-9]. Through accurate detection of the NH3 concentrations will provide a non-invasive and convenient approach for early diagnosis of kidney diseases and for real-time physiological monitoring. In previous studies, NH3 detection generally relied on device-complex electrochemical sensing [10-15], however, the high humidity in exhaled air (~90% relative humidity) has a significant impact on the sensitivity and veracity [16,17]. Thus, due to the requirements for rapid, simple and high humidity anti-interference, colorimetric sensing materials with naked-eye observation have gradually developed [18].
Among porous materials, benefiting from huge specific surface area [19,20], open metal sites [21-23], and designable frameworks [24-27], metal-organic frameworks (MOFs) have been extensively studied in the fields of gas sensing with naked-eye color switching [28,29]. In the past decade, researchers have realized the colorimetric sensing of NH3 by adding chromophoric ligands in MOFs [30,31] or by transforming the metal center coordination environment [32,33]. Among them, FJU-56a demonstrates good selectivity and sensitivity for NH3 sensing in competitive adsorption tests of H2O and NH3 [34]. Mn-BDC and SA/Co-MOF composite films show a noticeable color change on exposure to NH3 and no color change when they are stored at 90% and 75% RH without NH3 [35,36]. However, NH3 detection at high humidity is still blank, which is because of the similar properties of H2O and NH3 molecules in terms of polarity and coordination, the competitive adsorption between H2O and NH3 will cause a remarkable influence on NH3 sensing.
Hence, the main challenge in the real-time monitoring of the NH3 content in exhaled breath is to find a balance between the selectivity and sensitivity of the NH3 sensing MOF materials under high humidity conditions. We noticed that the Cu2+ ions of Cu-BTC would establish a discriminate strong interactions with NH3, resulting in an obvious color switching, thus provided a feasible path for low concentration NH3 sensing [37,38]. And if methyl (CH3-) functionalized organic linkers could precisely introduced in Cu-BTC that would change the distribution of electron clouds and improve the hydrophobicity of Cu-BTC, also strengthen nitrogen-containing species adsorption and show great selectivity for NH3 in the co-adsorption of H2O and NH3 [39-42]. Herein, CH3-Cu-BTC was constructed for a detailed study. Excitingly, compared to Cu-BTC, the introduction of CH3-changes the topology (from tbo to fmj) and electron cloud density, and CH3-Cu-BTC exhibits strong NH3 detection ability with an excellent response for 5 ppm NH3. In addition, the interaction with NH3 molecules are able to changes the coordination environment of Cu2+ ions and causes color switching at high humidity conditions. Further, the electrostatic potential difference was identified by performing density functional theory (DFT) simulations, and the NH3 molecules were determined to have stronger interactions than H2O molecules with CH3-Cu-BTC. Therefore, through a facile pretreatment, the precise detection of trace amounts of NH3 in a patient's exhaled air was realized on the tailor-made MOF material, and this provides an innovative strategy for the early respiration diagnosis of kidney and liver diseases.
All reagents and solvents were obtained from commercial sources and used without further purification. CH3-Cu-BTC was synthesized by the method reported previously [43].
Synthesis of CH3-Cu-BTC: Copper nitrate trihydrate (72.48 mg, 0.3 mmol), methyl-1,3,5-benzenetricarboxylic acid (44.80 mg, 0.2 mmol), ethanol (3 mL), and deionized water (3 mL) were mixed in the Teflon reactor at 120 ℃ for 14 h, and then, ruby green crystals were obtained.
Powder X-ray diffraction (PXRD) patterns were collected on a Bruker D8 ADVANCE X-ray diffractometer using Cu Kα radiation. N2 adsorption–desorption isotherms were recorded at 77 K on a Micromeritics ASAP 2460 instrument. Thermogravimetric analysis (TGA) was carried out in a N2 atmosphere (N2 flow rate: 100 mL/min) at a heating rate of 5 K/min using a TGA-50 (Shimadzu) thermogravimetric analyzer. Scanning electron microscopy (SEM) images were obtained using a Hitachi SU8010 scanning electron microscope. Fourier transform infrared spectroscopy (FT-IR) was performed using a Thermo Electron NEXUS 670. Ultraviolet-visible spectroscopy (UV–vis) was conducted using a Perkin-Elmer Model Lambda 650 spectrometer, with a BaSO4 plate as the standard.
DFT calculations were used to identify the electrostatic potential difference and binding sites in CH3-Cu-BTC. DFT calculations were employed using the Dmol3 and sorption module in Material Studio software. A semiempirical addition of dispersive forces to conventional DFT was included in the calculation to account for van der Waals interactions. During the DFT simulation, the structure of CH3-Cu-BTC was first optimized, and then, the H2O or NH3 molecules were introduced to their potential locations in the MOF; this was followed by full structural relaxation.
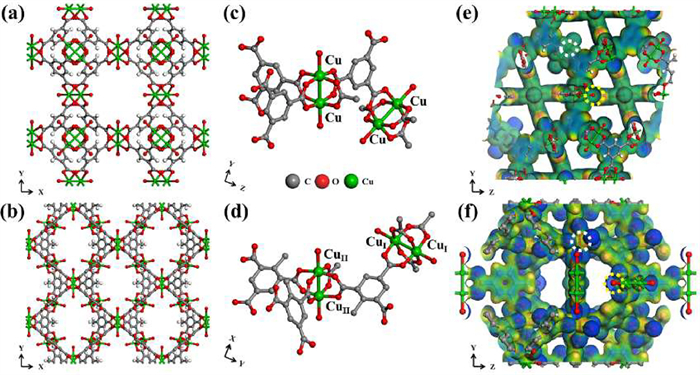
The functionalization of MOF is accompanied by morphology changes: CH3-Cu-BTC presents the fmj (orthorhombic crystal system) topology while Cu-BTC is the tbo (twisted boracite-type, cubic) topological structure (Figs. 1a and b). In the basic structural units of Cu-BTC and CH3-Cu-BTC, each Cu ion forms coordination bonds with four oxygen atoms from carboxyl groups and a H2O molecule bonds to the metal site (Figs. 1c and d). Further, two types of metal center were found in CH3-Cu-BTC: CuI and CuII are linked to carboxyl groups located in the para- and ortho-positions of the methyl functional group, respectively. As shown in Figs. 1e and f, CH3-Cu-BTC exhibits a much lower electron cloud density at Cu2+ sites and exhibits the distinct electron-rich (highlighted in yellow) and electron-poor sites (highlighted in white). These originate from the inductive effect and conjugative effect of CH3-groups; thus, the Cu2+ sites are more accessible to accept the lone-pair electron in NH3, which will change the metal center coordination environment and cause more sensitive color switching.
Figure 1
Figure 1.
Crystal structure of (a) Cu-BTC and (b) CH3-Cu-BTC. Coordination environment of Cu atoms in (c) Cu-BTC and (d) CH3-Cu-BTC. Electrostatic potential patterns of (e) Cu-BTC and (f) CH3-Cu-BTC (blue-to-red colors indicate the high-to-low transition of electron density).
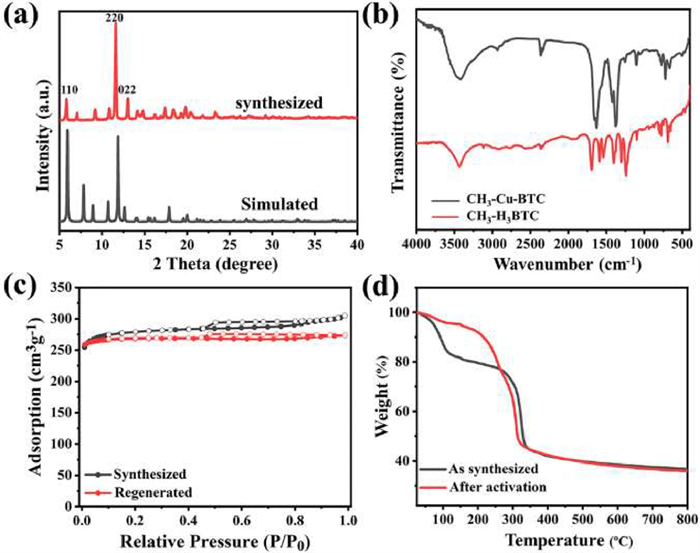
CH3-Cu-BTC exhibited diamond-shaped octahedral crystals (Figs. S1a and b in Supporting information) though solvent thermal synthesis method, and the PXRD pattern of the CH3-Cu-BTC powder was consistent with reported results (Fig. 2a) [43]. Through the test of FT-IR spectra on the CH3-Cu-BTC powder, strong characteristic bands of CH3-Cu-BTC were located at 1629 and 1377 cm−1 (Fig. 2b), corresponding to the stretching vibration of the C=O bond from the deprotonated trimesic acid and the stretching vibration of the C=C bond, respectively. To evaluate the porosity of CH3-Cu-BTC, the as-synthesized samples were exchanged with ethanol several times and activated at 170 ℃ for 10 h under a high vacuum; then, the N2 adsorption isotherms at 77 K around 1 atm were measured (Fig. 2c). The Brunauer-Emmett-Teller (BET) surface area was calculated as 1106 m2/g, in agreement with previously reported results. The thermal stability of CH3-Cu-BTC was investigated using TGA techniques, and the results showed that CH3-Cu-BTC could be stable up to 300 ℃ under inert gas flow (Fig. 2d).
Figure 2
Figure 2.
(a) PXRD pattern of CH3-Cu-BTC. (b) FT-IR spectra of CH3-Cu-BTC and CH3-H3BTC. (c) N2 sorption isotherms of as-synthesized and NH3 regenerated CH3-Cu-BTC at 77K. (d) TGA curves of CH3-Cu-BTC under N2 flow.
Benefiting from the strong binding affinity between Cu2+ ions and NH3 molecules, CH3-Cu-BTC is expected to be a good candidate for trace NH3 colorimetric sensing. To explore the performance of CH3-Cu-BTC for NH3 detection, CH3-Cu-BTC was exposed to ammonia vapor by the static volumetric method. Excitedly, the prepared CH3-Cu-BTC showed different colors after exposure to different NH3 concentrations, which could be further exploited in gas sensor applications due to the sensitive detection capability and visible color change.
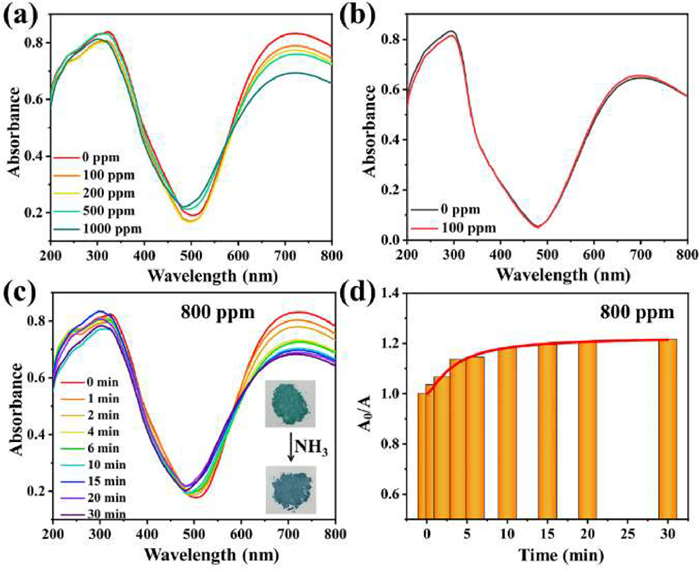
Digital photographs clearly show the color switching that occurs on exposure to NH3 with different concentrations: the color of CH3-Cu-BTC changed from ruby green to blue in varying degrees (Fig. S2 in Supporting information). Fig. 3a shows the UV–vis diffuse reflectance spectra (UV–vis DRS) of CH3-Cu-BTC after exposure to different NH3 concentrations (100–1000 ppm). In this work, the absorbance of CH3-Cu-BTC at 320 nm resulted from the CH3-H3BTC, whereas the higher absorbance at 650–750 nm was on account of the coordination of Cu2+ ions and CH3-H3BTC (Fig. S3 in Supporting information). The absorbance decreased obviously at 650–750 nm with increasing NH3 concentration, which was because the coordination environment of Cu2+ ions changed with NH3 adsorption. Furthermore, the absorbance of Cu-BTC after exposure to 100 ppm NH3 barely differed from the original (Fig. 3b), which means that the CH3-functionalization of Cu-BTC ligands greatly improves the NH3 adsorption performance.
Figure 3
Figure 3.
(a) UV–vis DRS of CH3-Cu-BTC after exposure to different NH3 concentrations for 5 min. (b) UV–vis DRS of Cu-BTC before and after exposure to NH3 (100 ppm) for 5 min. (c) UV–vis DRS of CH3-Cu-BTC exposed to NH3 for different periods. (d) A0/A curve for different periods, where A0 is the CH3-Cu-BTC absorbance at 720 nm before exposure to NH3, A is CH3-Cu-BTC absorbance at 720 nm after exposure to NH3.
FT-IR spectra were used to verify the interaction between CH3-Cu-BTC and NH3, and a new double band at 3200 and 3350 cm−1 (bending vibration of the NH2 group) was found when the sample was exposed to NH3, indicating the strong combination between CH3-Cu-BTC and NH3 (Fig. S4 in Supporting information) [44,45]. Furthermore, the PXRD patterns and N2 sorption of the CH3-Cu-BTC powder adsorbed NH3 and regenerated were compared, and the results show that the structure of the samples remain stable upon NH3 adsorption (Fig. S5 in Supporting information and Fig. 2c). The morphology of CH3-Cu-BTC also remains unchanged after NH3 adsorption and desorption, demonstrating the stability of the material upon NH3 adsorption (Figs. S1c-j in Supporting information).
The solid UV–vis DRS of CH3-Cu-BTC in an NH3 atmosphere were used to record the time-dependent color switching process at room temperature (30 ℃) (Fig. 3c and Fig. S6 in Supporting information). The digital images show that the colors of CH3-Cu-BTC differ between 0 and 30 min (illustration in Fig. 3c and Fig. S7 in Supporting information). Fig. 3d shows the color switching trend: the sample reacted immediately when contact with NH3 was initiated and completed the color switching at 4 min. Here, A0 is the CH3-Cu-BTC absorbance at 720 nm before exposure to NH3, and A is the CH3-Cu-BTC absorbance at 720 nm after exposure to NH3.
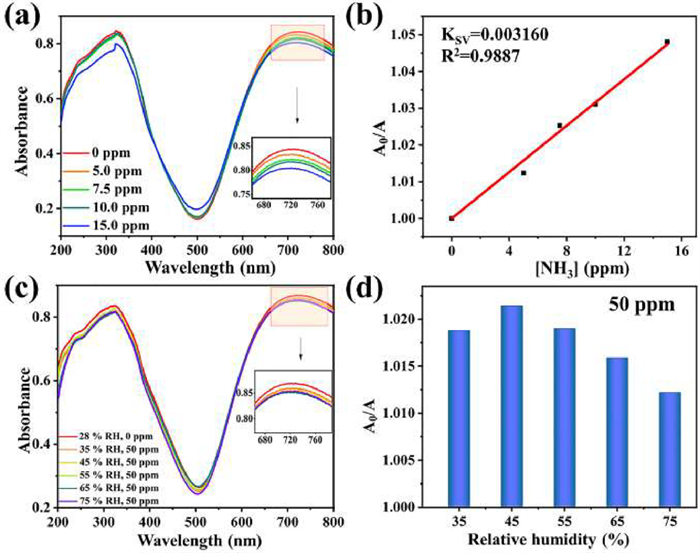
In order to identify the limit of detection of CH3-Cu-BTC for NH3 sensing, the solid UV–vis DRS of CH3-Cu-BTC exposed to different NH3 concentrations (0–15 ppm) were used to study the color switching process (Fig. 4a). Satisfactorily, the CH3-Cu-BTC displayed a significant response toward NH3 even when the concentration was decreased to 5 ppm. The plot of absorbance shifts at 720 nm with varying NH3 concentrations is shown in Fig. 4b. The calculated KSV is 0.003160 ppm−1 and R2 is 0.9887, which are conform to the Stern-Volmer equation (Eq. 1) and comparable to the values for previously reported fluorescence and colorimetric NH3 sensors [46,47].
(1)
Figure 4
Figure 4.
(a) UV–vis DRS of CH3-Cu-BTC after exposure to NH3 with different concentrations. (b) A0/A curve versus NH3 concentrations. (c) UV–vis DRS of CH3-Cu-BTC after exposure to 50 ppm NH3 with different relative humidity. (d) A0/A curve versus relative humidity.
Various NH3 concentrations were created by the static volumetric method (Fig. S8 in Supporting information), which inevitably involved water vapor in the device. To exclude the influence of H2O molecules and evaluate the selectivity, CH3-Cu-BTC was exposed to high humidity conditions (75% RH) without NH3. The UV–vis DRS clearly showed that the sample remained almost unchanged on exposure to water vapor (Fig. S9 in Supporting information), which demonstrated that the color response can be almost entirely attributed to NH3 rather than to H2O. The UV–vis DRS of CH3-Cu-BTC exposed to 50 ppm NH3 with different relative humidity were used to determine the selectivity (Fig. 4c). As shown in Fig. 4d, the absorbance of the sample remains largely unchanged when the relative humidity reaches up to 55%, and still exhibited obvious response even the relative humidity increased to 75%. The absorbance decrease at 75% RH can be attributed to a large amount of H2O molecules significantly blocking the interaction between NH3 and Cu2+ ions, and the kinetic diffusion of NH3 molecules (Fig. S10 in Supporting information). Compared with other reported MOF for NH3 sensing with naked-eye color switching, CH3-Cu-BTC demonstrates excellent performance for the trace NH3 detection under high humidity conditions (Fig. S11 in Supporting information).
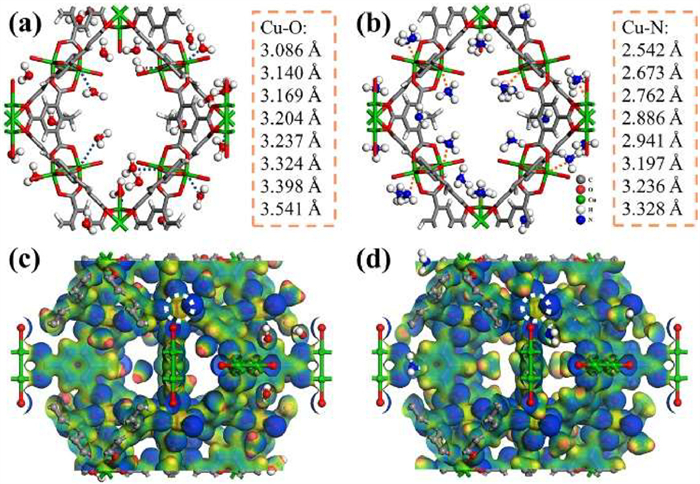
DFT simulations were used to further study the thermodynamic affinities of H2O and NH3 to CH3-Cu-BTC. In order to clearly identify the adsorption sites, H2O and NH3 molecules were introduced into the structure separately. As expected, after the adsorption equilibrium was reached, both molecules exhibited a binding affinity toward the Cu2+ ions. The distance between NH3 and Cu2+ ions was shorter than that between H2O and Cu2+ ions, which indicated that NH3 had a stronger interaction with the Cu2+ ions (Figs. 5a and b). In addition, NH3 also showed a lower binding energy (−45.10 kJ/mol) than H2O (−34.56 kJ/mol).
Figure 5
Figure 5.
(a) H2O and (b) NH3 adsorption sites in CH3-Cu-BTC identified using DFT calculations. Change in electrostatic potential patterns of CH3-Cu-BTC after the adsorption of (c) H2O or (d) NH3.
To prove that the color switching is caused by changing the coordination environment of the Cu2+ ions, DFT calculations were performed to determine the electrostatic potential of the CH3-Cu-BTC adsorbed H2O and NH3. As shown in Fig. 5c, after H2O adsorption, the electrostatic potential of the Cu2+ ions remains almost unchanged (highlighted in white), indicating that H2O molecules do not affect the coordination environment of metal sites and thus do not cause color switching of CH3-Cu-BTC. However, as shown in Fig. 5d, after NH3 adsorption, the electrostatic potential of the Cu2+ ions changes significantly, indicating the stronger interaction between NH3 and Cu2+ ions and the transformation of the coordination environment in CH3-Cu-BTC. Thus, according to the calculation results, NH3 molecules show obvious advantage in the competitive adsorption at high humidity conditions, which will confirm the former color switching.
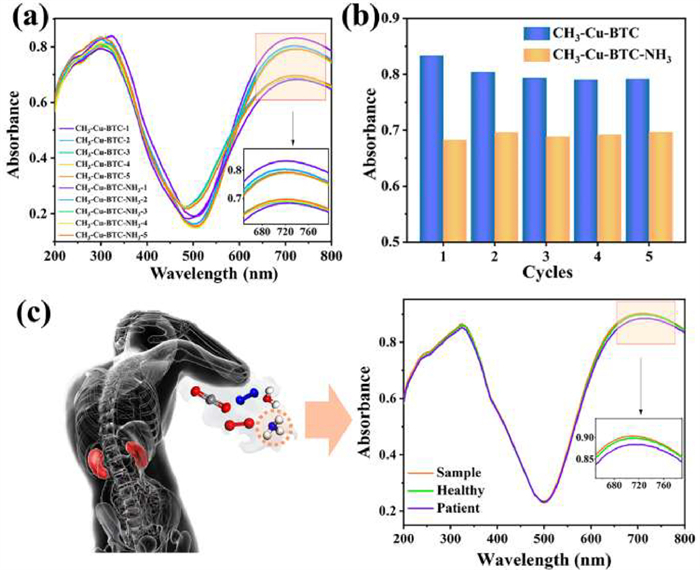
To investigate the stability of CH3-Cu-BTC, PXRD tests were performed with the MOF powder exposed to air for different durations. The PXRD patterns demonstrated that the crystallinity and framework integrity of CH3-Cu-BTC could be preserve at the room conditions for 1 month (Fig. S12 in Supporting information). In reversibility and durability tests, the absorbance changes for CH3-Cu-BTC during five cycles of NH3 (800 ppm) adsorption and desorption were analyzed on the basis of UV–vis DRS (Fig. 6a). As evidence in Fig. 6b, regenerated CH3-Cu-BTC was obtained through heating at 60 ℃ for 30 min under high vacuum, and over 90% absorbance was maintained after the five continuous cycles, demonstrating the good stability and regenerability of CH3-Cu-BTC for NH3 sensing.
Figure 6
Figure 6.
(a, b) Response to NH3 (800 ppm) during five cycles of adsorption and desorption. (c) UV–vis DRS of CH3-Cu-BTC after exposure to patient's exhaled air and non-patient's exhaled air.
Because of the excellent selectivity and sensitivity, CH3-Cu-BTC has great potential for exhaled breath detection of liver and kidney disease. Exhaled air for our respiration analysis was obtained from the Department of Gastroenterology, Shanxi Bethune Hospital. The UV–vis DRS of CH3-Cu-BTC after exposure to a patient's and a healthy person's exhaled air were analyzed (Fig. 6c). Excitingly, a significant response was obtained for the patient's exhaled air, while hardly any difference was observed for the healthy person's exhaled air sample. Through linear equation calculations, the NH3 concentration of the patient's exhaled air was found to be 6.3 ppm, while that of the non-patient was 0.9 ppm. In addition, selectivity test effectively demonstrated that color switching is largely attributed to NH3 in the exhaled air (Fig. S13 in Supporting information). These results provide strong evidence of the potential of using this MOF material for the noninvasive early diagnosis of kidney and liver diseases, with the feasibility and efficiency being significantly better than those of traditional ammonia blood test.
In summary, through the target introduction of CH3-functionalization ligands, we achieved the direct synthesis of CH3-Cu-BTC and prepared an efficient material for NH3 colorimetric sensing. With the tailor-made pore environment, CH3-Cu-BTC displayed excellent performance for trace NH3 sensing with visible color change, and demonstrated outstanding characters for NH3 sensing under high humidity conditions. The stronger and selective interactions of CH3-Cu-BTC with NH3 molecules over H2O molecules were clearly determined by DFT simulations, and the color switching is attributed to the change in the coordination environment of Cu2+ ions as a result of NH3 adsorption. Benefiting from the optimized pore chemistry of CH3-Cu-BTC, it can enable the quantitative detection of NH3 in the air exhaled by patients with kidney and liver diseases. Thus, this work not only presents an effective solution for trace NH3 detection at high relative humidity, but also offers a feasible and efficient strategy for noninvasive diagnosis of kidney and liver diseases.
Declaration of competing interest
There are no conflicts to declare.
Acknowledgments
We gratefully acknowledge the financial support from the National Natural Science Foundation of China (Nos. 22090062, 22278287, 22278288), the Shanxi Province 136 Revitalization Medical Project (General Surgery Department), the Shanxi Provincial Guiding Science and Technology Special Project (No. 2021XM42), and the Basic Research Program of Shanxi Province (No. 202103021224341).
Supplementary materials
Supplementary material associated with this article can be found, in the online version, at doi:10.1016/j.cclet.2023.108779.
[1]
L. Liu, T. Fei, X. Guan, et al., Sens. Actuators B Chem. 320 (2020) 128318. doi: 10.1016/j.snb.2020.128318
[2]
P.Le Maout, J.L. Wojkiewicz, N. Redon, et al., Sens. Actuators B Chem. 274 (2018) 616–626. doi: 10.1016/j.snb.2018.07.178
[3]
Y. Su, G. Chen, C. Chen, et al., Adv. Mater. 33 (2021) 2101262. doi: 10.1002/adma.202101262
Y. Li, S. Li, Y. Jiang, et al., Chem. Commun. 54 (2018) 9789–9792. doi: 10.1039/c8cc05459b
Figure 1
Crystal structure of (a) Cu-BTC and (b) CH3-Cu-BTC. Coordination environment of Cu atoms in (c) Cu-BTC and (d) CH3-Cu-BTC. Electrostatic potential patterns of (e) Cu-BTC and (f) CH3-Cu-BTC (blue-to-red colors indicate the high-to-low transition of electron density).
Figure 2
(a) PXRD pattern of CH3-Cu-BTC. (b) FT-IR spectra of CH3-Cu-BTC and CH3-H3BTC. (c) N2 sorption isotherms of as-synthesized and NH3 regenerated CH3-Cu-BTC at 77K. (d) TGA curves of CH3-Cu-BTC under N2 flow.
Figure 3
(a) UV–vis DRS of CH3-Cu-BTC after exposure to different NH3 concentrations for 5 min. (b) UV–vis DRS of Cu-BTC before and after exposure to NH3 (100 ppm) for 5 min. (c) UV–vis DRS of CH3-Cu-BTC exposed to NH3 for different periods. (d) A0/A curve for different periods, where A0 is the CH3-Cu-BTC absorbance at 720 nm before exposure to NH3, A is CH3-Cu-BTC absorbance at 720 nm after exposure to NH3.
Figure 4
(a) UV–vis DRS of CH3-Cu-BTC after exposure to NH3 with different concentrations. (b) A0/A curve versus NH3 concentrations. (c) UV–vis DRS of CH3-Cu-BTC after exposure to 50 ppm NH3 with different relative humidity. (d) A0/A curve versus relative humidity.
Figure 5
(a) H2O and (b) NH3 adsorption sites in CH3-Cu-BTC identified using DFT calculations. Change in electrostatic potential patterns of CH3-Cu-BTC after the adsorption of (c) H2O or (d) NH3.
Figure 6
(a, b) Response to NH3 (800 ppm) during five cycles of adsorption and desorption. (c) UV–vis DRS of CH3-Cu-BTC after exposure to patient's exhaled air and non-patient's exhaled air.

 DownLoad:

 下载:
下载:


