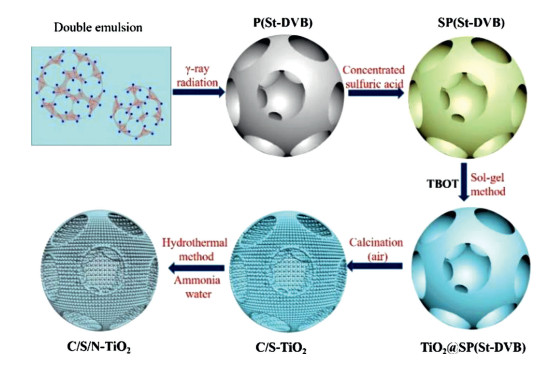
Scheme1.
Schematic illustration of the synthetic procedure of macroporous-mesoporous C-, S-, N-doped TiO2 microspheres.

The incorporation of hierarchical porosity (including mesopores (2−50 nm) and macropores (> 50 nm)) in functional inorganic materials can significantly enhance the performances of materials in wide application fields such as catalyst, electrodes, separation, etc. [1-4]. Although it is challenging to prepare hierarchical porous solids, many approaches have been reported in the literature, which can be classified into two main approaches according to a recent review in hierarchically porous materials: (1) using macro-porous templates in the reaction media together with small scale templates or (2) by combining chemical and physical supplementary methods [5-12]. Developing a versatile template for direct and facile formation of hierarchical porous solids is a subject of broad significance.
Titania (TiO2) is an attractive semiconductor material due to its unique photocatalytic properties, stable physicochemical properties, non-toxicity, and low cost [1315]. However, due to its wide band gap (3.2 eV), TiO2 is responsive to the ultraviolet region which accounts for only about 5% of the solar energy [16, 17]. The fast recombination of photogenerated electrons and holes limits the photocatalytic efficiency of TiO2 as well [18-21]. Doping could reduce the band gap and suppress e-h recombination in TiO2, thus enhance the photocatalytic activity [22-25]. Furthermore, the recombination of carriers is closely related to the microstructure and morphology of TiO2 [26-29]. Hierarchical porous structure cannot only improve the transfer efficiency of photogenerated charges, promote substrate/product transport and increase the exposure of active sites, but also enhance the light-harvesting efficiency owing to a large surface area and multiple reflections of light [30, 31]. As pointed by Parlett et al., the incorporation of macropores into mesoporous architectures could minimise diffusion barriers and enhance the distribution of active sites during catalyst preparation [5].
The mesoporous-mesoporous TiO2 and microporous-mesoporous TiO2 have been reported in the literature [32-35]. However, the TiO2 microspheres with macroporous-mesoporous structure are still rare. Recently, Fang et al. prepared macroporous-mesoporous TiO2 microspheres through the self-assembly of tiny TiO2 nanoparticles with a size of 15−50 nm [36].
Here, we report a new facile method to prepare macroporous-mesoporous C-, S-, N-doped titania (C/S/N-TiO2) microspheres using polyHIPE microspheres as templates. The so-called polyHIPEs are polymers with interconnected porous structure prepared by the polymerization of high internal phase emulsions (HIPEs) [37]. The template method is a common method for preparing porous inorganic microspheres [38, 39]. However, the use of interconnected porous microspheres as templates to prepare inorganic porous microspheres has not been reported yet.
The preparation approaches of these macroporous-mesoporous C/S/N-TiO2 microspheres are outlined in Scheme 1. The experimental details are presented in the supporting information. Two kinds of crosslinked polyHIPE microspheres, including polystyrene (P(St-DVB)) and poly(styrene-co-methyl methacrylate) (P(St-MMA-DVB)) polyHIPE microspheres, were prepared at first using divinyl benzene (DVB) as the crosslinker. To improve the affinity of the polyHIPE microspheres with TiO2, P(St-DVB) was sulfonated (labeled as SP(St-DVB)), and P(St-MMA-DVB) was hydrolyzed to form crosslinked poly(styrene-co-methacrylic acid) (P(St-MAA-DVB)). Then TiO2 was deposited on either SP(St-DVB) or P(St-MAA-DVB) polyHIPE microspheres with a sol-gel method using tetra-n-butyl titanate (TBOT) as the precursor. After calcination, different hierarchical porous TiO2 microspheres were formed and doped meanwhile, that is, C doped TiO2 microspheres (C-TiO2) from P(St-MAA-DVB) template or C/S doped TiO2 microspheres (C/S-TiO2) from SP(St-DVB) template. Moreover, C/N or C/S/N doped TiO2 microspheres (C/N-TiO2 or C/S/N-TiO2) were prepared by the hydrothermal treatment of C-TiO2 or C/S-TiO2, respectively, in the presence of ammonia. For comparing the effects of hierarchically porous structure and doping, we prepared non-doped hierarchically porous TiO2 microspheres (referring to porous TiO2 microspheres below) by calcination of C-TiO2 at 550 ℃ in air for 3 h. The porous TiO2 microspheres are white powders, while the other doped TiO2 microspheres have a light gray color.
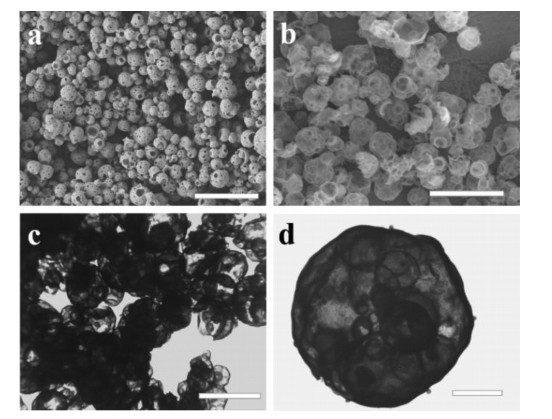
The morphologies of various porous microspheres are observed by using scanning electron microscope (SEM) and transmission electron microscope (TEM). The SEM and TEM images in Fig. 1 and Figs. S1–S4 (Supporting information) demonstrate that macorpores and interconnected porous structures are formed in either polyHIPE templates or different TiO2 microspheres prepared in this work. Moreover, the enlarged TEM images reveal that the TiO2 microspheres are composed of a large amount of TiO2 nanocrystals with an average size of about 7.0 nm (Figs. S2 and S4). These results show that all the TiO2 microspheres possess interconnected hierarchical porous structures. The successful doping of C, S and N elements on the TiO2 microspheres are verified with energy dispersive spectrometric (EDS) analysis, as shown in Fig. S1.
The chemical and crystalline structures and heteroatom doping of TiO2 microspheres are further verified by using Fourier transform infrared (FTIR) spectra, X-ray diffraction (XRD) and X-ray photoelectron spectroscopy (XPS). The peaks at 1215, 1143 and 1037 cm−1 are attributed to three deformation vibrations of -S=O for C/S-TiO2 and C/S/N-TiO2, while the peak at 1403 cm−1 can be assigned to be the C-N stretching vibration of C/N-TiO2 and C/S/N-TiO2 (Fig. S5 in Supporting information). According to XPS (Fig. 2a), it can be seen that Ti, O and C elements appear in all samples. The presence of N element can be found in C/N-TiO2 and C/S/N-TiO2 samples, and the presence of S element in C/S-TiO2 and C/S/N-TiO2 samples. The C/S/N-TiO2 microspheres comprises oxygen (55.13% atom), titanium (22.61% atom), carbon (17.20% atom), nitrogen (2.6% atom) and sulfur (2.39% atom). The high-resolution spectra of Ti 2p, S 2p, C 1s, O 1 s and N 1 s in Fig. S6 (Supporting information) further determine elemental chemical states of C/S/N-TiO2. The XRD patterns (Fig. 2b) demonstrate that all porous TiO2 microspheres are anatase crystal form (JCPDS cards No. 00-004-0477). However, the diffraction peaks of the (101) plane are slightly shifted dependent on different doping, i.e., 2θ=25.07° in C-TiO2, 25.67° in C/N-TiO2, 25.71° in C/S-TiO2 and 25.76° in C/S/N-TiO2, compared with those in nano-TiO2 and porous TiO2 at 2θ=25.32°. The slight change of the spacing of (101) plane in the doped-TiO2 microspheres may attribute to lattice deformation caused by the doping of heteroatoms [40].
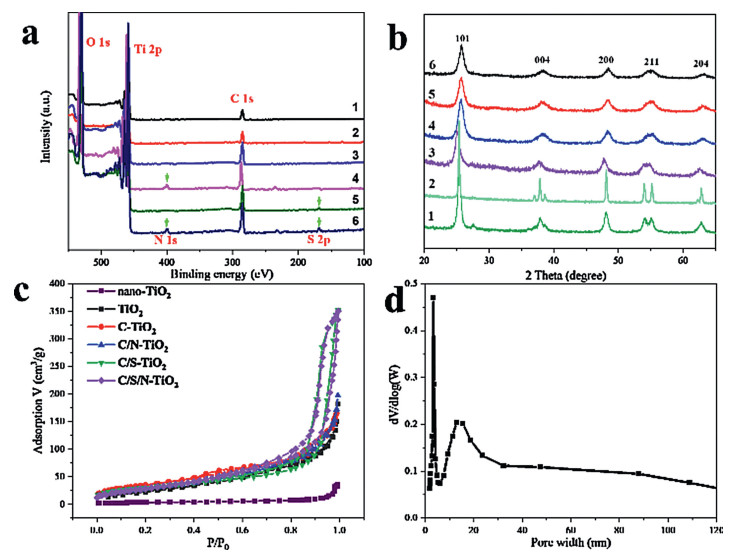
Besides the TEM and SEM observation, the hierarchical porous structures of TiO2 microspheres are further revealed by N2 adsorption-desorption isotherm (Fig. 2c). Compared with N2 adsorption-desorption isotherm of TiO2 nanoparticles (nano-TiO2) having a type III curve, those of porous TiO2 microspheres exhibit a classical IV-type isotherm with H3 hysteresis loop, indicative of mesoporous frameworks. Both the pore sizes and specific surface areas can be calculated from the BET analysis, and the data are listed in Table S1 (Supporting information). It can be seen that all the highly porous TiO2 microspheres have larger specific surface areas than that of nano-TiO2, and C/S/N-TiO2 microspheres have the largest specific surface area of 127.77 m2/g. Fig. 2d shows that there are two main kinds of mesopores (average pore diameters of 3.3 and 14.1 nm) and a small number of widely distributed macropores in C/S/N-TiO2. Overall, macroporous-mesoporous TiO2 microspheres are conveniently prepared in this work.
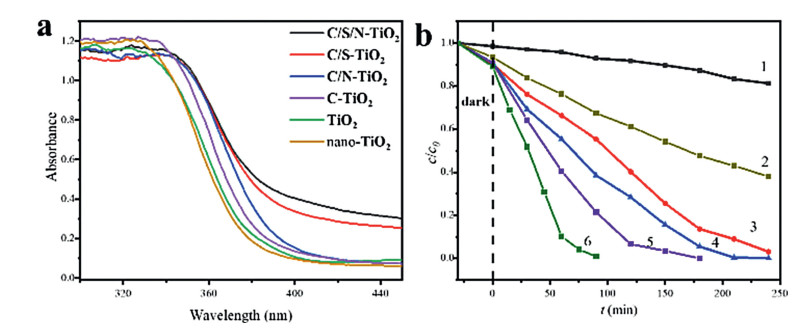
Because of the impact of band gap on the photocatalytic activity of TiO2, we analyzed the band gaps of TiO2 microspheres through UV–vis. diffuse reflectance absorption spectra (UV–vis DRS) [41-43]. As shown inFig. 3a, the absorption edges of all the hierarchical porous TiO2 microspheres are red-shifted, compared with that of TiO2 nanoparticles. According to Kubelka-Munk function conversion diagrams corresponding to UV–vis DRS spectra (Fig. S7 in Supporting information), the band gaps of TiO2, C-TiO2, C/N-TiO2, C/S-TiO2 and C/S/N-TiO2 are 3.11, 3.07, 3.01, 2.94 and 2.81 eV, respectively, which are significantly narrower than that of nano-TiO2 (3.23 eV). It indicates that the band gap of TiO2 can be significantly narrowed by heteroatom doping, and the more kinds of doped heteroatoms, the narrower the band gap. Comparing the band gap of non-doped porous TiO2 microspheres with that of TiO2 nanoparticles, the porous structure can also narrow the band gap, although not as much as doping.
Photoluminescence (PL) spectra are used to characterize the recombination circumstance of electrons and holes. As shown in Fig. S8 (Supporting information), it is found that PL intensities of porous TiO2 and doped-TiO2 microspheres are significantly lower than that of TiO2 nanoparticles, indicating that the recombination of photogenerated electrons and holes is effectively suppressed. The more kinds of doped heteroatoms, the stronger the suppression effect due to the synergistic effect between different heteroatoms [28, 44, 45]. Moreover, the comparison of PL spectra of nano-TiO2 and porous TiO2 microspheres demonstrates that the hierarchical porous structure is also conducive to the suppression of e-h recombination.
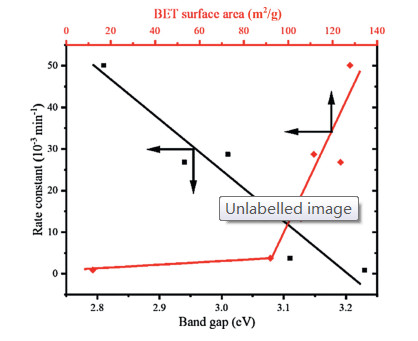
The photocatalytic degradation of RhB dye by different TiO2 particles was tested. The evolution curves of RhB concentrations are plotted in Fig. 3b, where the RhB concentration is decreased due to the saturation adsorption of these TiO2 particles before the starting time of visible light illumination (t =0 min). The surfacial saturation adsorption is fulfilled in half an hour away from light according to the literature [43]. After illuminating by visible light, significant degradation of RhB dye occurs, however, with different degradation curve dependent on different TiO2 partilces. The flatest curve photocatalyzed by nano-TiO2 and the steepest slope curve by C/S/N-TiO2 are shown respectively. C/S/N-TiO2 has the best degradation effect, and the degradation of RhB is completed within 90 min (Fig. S9 in Supporting information), which is generally more active than other TiO2 photocatalysts reported in the literature [46]. The kinetic curves for RhB photodegradation over various particles are plotted according to the pseudo-first-order model (ln(co/c) = kt). The apparent rate constants (k) are listed in Table S2 (Supporting Information). The apparent rate constant of the RhB degradation catalyzed by TiO2 nanoparticles is the lowest (8.93×10⁻⁴ min-1), while that of C/S/N-TiO2 is the highest (0.0501 min-1), which is 13.3 times higher than that of porous TiO2 microspheres (3.76×10⁻³ min-1). According to Fig. 3b, it seems that the degradation is related to the BET specific surface areas. We plot the rate constants versus the specific surface areas and band gaps, respectively, in Fig. 4. If we compare nano-TiO2 with porous TiO2 microspheres, the rate constants between the two particles are only slightly changed, although the specific surface area of porous TiO2 microspheres is much larger than that of nano-TiO2. However, the rate constants are almost linearly related to the band gaps. Therefore, the degradation rate constants are related to both specific surface areas and band gaps. Higher specific surface areas are conducive to faster degradation. However, narrower band gaps of TiO2 microspheres due to doping are the predominant factor. Fig. S10 (Supporting information) further shows no perceptible decrease for the photocatalytic activity of C/S/N-TiO2 after five cycles in total of 7.5 h visible-light illumination, indicating the excellent cycling stability.
It is known that active species such as ·O2−, ·OH, and hole (h+) play an important role in the photocatalytic degradation of RhB dye [47, 48]. In order to study the photodegradation mechanism, we selected p-benzoquinone, tert-butyl alcohol and KI as ·O2−, ·OH and h+ scavengers, respectively [49]. It can be seen from Fig. S11 (Supporting information) that the RhB degradation is not affected by the addition of p-benzoquinone. However, after the addition of tert-butanol and KI, the photodegradation of RhB is significantly inhibited. 68% of RhB is degraded in 90 min in case of the former, while only 23% in case of the latter, indicating that the main oxidizing substances of RhB degradation are ·OH and more important h+. Narrower band gaps and therefore higher efficiency in producing more h+ or ·OH under the illumination of visible light is the main reason accounting for the fast degradation of doped-TiO2 porous microspheres [28, 43-45, 47]. The high specific surface area can dynamically accelerate the degradation.
In conclusion, we report a new facile method to prepare the hierarchically macroporous-mesoporous C/S/N-TiO2 microspheres using polyHIPE microspheres as templates, which show highly active visible-light catalytic efficiency and excellent cycling stability in the degradation of RhB. This is mainly attributed to the synergistic effect of enhanced light harvesting efficiency, excellent substrate/product transport capacity, enhanced photogenerated carrier capability, effective separation of photogenerated electron-hole pairs and more active sites stemmed from the interconnected hierarchical porous structure and the heteroatomic doping. The polyHIPE microspheres template method can be extended to the preparation of other hierarchical porous inorganic microspheres, such as tin dioxide and cadmium sulfide.
The authors report no declarations of interest.
We thank the National Natural Science Foundation of China (No. 51373160) for financial support.
Supplementary material related to this article can be found, in the online version, at doi:https://doi.org/10.1016/j.cclet.2020.08.043.
Q. Sun, N. Wang, D. Xi, M. Yang, J. Yu, Chem. Commun. 50 (2006) 6502-6505. doi: 10.1107/s1600536806008750
W. Ho, J.C. Yu, S. Lee, Chem. Commun. 10 (2006) 1115-1117. http://www.zn903.com/cesclee/papers/A-21.pdf
X. Chen, X. Zhen, H. Gong, et al., Chin. Chem. Lett. 30 (2019) 681-685. doi: 10.1016/j.cclet.2018.09.017
W. Zhou, G. Tong, D. Wang, et al., Small 12 (2016) 1797-1805. doi: 10.1002/smll.201503547
C.M. Parlett, K. Wilson, A.F. Lee, Chem. Soc. Rev. 42 (2013) 3876-3893. doi: 10.1039/C2CS35378D
X. Yang, L. Chen, Y. Li, et al., Chem. Soc. Rev. 46 (2017) 481-558. doi: 10.1039/C6CS00829A
A. Feinle, M.S. Elsaesser, N. Husing, Chem. Soc. Rev. 45 (2016) 3377-3399. doi: 10.1039/C5CS00710K
U. Betke, A. Lieb, Adv. Eng. Mater. 20 (2018) 1800252. doi: 10.1002/adem.201800252
D. Kuang, T. Brezesinski, B.M. Smarsly, J. Am. Chem. Soc. 126 (2004)10534-10535. doi: 10.1021/ja0470618
M. Sun, S. Huang, L. Chen, et al., Chem. Soc. Rev. 45 (2016) 3479-3563. doi: 10.1039/C6CS00135A
K. Na, C. Jo, J. Kim, et al., Science 333 (2011) 328-332. doi: 10.1126/science.1204452
Q. Fang, W. Zhang, X. Chen, Y. Zhang, M. Hu, Chin. Chem. Lett. 31 (2020) 303-306. doi: 10.1016/j.cclet.2019.04.006
K. Qi, B. Cheng, J. Yu, W. Ho, Chin. J. Catal. 38 (2017) 1936-1955. doi: 10.1016/S1872-2067(17)62962-0
X. Lang, J. Zhao, X. Chen, Angew. Chem. Int. Ed. 55 (2016) 4697-4700. doi: 10.1002/anie.201600405
R. Daghrir, P. Drogui, D. Robert, Ind. Eng. Chem. Res. 52 (2013) 3581-3599. doi: 10.1021/ie303468t
S. Ghosh, A.P. Das, Toxicol. Environ. Chem. 97 (2015) 491-514. doi: 10.1080/02772248.2015.1052204
X. Liu, Z. Xing, Y. Zhang, et al., Appl. Catal. B -Environ. 201 (2017) 119-127. doi: 10.1016/j.apcatb.2016.08.031
M.R.A. Mamun, S. Kader, M.S. Islam, M.Z.H. Khan, J. Environ. Chem. Eng. 7 (2019)103248. doi: 10.1016/j.jece.2019.103248
S.G. Kumar, K.S.R.K. Rao, Appl. Surf. Sci. 391 (2017) 124-148. doi: 10.1016/j.apsusc.2016.07.081
Y. Yang, G. Liu, J.T.S. Irvine, H. Cheng, Adv. Mater. 28 (2016) 5850-5856. doi: 10.1002/adma.201600495
Y.H. Hu, Angew. Chem. Int. Ed. 51 (2012) 12410-12412. doi: 10.1002/anie.201206375
S. Krejcikova, L. MatÄjova, K. Koci, et al., Appl. Catal. B -Environ. 112 (2012) 119-125.
K. Sayama, H. Arakawa, ChemInform 93 (1997) 1647-1654. doi: 10.1039/a607662i
J. Yu, Q. Xiang, M. Zhou, Appl. Catal. B -Environ. 90 (2009) 595-602. doi: 10.1016/j.apcatb.2009.04.021
T.S. DÃgrr, L. Deilmann, G. Haselmann, et al., Adv. Energy Mater. (2018) 1802566. doi: 10.1002/aenm.201802566
S. Bai, L. Wang, X. Chen, J. Du, Y. Xiong, Chin. J. Catal. 38 (2017) 1936-1955. doi: 10.1016/S1872-2067(17)62962-0
J. Zhang, C. Pan, P. Fang, J. Wei, R. Xiong, ACS Appl. Mater. Interface 2 (2010) 1173-1176. doi: 10.1021/am100011c
X. Zeng, X. Sun, Y. Yu, H. Wang, Y. Wang, Chem. Eng. J. 378 (2019) 122226. doi: 10.1016/j.cej.2019.122226
X. Li, P. Liu, Y. Mao, M. Xing, J. Zhang, Appl. Catal. B -Environ. 164 (2015) 352-359. doi: 10.1016/j.apcatb.2014.09.053
B. Li, B. Xi, Z. Feng, et al., Adv. Mater. 30 (2018) 1-9.
H. Li, Z. Bian, J. Zhu, et al., J. Am. Chem. Soc. 129 (2007) 8406-8407. doi: 10.1021/ja072191c
H. Hao, J. Zhang, Mater. Lett. 63 (2009) 106-108. doi: 10.1016/j.matlet.2008.09.020
T. Qiang, Y. Song, R. Zhu, W. Yuan, J. Alloy. Compd. 829 (2020) 154512. doi: 10.1016/j.jallcom.2020.154512
W. Wang, Y. Liu, J. Qu, Y. Chen, Z. Shao, RSC Adv. 6 (2016) 40923-40931. doi: 10.1039/C6RA02966C
B. Lei, P. Zhang, M. Xie, et al., Electrochim. Acta 173 (2015) 497-505. doi: 10.1016/j.electacta.2015.05.089
B. Fang, A. Bonakdarpour, K. Reilly, et al., ACS Appl. Mater. Interface 6 (2014) 15488-15498. doi: 10.1021/am504128t
Z. Li, H. Liu, L. Zeng, et al., Langmuir 30 (2014) 12154-12163. doi: 10.1021/la502564r
W. Yuan, Z. Zhang, X. Cui, et al., ACS Sustain. Chem. Eng. 6 (2018) 13766-13777. doi: 10.1021/acssuschemeng.8b01787
X. Xiong, M. Lin, J. Duan, Y. Wang, Z. Yu, React. Funct. Polym. 72 (2012) 365-371. doi: 10.1016/j.reactfunctpolym.2012.03.012
M. Nishikawa, S. Yuto, T. Nakajima, T. Tsuchiya, N. Saito, Catal. Lett. 147 (2017) 292-300. doi: 10.1007/s10562-016-1928-x
V. Jeyalakshmi, R. Mahalakshmy, K.R. Krishnamurthy, B. Viswanathan, Catal. Today 300 (2018) 152-159. doi: 10.1016/j.cattod.2017.02.050
K. Qi, R. Selvaraj, T.A. Fahdi, et al., Appl. Surf. Sci. 387 (2016) 750-758. doi: 10.1016/j.apsusc.2016.06.134
D. Li, J. Jia, T. Zheng, X. Cheng, X. Yu, Appl. Catal. B -Environ. 188 (2016) 259-271. doi: 10.1016/j.apcatb.2016.02.019
M. Rahbar, M. Mehrzad, M. Behpour, Nanotechnology 30 (2019) 505702. doi: 10.1088/1361-6528/ab40dc
F. Li, X. Wang, Y. Zhao, et al., Appl. Catal. B -Environ. 144 (2014) 442-453. doi: 10.1016/j.apcatb.2013.07.050
R. Katal, S. Masudypanah, M. Tanhaei, M.H.D.A. Farahani, J. Hu, Chem. Eng. J. 384 (2020) 123384. doi: 10.1016/j.cej.2019.123384
Y. Shao, C. Cao, S. Chen, et al., Appl. Catal. B -Environ. 179 (2015) 344-351. doi: 10.1016/j.apcatb.2015.05.023
Y.S. Lam, J. Sin, A.Z. Abdullah, A.R. Mohamed, Appl. Catal. B -Environ. 370 (2013) 123-131.
H. Wang, X. Yuan, Y. Wu, et al., Appl. Catal. B -Environ. 174 (2015) 445-454.

Scheme1 Schematic illustration of the synthetic procedure of macroporous-mesoporous C-, S-, N-doped TiO2 microspheres.

Figure 1 SEM images of (a) SP(St-DVB) template and (b) C/S/N-TiO2 microspheres. (c) TEM images of C/S/N-TiO2 microspheres and (d) an enlarged microsphere. The bar is (a) 20 & amp; thinsp; μm, (b) 10 μm, (c) 5 μm and (d) 1 μm, respectively.

Figure 2 (a) XPS survey scans and (b) XRD patterns of (1) nano-TiO2, (2) porous TiO2, (3) C-TiO2, (4) C/N-TiO2, (5) C/S-TiO2 and (6) C/S/N-TiO2. (c) Nitrogen adsorption/desorption isotherms of nano-TiO2, porous TiO2 microspheres and various doped-TiO2 porous microspheres. (d) BJH pore size distribution curves of porous C/S/N-TiO2 microspheres.

Figure 3 (a) UV–vis diffuse reflectance spectra and (b) degradation curves of RhB photocatalyzed by: (1) nano-TiO2, (2) TiO2, (3) C-TiO2, (4) C/S-TiO2, (5) C/N-TiO2 and (6) C/S/N-TiO2.

 扫一扫看文章

扫一扫关注我们
 DownLoad:
 下载:
下载:
