Received Date:
18 October 2017 Accepted Date:
28 December 2017 Revised Date:
27 December 2017 Available Online:
22 April 2018
Abstract:
A flexible asymmetric supercapacitor with high energy density was constructed by using a flexible substrate of carbonized silk-fabrics decorated with carbon nanotube, electroplating MnO2 nanosheets and dip-coating activated carbon powders as the positive and the negative electrodes, respectively. By controlling the electroplating time, the MnO2 nanosheets can be self-assembled to honeycomb structure and showed excellent electrochemical performance in 1 mol/L Na2SO4 electrolyte with SC950-EP30 performing the best. It exhibited a high specific capacitance (1110.85 F/g at a current density of 1 A/g based on the mass of MnO2) and superior rate capability (77.44% capacity retention from 1 A/g to 10 A/g). Thus, the optimal asymmetric device assembled with this material as positive electrode can deliver a maximum energy density of 43.84 Wh/kg and a maximum power density of 6.62 kW/kg.
With the accelerating consumption of fossil fuel and the rapid growth of the global population, energy storage and energy transformation have become an urgent topic in the modern society [1]. Supercapacitors appear as potential candidates for energy storage system since they exhibit many desirable properties such as rapid charge/discharge rate, high power density and superior cyclic stability [2, 3]. Besides that, due to the rapid development of portable and wearable electronic industries in recent years, the demands for flexible storage devices have greatly increased [4-6]. Therefore, the research needs of flexible supercapacitors devices have also been created [7].
According to the energy storage mechanisms, supercapacitors can be mainly categorized into two types: electric double-layer capacitors (EDLCs) and pseudocapacitors [8]. EDLCs store energy through the electrostatic charge adsorbing at the interface between electrode and electrolyte, while pseudocapacitors store energy through fast faradaic redox reaction [9]. Due to only electrostatic reaction concerned in the EDLCs, EDLCs usually exhibit excellent power density [10-12]. On the other hand, pseudocapacitors usually exhibit higher energy density [6, 13, 14].
How to further increase energy density is a core issue of developing supercapacitors since the energy density of supercapacitors is generally less than 10 Wh/kg [1, 15, 16]. Based on the equation of energy density (E) for supercapacitors: E = CV2/2 [17, 18], which indicates that the energy density can be improved by widening the potential window (V). One way to increase the potential window is using organic electrolyte, which can extend the operating voltage to 4 V (compared to 1 V for aqueous electrolyte). However, organic electrolyte usually suffers from lower conductivity, unsafety, and toxicity [19]. Another choice to increase the potential window is constructing an asymmetric supercapacitors in aqueous system. Via making full use of different operating voltages of each electrode, the purpose of extending the potential window for the cell system can be achieved [20, 21]. Thus, selecting proper materials for both positive and negative electrodes is the key point of building a high performance asymmetric supercapacitors. For the positive electrode materials, among all the transition metal oxides, MnO2 has the advantages of high theoretical specific capacitance (~1370 F/g), non-toxicity, low cost, and high performance in neutral aqueous electrolyte [15, 22, 23]. As for the negative electrode materials, carbonaceous materials are commonly used due to their high specific area and moderate cost. Besides, owing to the mature technology and ultrahigh specific area, activated carbon is often used [19, 20].
Considering the merits and the trend mentioned above, we carbonized silk fabrics and decorated with carbon nanotube on their surface, which were used as a flexible substrate (denoted as SC950), then further loaded with MnO2 and activated carbon powders as the positive and the negative electrode, respectively. The honeycomb structured MnO2 was grown on the SC950 by a typical anodizing method. The SC950 was immersed into a mixed solution of 100 mmol/L of Mn(Ac)2 and 100 mmol/L of Na2SO4. Different electrolytes were comparatively used while Mn(Ac)2 was selected because its derived material exhibited better electrochemical behavior and performance as shown in Fig. S2 (Supporting information). In Fig. S2a, high frequency ranges for all materials have small semicircle which suggests a low interfacial charge resistance. However, only the materials from Mn(Ac)2 and MnSO4 have nearly vertical line in the low frequency range which represents ideal capacitive behavior. Fig. S2b–d show cyclic voltammetry (CV) curves of different materials at various scan rates. Both materials from Mn(Ac)2 and MnSO4 remained rectangular shape at a scan rate of 100 mV/s while the material from MnCl2 did not, which consists with the previous electrochemical impedance spectroscopy (EIS) result shown in Fig. S2a. The specific capacitances of samples from Mn(Ac)2, MnSO4, and MnCl2 calculating based on CV curves were 716.5, 513.1 and 152.9 F/g at a scan rate of 2 mV/s. Though the sample from MnCl2 has the largest current response, the deviation of ideal capacitive behavior resulted in a non-rectangular shape (Fig. S2d). Both samples from Mn(Ac)2 and MnSO4 show ideal capacitive behaviors in EIS and CV results, while the material from Mn(Ac)2 has a better specific capacitance owing to the material's unique structure which allowing more Na2SO4 electrolyte penetrating through. For Mn(Ac)2 electrolyte, MnO2 nanosheets were electroplated on the SC950 at a constant current of 0.42 mA for 20, 30, and 60 min (samples denoted as SC950-EP20, SC950-EP30, and SC950-EP60), with platinum wire and Ag/AgCl electrode as the counter electrode and the reference electrode, respectively. The optimal electroplating time was 30 min in the present work, which presents a honeycomb structure under the scanning electron microscopy (SEM) image (Fig. 1a).
图 1
图 1
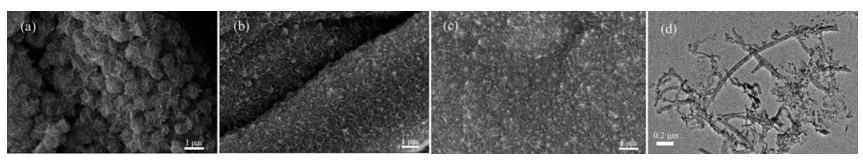
SEM images of positive electrode with different electroplating time for (a) 30 min, (b) 20 min, (c) 60 min and (d) TEM image of positive electrode with electroplating time for 30 min.
Figure 1.
SEM images of positive electrode with different electroplating time for (a) 30 min, (b) 20 min, (c) 60 min and (d) TEM image of positive electrode with electroplating time for 30 min.
The SEM images of different depositing time using Mn(Ac)2 electrolyte are summarized in Fig. 1. Different electrolytes were used in the depositing and the resulting samples are shown in Fig. S3 (Supporting information). It is observed that as the electroplating time is increased, the morphology of MnO2 is changed correspondingly. Initially, MnO2 nanosheets grow perpendiculary on the carbonized fabrics (Fig. 1b). When prolonging deposition time to 30 min, MnO2 nanosheets self-assembled and formed a 3D honeycomb structure (Fig. 1a). This stereoscopic structure allows electrolyte penetrating more efficiently, and thus enables the MnO2 to react thoroughly. As we further increase the deposition time, the stereoscopic structure gradually vanished and turned into a flattened appearance instead (Fig. 1c). The transmission electron microscopy (TEM) image further confirmed that MnO2 honeycomb structure was originally formed by MnO2 nanosheets with average 20 nm width growing on the carbonized fabrics (Fig. 1d).
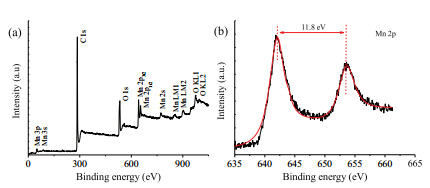
X-ray photoelectron spectroscopy (XPS) measurement was conducted to investigate the surface chemical composition and element boding configurations of the SC950-EP30. The XPS survey spectrum of MnO2/carbonized fabrics is shown in Fig. 2a. The XPS spectrum reveals the presence of C, O and Mn elements in the electrode. Fig. 2b shows the Mn 2p core-level XPS spectrum. The Mn 2p3/2 and Mn 2p1/2 peak values are located at 642.0 eV and 653.8 eV, respectively, with a separated spin-energy of 11.8 eV which agrees well with those reported values [15, 23], demonstrating 4+ oxidation state for Mn that confirmed the existence of MnO2 on the fabrics. The X-ray diffraction (XRD) measurement was conducted to identify the phase of electroplating MnO2. Pattern of XRD in Fig. S4 (Supporting information) shows the existence of α-MnO2 with tetragonal phase (JCPDS No. 44-0141). The weak and broad peaks suggest the poor crystallinity of the electrodepositing MnO2.
图 2
图 2
(a) The survey XPS spectrum and (b) high-resolution Mn 2p of SC950-EP30.
Figure 2.
(a) The survey XPS spectrum and (b) high-resolution Mn 2p of SC950-EP30.
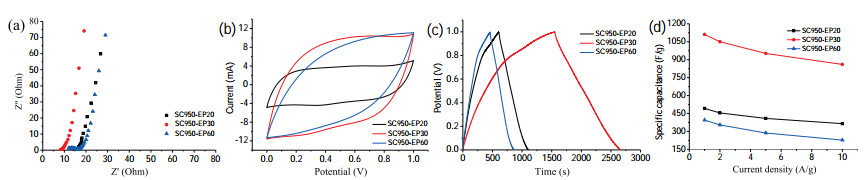
Electrochemical properties of all electrodes were first characterized by EIS, and were further analyzed using Nyquist plots. The nearly vertical line in the low frequency range of all the electrodes in Fig. 3a represents the ideal capacitive behavior, and the small semicircle in high frequency range shows the low interfacial charge resistance. The SC950-EP30 exhibits the best performance among all the electrodes in Nyquist plot, which consists with the further cyclic voltammetry (CV) and galvanostatic charge-discharge (GCD) tests. It can be seen that the CV curves of all the electrodes present the quasi-rectangular shape with no distinct redox peaks at a scan rate of 100 mV/s, which consists with the faradic pseudocapacitive behavior of MnO2 (Fig. 3b). The nearly triangular shape of GCD cycles exhibits good symmetry and almost linear slope in all electrodes when discharge as shown in Fig. 3c, demonstrating the ideal capacitive behavior which is in good agreement with the EIS and CV results. CV curves at various scan rates and GCD curves at different current densities of each electrode were disclosed in the Supporting information (Fig. S5). The specific capacitance (CS) can be calculated by the equation based on CV [6, 17, 24] and the equation based on GCD [25, 26]. The specific capacitances of SC950-EP20, SC950-EP30, and SC950-EP60 based on CV were 362.2, 716.5, and 258.9 F/g at a scan rate of 2 mV/s, and were 492.6, 1110.9, and 395.1 F/g based on GCD at a current density of 1 A/g, respectively. The specific capacitances for the different electrodes at different applied current densities are summarized in Fig. 3d. Notice that although area of the SC950-EP60 under CV test is much larger than the SC950-EP20 (Fig. 3b), but the specific capacitance results were in the opposite way. The detailed electrochemical performances for all samples were disclosed in Fig. S5. This is caused by the over-deposition of the SC950-EP60 electrode, which not only lets the electrode react with more absolute amounts of active materials, but also makes a large portion of the inaccessible region. This is the reason why the SC950-EP60 shows larger area under CV test, but presents lower value when calculating specific capacitance.
图 3
图 3
(a) Nyquist plots of positive electrodes. (b) CV curves of positive electrodes at 100 mV/s. (c) GCD curves of positive electrodes at 1 A/g. (d) Specific capacitances of positive electrodes at different current densities.
Figure 3.
(a) Nyquist plots of positive electrodes. (b) CV curves of positive electrodes at 100 mV/s. (c) GCD curves of positive electrodes at 1 A/g. (d) Specific capacitances of positive electrodes at different current densities.
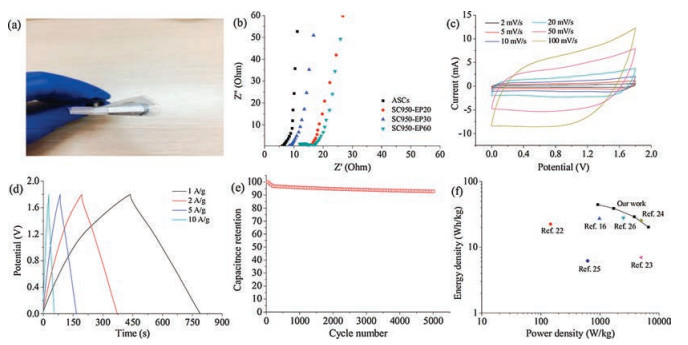
Based on above results, flexible asymmetric supercapacitors (ASCs) were constructed by assembling SC950-EP30 as positive electrode and dip-coating activated carbon powders as negative electrode, respectively (Fig. 4a). The detailed fabrication process is disclosed in the Supporting information. With the advantage of the different potential ranges of MnO2 and activated carbon (Fig. S6 in Supporting information), the flexible ASCs can display a maximum operating voltage of 1.8 V, a high specific capacitance of 96.7 F/g, an outstanding energy density of 43.84 Wh/kg at a current density of 1 A/g, and a maximum power density of 6.62 kW/kg at a current density of 10 A/g in 1 mol/L Na2SO4 aqueous electrolyte. The EIS of the flexible ASCs was measured and compared with the positive electrode mentioned above (Fig. 4b). It can be observed that flexible ASCs have a more vertical line in low frequency range and a smaller semicircle in high frequency range than the single positive electrode, which shows better ideal capacitive behavior of the flexible ASCs. This result could be likely contributed to the EDLC essence of the activated carbon, which complements the pseudocapacitive essence of the MnO2. In addition, CV curves of the flexible ASCs measured at various scan rates present rectangular shapes (Fig. 4c), disclosing the ideal capacitive behavior consistent with the EIS result. The excellent electrochemical performances of the flexible ASCs were further verified by GCD measurement. As shown in Fig. 4d. GCD curves of the flexible ASCs performed at different current densities from 1 A/g to 10 A/g exhibit almost symmetric triangular shapes, which confirmed the good capacitive properties for this flexible ASCs device. Besides the large energy density, cycling stability is also an important requirement for supercapacitors. The overall specific capacitance loss is only about 5.95% after 3000 cycles and 7.1% after 5000 cycles of charging and discharging at a current density of 2 A/ g (Fig. 4e), indicating well cyclic performance for this flexible ASCs. Also, there are some latest reported MnO2-based asymmetric supercapacitors plotted on the Ragone diagram to be compared with our work (Fig. 4f) [20, 27-31].
图 4
图 4
(a) Digital image of flexible ASCs device. (b) Nyquist plots of ASCs and positive electrodes. (c) CV curves of ASCs at various scan rate. (d) GCD curves of ASCs at different applied current densities. (e) Cyclic stability of ASCs and (f) Ragone plots of ASCs.
Figure 4.
(a) Digital image of flexible ASCs device. (b) Nyquist plots of ASCs and positive electrodes. (c) CV curves of ASCs at various scan rate. (d) GCD curves of ASCs at different applied current densities. (e) Cyclic stability of ASCs and (f) Ragone plots of ASCs.
In summary, we fabricated an ideal positive electrode by simply adjusting the electroplating time of MnO2 to achieve a unique honeycomb structure, which exhibits a high specific capacitance (1110.85 F/g at a current density of 1 A/g) and superior rate capability (77.44% capacity retention from 1 A/g to 10 A/g) in 1 mol/L Na2SO4 electrolyte. Thus, the optimal device assembled by this material as positive electrode and activated carbon as the negative electrode with an operation voltage of 1.8 V can deliver a maximum energy density of 43.84 Wh/kg and a maximum power density of 6.62 kW/kg.
Acknowledgements
This work was financially supported by the National Natural Science Foundation of China (No. 51672151) and 973 Program of China (No. 2014CB932401).
Z.S. Wu, W. Ren, D.W. Wang, et al., ACS Nano 4(2010) 5835-5842. doi: 10.1021/nn101754k
[29]
P.C. Chen, G. Shen, Y. Shi, H. Chen, C. Zhou, ACS Nano 4(2010) 4403-4411. doi: 10.1021/nn100856y
[30]
Y. He, W. Chen, X. Li, et al., ACS Nano 7(2013) 174-182. doi: 10.1021/nn304833s
[31]
J. Liu, L. Zhang, H.B. Wu, et al., Energy Environ. Sci. 7(2014) 3709-3719. doi: 10.1039/C4EE01475H
Figure 1
SEM images of positive electrode with different electroplating time for (a) 30 min, (b) 20 min, (c) 60 min and (d) TEM image of positive electrode with electroplating time for 30 min.
Figure 3
(a) Nyquist plots of positive electrodes. (b) CV curves of positive electrodes at 100 mV/s. (c) GCD curves of positive electrodes at 1 A/g. (d) Specific capacitances of positive electrodes at different current densities.
Figure 4
(a) Digital image of flexible ASCs device. (b) Nyquist plots of ASCs and positive electrodes. (c) CV curves of ASCs at various scan rate. (d) GCD curves of ASCs at different applied current densities. (e) Cyclic stability of ASCs and (f) Ragone plots of ASCs.

 下载:
下载:

 下载:
下载:


