School of Environmental Science and Engineering, Tianjin University, Tianjin 300350, China
b.
School of Chemical Engineering and Technology, Tianjin University, Tianjin 300350, China
c.
School of Materials Science and Engineering, Tianjin University, Tianjin 300350, China
d.
School of Science, Tibet University, Lhasa 850000, China
* Corresponding author. E-mail address: yutao@tju.edu.cn (T. Yu).
Received Date:
23 May 2022 Accepted Date:
04 August 2022 Revised Date:
15 July 2022 Available Online:
15 April 2023
Abstract:
30% FeCN/ZIS (30% Fe doped g-C3N4 composited ZnIn2S4) was synthesized by a simple water bath method, via in-situ growth of abundant well-dispersed ZnIn2S4 nanosheets on the Fe doped g-C3N4 surface. Experimental results showed the optimized 30% FeCN/ZIS achieved the best photoreduction of Cr(Ⅵ) performance within a wide pH range, which was 9.5 times and 700 times higher than that of pure ZnIn2S4 and 30% FeCN (Fe doped g-C3N4). This is due to the intense synergy between the Fe-Nx bond and close interface contact produces a high-speed charge transfer channel, thus significantly improving the efficiency of optical carrier separation and migration. Meanwhile, UV-vis diffuse reflection spectra and photoluminescence spectroscopy showed that iron doping significantly narrowed the bandgap of g-C3N4, preventing electron-hole pair recombination. Further, the microstructures and charge separation properties were analyzed by scanning electron microscope, Photoluminescence Spectroscopy and time-resolved photoluminescence, which revealed the structure-activity relationship of composite structure and the synergistic mechanism of each functional component. This research should provide a viable technique for creating composites with high photocatalytic activity for the treatment of chromium-containing wastewater.
Hexavalent chromium (Cr(Ⅵ)) is a typical water pollutant, mainly from electroplating, tanning, metal processing, printing and dyeing industries. It is highly toxic and easily enters the food chain, especially it is fatal when Cr(Ⅵ) doses are higher than 0.1 mg/g [1]. Therefore, reducing Cr(Ⅵ) concentration to a safe level is very critical for biodiversity and human health. Adsorption, chemical precipitation, membrane filtration, ion exchange and photocatalytic reduction are now the most used methods for treating Cr(Ⅵ) in wastewater. Among all the aforementioned methods, photocatalytic reduction has the most advantages in terms of ease of operation and no secondary pollution, as well as reduced energy consumption and higher efficiency in removing heavy metal ions from contaminated water [2].
Graphitized carbon nitride (g-C3N4) is a metal-free polymer semiconductor material, which has attracted extensive attention in wastewater pollutant degradation, hydrogen production and carbon dioxide reduction owing to its good features of cheapness, high chemical stability, adjustable electronic structure and unique two-dimensional characteristics [3]. Theoretically, Cr(Ⅵ) can be photo reduced by g-C3N4 because the conduction band potential (−1.3 V vs. NHE) of g-C3N4 is more negative than the reduction potential of Cr(Ⅵ)/Cr(Ⅲ) (1.33 V vs. NHE). However, the efficiency of the photocatalytic reduction of aqueous Cr(Ⅵ) by using g-C3N4 in practical applications is still low because of the easy recombination of photogenerated electron-hole small specific surface area and limited response in visible-light irradiation. Various strategies have been studied to improve overall photocatalytic efficiency of g-C3N4, including structural modifications, doping, morphological control or heterojunction composite. Among these modifications, doping a metal ion into the semiconductor material is one strategy that can affect the morphology, visible light response and photocatalytic activity. g-C3N4 can easily capture the metal cations to form bonds due to the strong interactions between the cations and the negatively charged nitrogen atoms ascribed to lone pairs of electrons in the nitrogen pots of g-C3N4. Transition metal iron has been researched widely on account of it is a common element with low cost, environment friendly and excellent performance. Gao et al. studied the Fe-g-C3N4 photocatalyst which shows remarkable photocatalytic degradation of Methylene Blue [4]. Therefore, for layered materials g-C3N4, Fe doping into the layers to form bonds is not only conducive to charge transmission but also to expanding visible light absorption [5].
In addition, to further improve the photocatalytic efficiency of g-C3N4, the electron-hole pair must be separated effectively, and the charges need to transfer rapidly across the surface/interface to inhibit recombination. The simplest method to achieve this is by combining semiconductor with g-C3N4 to greatly promote the spatial separation and interchange of charge carriers. Liu et al. synthesized g-C3N4/CeO2 photocatalyst with abundant oxygen vacancy for enhanced photocatalytic reduction of Cr(Ⅵ) under visible light [6]. Fe-g-C3N4/GMC synthesized by Ma et al. possessed an efficient charge transfer, as a consequence, it achieved efficient degradation of AR73 in a wide pH range of 4-10 [4]. Recently, we found that the ZnIn2S4 (band gap: 2.06 eV), a typical layered ternary chalcogenide, and its band matching with g-C3N4 is conducive to the construction of interface junctions. ZnIn2S4 has a CB potential of −1.2~−0.6 eV, Under acidic conditions, HCrO4− + 7H+ + 3e– = Cr3+ + 4H2O, E(HCrO4−/Cr3+) = 1.35 V vs. NHE, Under alkaline conditions, CrO42− + 4H2O + 3e– = Cr(OH)3 + 5OH–, E(CrO42−/Cr(OH)3) = −0.13 V vs. NHE, suggesting its intense reducing capacity of Cr(Ⅵ) [7]. ZnIn2S4 nanosheets can direct grow on the surface of g-C3N4 to form an intimate interfacial contact interface, which can generate unique high-speed charge transfer channels.
In this work, we fabricated a novel 30% FeCN/ZIS composites with highly efficient photocatalytic reduction of Cr(Ⅵ) for the first time (Fig. 1a). The compact interface between 30% FeCN and abundant well-distributed ZnIn2S4 nanosheets showed a uniquely efficient electron transfer channel, which improved the efficiency of photogenerated carrier separation and migration. Iron was doped into the g-C3N4 layer and formed Fe-Nx bonds, which once again accelerates the electron transport, so FeCN samples showed higher visible light absorption and lower charge recombination than g-C3N4. This work provides new insight into the reasonable design of doping and composites in highly efficient photocatalytic Cr(Ⅵ) reduction.
Figure 1
Figure 1.
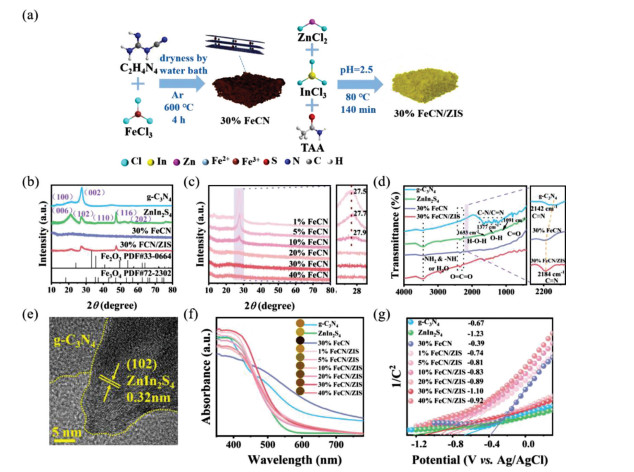
(a) The synthesis route of 30% FeCN/ZIS composites. (b) XRD pattern of samples. (c) XRD patterns of carbon nitride doped with different Fe ratios. (d) FTIR spectra of series samples. (e) HRTEM images of 30% FeCN/ZIS. (f) UV–vis DRS spectra and (g) Mott–Schottky plots of series samples.
In order to determine the structure of the synthesized sample, X-ray diffraction (XRD) and Fourier Transform Infrared Spectrometer (FTIR) spectra were employed here (Figs. 1b-d). The XRD pattern of g-C3N4 had two striking diffraction peaks at 13.1° and 27.4° corresponding to (100) and (002) planes, which intensity decreased gradually after introducing iron into g-C3N4 networks, indicating host-guest interactions and inhibition of polymeric condensation by excess Fe species [8]. The diffraction peak (002) of FeCN moved to a larger angle with the increase of Fe content, indicating that Fe entered the interlayer of g-C3N4 and when Fe content exceeded 10%, the samples exhibited amorphous with a peak at about 25° appeared which was related to carbon-based materials [9, 10]. These results showed that the introduction of excessive Fe destroyed the periodic arrangement of carbon nitride. No obvious Fe species peaks are observed, together with the absence of the (002) peak suggesting that the majority of Fe was present in an amorphous form, most likely in the form of Fe-Nx bonds rather than forming oxides or carbides [4]. Five diffraction peaks at 21.6°, 27.7°, 47.2°, 52.4° and 55.6° were pertained to (006), (102), (110), (116) and (202) lattice planes fitting with hexagonal crystal ZnIn2S4 (JCPDS 65-2023) [11]. The 30% FeCN/ZnIn2S4 composite shows a similar XRD pattern to the pure hexagonal ZnIn2S4 sample, indicating that the appearance of 30% FeCN did not affect the crystal structure of ZnIn2S4. In the infrared spectrum of g-C3N4, the absorption peaks were mainly concentrated in three regions: 808, 1200-1700, and 3200-3600 cm−1, which was consistent with the relevant literature [12]. The striking band near 808 cm−1, 1240-1650 cm−1 and 3200-3600 cm−1 originated from the characteristic bending modes of the s-triazine ring, stretching vibrations of the aromatic CN heterocycles and the N−H stretching vibrations of −NHS groups (−NH2 or NH) or O−H stretching vibrations of surplus hydroxy groups, respectively [13]. The tensile vibration of the C≡N peak shifts to a higher wavenumber with the addition of Fe which could further indicate that the skeleton structure of g-C3N4 changes after Fe doping to form a Fe-Nx chemical bond, and the sp2 C−N bond was transformed into a triple C≡N bond [14]. This resulted in nitrogen loss from the framework and an increased C/N ratio (Table S1 in Supporting information). The weak peaks at 1377 and 1633 cm−1 of ZnIn2S4 belonged to the surface absorbed water molecules and the hydroxyl groups [15].
The high-resolution TEM image of 30% FeCN/ZIS (Fig. 1e) showed the lattice-fringe spacing of 0.32 nm which was corresponding to the (102) plane of ZnIn2S4 and the amorphous structure was 30% FeCN, further confirming the existence of close interface contact, promoting facile charge interchange [16]. 30% FeCN was wrapped by ZnIn2S4 nanosheets and could be observed by TEM (Fig. S1a in Supporting information), which was consistent with the XRD result and the selected electron diffraction (Fig. S1b in Supporting information) results that only had ZnIn2S4 diffraction ring. Fig. S2 (Supporting information) shows energy disperse X-ray spectroscopy (EDS) analysis of 30% FeCN/ZIS, revealing that the composite consisted of C, N, Fe, Zn, In and S elements and they were well dispersed. 30% FeCN/ZIS showed abundant well-dispersed ZnIn2S4 nanosheets grown on the surfaces of bulk g-C3N4, providing a channel for the rapid transfer of charge (Fig. S3d in Supporting information) so that improved Cr(Ⅵ) photoreduction performance efficiently.
The strong light absorption in the visible region is efficient for photocatalytic activity [17]. g-C3N4 exhibited a band-edge absorption at approximately 500 nm (Fig. 1f), corresponding to a band gap energy of 2.54 eV (Table S2 in Supporting information). And the doping Fe led absorption band red-shifted obviously, indicating that the bandgap is narrowed [18]. Regarding ZnIn2S4, the light absorption edge was nearby 560 nm which meant excellent visible light absorption capacity [19]. According to the Kubelka–Munk function, the bandgap of each material was obtained, as shown in Table S2. Furthermore, the flat-band potentials (Efb) of all samples were obtained via extrapolating to the x-intercept in the Mott–Schottky (M-S) plot as shown in Fig. 1g. With the amount of Fe increased, the Efb of FeCN/ZIS became more negative. The series material is an n-type semiconductor because of its positive slope. In general, the n-type conduction band potential (EVB) was negative than the flat band potential of about 0.2 V. Due to the Ag/AgCl reference electrode, the reference electrode in this paper was Ag/AgCl electrode, which needs to be converted to a normal hydrogen electrode (vs. NHE), so the conduction band potential was approximately close to the original Efb [20]. By using the formula Eg = EVB − ECB, the valence band (VB) potentials of g-C3N4, ZnIn2S4, 30% FeCN, 1% FeCN/ZIS, 5% FeCN/ZIS, 10% FeCN/ZIS, 20% FeCN/ZnIn2S4, 30% FeCN/ZIS and 40% FeCN/ZIS were calculated to be 1.87, 1.09, 1.24, 1.43, 1.23, 1.18, 1.21, 1.02 and 1.17 eV, respectively. The schematic diagram that described the band structure of all samples was drawn in Fig. S4 in Supporting information.
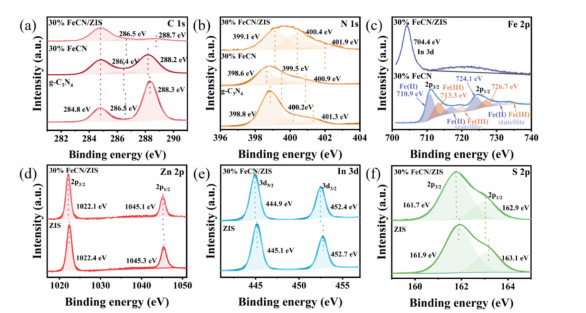
The electronic states and chemical structures of g-C3N4, ZnIn2S4, 30% FeCN and 30% FeCN/ZIS were determined by X-ray photoelectron spectroscopy (XPS) (Fig. 2). The full spectrum of as-prepared samples shown in Fig. S5 (Supporting information) indicated that all samples were composed of corresponding elements. The high-resolution XPS spectra of C 1s, N 1s, Fe 2p, Zn 2p, In 3d and S 2p from all the samples were shown in Figs. 2a-f. Deconvolution of C 1s for pure g-C3N4 XPS spectrum showed three peaks located at 284.8, 286.5 and 288.3 eV (Fig. 2a), assignable to the C−C/C=C, C−NHx, N−C=N bonds, respectively. Fig. 2b indicated high-resolution N 1s spectra, three peaks observed at 398.8, 400.2 and 401.3 eV corresponding to the sp2 structure of N (C−N=C), tertiary N−(C)3 and N−Hx energy groups for g-C3N4 [21]. It should be noted that the binding energy of C 1s, N 1s in 30% FeCN was lower than that of in g-C3N4, indicating that the electron cloud density of g-C3N4 was changed. In the N 1s orbit of 30% FeCN, the peak value of Fe-Nx cored at 399.0 eV (± 0.1 eV), which was due to the increased electron cloud densities of g-C3N4 as the Fe-Nx bond promotes the transfer of charge from Fe ions to the g-C3N4. It was detected in Fig. 2c that Fe2+ and Fe3+ related peaks simultaneously appeared in the fine spectrum of Fe 2p on 30% FeCN. These peaks at a binding energy of 710.9 eV (Fe 2p3/2) and 724.1 eV (Fe 2p1/2) are corresponding to iron divalent, 713.3 eV (Fe 2p3/2) and 726.7 eV (Fe 2p1/2) are corresponding to ferric iron, and there were two typical vibrating satellite peaks [22]. The binding energy of 710.9 eV was very close to the previous reports, in which the Fe species was stabilized in the electron-rich g-C3N4 structure through Fe-Nx bonds as N 1s high spectrum XPS demonstrated [23]. Fe doping into g-C3N4 skeleton formed Fe-Nx bond led electron migrates from Fe to g-C3N4 that made C and N binding energy decreased. Compared to pure ZnIn2S4 and 30% FeCN, when 30% FeCN coupled with ZnIn2S4, the C 1s, N 1s and Fe 2p orbital exhibited a positive shift, whereas the Zn 2p (Fig. 2d), In 3d (Fig. 2e) and S 2p (Fig. 2f) orbital exhibited inverse shift, indicated the strong electronic relations between 30% FeCN and ZnIn2S4 [24, 25]. Meanwhile, we summarized the proportion of XPS element content in all samples, as shown in Table S1. In addition, it should be noted that the nitrogen content of 30% FeCN decreased significantly after iron doping. The content of g-C3N4 decreased from 49.74% to 41.57%, mainly because the amino group reacted with ferric chloride to form hydrogen chloride gas and ran away, reducing the content othe nitrogen element.
Figure 2
Figure 2.
The XPS spectra of series samples, (a) C 1s, (b) N 1s, (c) Fe 2p, (d) Zn 2p. (e) In 3d and (f) S 2p the high resolution XPS spectra of samples.
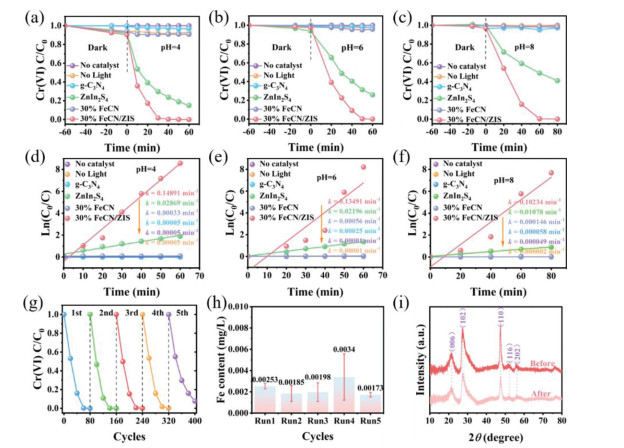
The photocatalytic performance of g-C3N4, ZnIn2S4, 30% FeCN and 30% FeCN/ZIS was evaluated by the reduction activity of Cr(Ⅵ) in aqueous solutions with different pH values (4, 6 and 8) under simulated sunlight AM 1.5 irradiation (Fig. 3). No photocatalytic reduction performance was observed at pure g-C3N4 because it cannot directly oxidize surface hydroxyl groups at the oxidation potential [26]. In consideration of the same reason, the photocatalytic performance of 30% FeCN exhibited poorly due to possessed oxidation potential insufficiently. The performance of the ZnIn2S4 was not particularly outstanding. Interestingly, 30% FeCN/ZIS showed an excellent photocatalytic performance within a wide pH range compared to both 30% FeCN and pure ZnIn2S4. At the same time, we compared the properties of the materials reported to highlight the advantages of this work (Table S3 in Supporting information). In order to analyze the photocatalytic abilities of as-prepared photocatalysts objectively, a series of reaction kinetics of Cr(Ⅵ) photoreduction were fitted accordingly (Figs. 3d-f). 30% FeCN/ZIS showed the highest reduction rate (k = 0.14891 min−1) in solution of pH 4, which was 2.5 times of pure ZnIn2S4 (k = 0.02896 min−1). And with the increase of pH, the performance gap became more and more obvious. the value of k of 0.10234 min−1 was observed at pH 8 in the 30% FeCN/ZIS system, which is approximately 9.49 times higher than that in the ZnIn2S4 (k = 0.01078 min−1) system indicating effective interfacial contact can greatly enhance the photocatalytic performance of the composite.
Figure 3
Figure 3.
The change of Cr(Ⅵ) concentration and its removal kinetics at different pH. (a, d) pH = 4. (b, e) pH = 6. (c, f) pH = 8 and the stability of 30% FeCN/ZIS. (g) Cycle experimental performance diagram. (h) Leaching experiment of iron ion. (i) XRD patterns of the sample before and after the reaction.
From the perspective of the application, the stability of photocatalyst is a critical index, thus it was evaluated using a 30% FeCN/ZIS catalyst here. The removal efficiencies of Cr(Ⅵ) remained about 90% after five cycles as illustrated in Fig. 3g, implying the good repeatability of 30% FeCN/ZIS. The concentration of iron ions in the solution approaches zero after each cycle (Fig. 3h). Meanwhile, the iron ion leaching in the solution at different pH values was measured to further demonstrated the stability of the photocatalyst (Fig. S6 in Supporting information). Almost no residual iron ion in the aqueous solution after Cr(Ⅵ) reduction was detected due to the formation of the Fe-Nx bond in the FeCN/ZIS crystal structure [27]. XRD patterns of fresh and used samples (Fig. 3i) could further prove the stability of the photocatalyst.
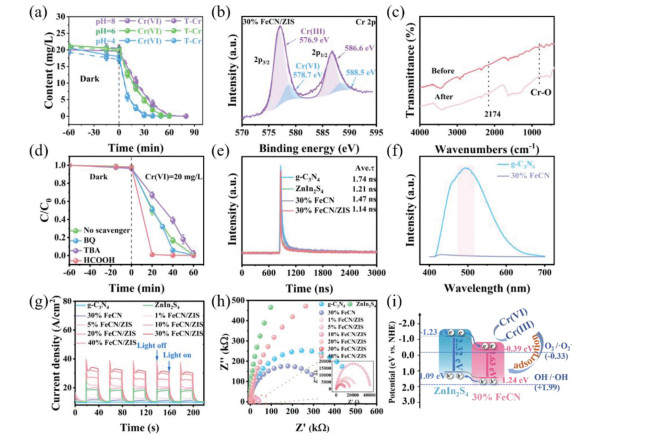
Interestingly, the content of Cr(Ⅲ) and total Cr (T-Cr) synchronously decreased in the photocatalytic reduction experiment of Cr(Ⅵ). In general, the relative amount of Cr(Ⅲ) can be determined by the amount of T-Cr in the ICP-OES test minus Cr(Ⅵ) concentrations after the reduction of Cr(Ⅵ) to Cr(Ⅲ) [28]. We could see that there was almost no Cr(Ⅲ) in the solution (Fig. 4a), which meant Cr(Ⅲ) was adsorbed on the photocatalyst and was not released in water. The existence of the Cr element could be observed obviously from the XPS spectra of 30% FeCN/ZIS photocatalyst after the reduction of Cr(Ⅵ) (Fig. 4b), which could be fitted into four peaks 588.5 and 586.6 eV assigned to Cr 2p1/2 of Cr(Ⅵ) and Cr(Ⅲ), 578.7 and 576.9 eV were Cr 2p3/2 of Cr(Ⅵ) and Cr(Ⅲ) [29]. The XPS analysis showed that about 83.5% of Cr absorbed on the 30% FeCN/ZIS photocatalyst was in the form of Cr(Ⅲ) and the rest 16.5% was in the form of Cr(Ⅵ). These results confirmed that mass Cr(Ⅵ) converted to Cr(Ⅲ) and then Cr(Ⅲ) was adsorbed by the catalyst. Similar conclusions could be observed from FTIR analysis in Fig. 4c, a new peak appeared at 807 cm−1 corresponding to the Cr–O stretching vibration [30]. The above results indicated that the 30% FeCN/ZIS could not only reduce Cr(Ⅵ) into the less hazardous Cr(Ⅲ) but also adsorbed Cr(Ⅲ) qualified. Therefore, 30% FeCN/ZIS can be used as a dual-function material which has great application potential.
Figure 4
Figure 4.
(a) Removal of T-Cr and Cr(Ⅵ) by 30% FeCN/ZIS at different pH values. (b) Cr 2p high resolution XPS after 30% FeCN/ZIS reaction. (c) FTIR spectra before and after reaction. (d) Quenching effect of different radical scavengers on removal rate of Cr(Ⅵ). (e) TRPL. (f) PL spectra. (g) Transient photocurrent response. (h) Nyquist impedance plots. (i) The schematic illustration of the reduction of Cr(Ⅵ) on 30% FeCN/ZIS under AM1.5 irradiation.
To reveal the photocatalysis mechanism, active species trapping experiments were carried out (Fig. 4d). HCOOH promoted the photocatalytic reduction of Cr(Ⅵ), indirectly indicating that electrons play a key role in the reaction while the reduction was significantly enhanced in presence of BQ, which is attributed to competitive reactions between Cr(Ⅵ) reduction and O2·− radicals formation. Besides, the addition of TBA had no significant effect on the reaction system. Therefore, the Cr(Ⅵ) can be reduced to Cr(Ⅲ) by photo-induced electrons in the photocatalytic reduction of the Cr(Ⅵ) process.
It is well-known that the photocatalytic performance of semiconductors is related to the photoinduced generation and the separation efficiency of carrier pairs. In this paper, the photoinduced electron-hole transfer mechanism of 30% FeCN/ZIS composites was further revealed by transient fluorescence attenuation spectrum (Fig. 4e), photoluminescence spectrum (Fig. 4f), transient photocurrent response (Fig. 4g), and electrochemical impedance spectroscopy (Fig. 4h) [31]. Fig. 4e showed the variation trend of attenuation time. The average carrier life of g-C3N4, ZnIn2S4, 30% FeCN and 30% FeCN/ZIS sample was calculated to be 1.74, 1.21, 1.47 and 1.14 ns, respectively. Compared with the other three materials, 30% FeCN/ZIS had the shortest average carrier life so it had the best electron and hole separation efficiency [32]. g-C3N4 showed a broad emission peak centered at approximately 500 nm. This result was due to the characteristic band PL phenomenon involving the photoexcited charge carriers. The PL peak intensity of 30% FeCN was lower than that of g-C3N4, indicating that Fe doping inhibited the recombination rate of electron-hole pairs [33]. The photocurrent density of 30% FeCN was nearly twice that of g-C3N4 proving the charge separation was enhanced. EIS Nyquist diagrams also confirmed that 30% FeCN had a stronger electron transport efficiency [34]. The above results showed that Fe doping and composite could accelerate the charge separation and transfer, inhibit the recombination of electron-hole pairs simultaneously and 30% FeCN/ZIS composites had the most efficient charge separation and transfer. In a word, doping Fe into g-C3N4 would narrow the band and increase light absorption so FeCN showed significantly improved charge separation and transfer rate particularly 30% FeCN. Besides, 30% FeCN/ZIS composites provided massive high-speed charge transfer channels in the contact interface, thus greatly superior improving the separation of photo-generated charges and migration efficiency, two of the aforementioned reasons were beneficial to enhancing the photoreduction Cr(Ⅵ) of composites.
Combined with the bandgap of 30% FeCN (1.63 eV) and ZnIn2S4 (2.32 eV), their band structures were calculated, as shown in Fig. 4i. The appropriate conduction band and valence band positions of 30% FeCN matched with ZnIn2S4. Therefore, under AM 1.5 light irradiation, the photoinduced electrons on ZnIn2S4 could be more easily transferred to 30% FeCN at a faster charge rate which is proved by TRPL, and the photoinduced holes on the VB of 30% FeCN can be transferred to the VB of ZnIn2S4. The Fe-Nx bond accelerated the charge transfer and reduced the recombination of electron-hole pairs. Therefore, it could be observed that the Cr(Ⅵ) reduction rate of 30% FeCN (k = 0.00033 min−1) is much higher than that of g-C3N4 (k = 0.00005 min−1). More importantly, the close interface contact and well-matched energy band structure of 30% FeCN/ZIS composites greatly shorten the charge transfer time and transfer distance, effectively separating electron and hole and greatly improving photocatalytic reduction rate. The synergistic effect made more electrons reduce Cr(Ⅵ) on the surface of 30% FeCN/ZIS, which made the 30% FeCN/ZIS composites exhibit excellent photocatalytic efficiency.
In summary, a novel Fe-doped g-C3N4 and ZnIn2S4 composite was successfully synthesized by a simple water bath method. The optimized photocatalytic reduction rate of Cr(Ⅵ) on 30% FeCN/ZIS was 0.14891 min−1 under AM 1.5 light irradiation, and it was 5 times higher than that of pure ZnIn2S4. XRD, UV-vis DRS, and XPS characterization results showed that iron doping changed the crystal structure of g-C3N4, and as a consequence reduced the bandgap of g-C3N4. The Fe ion doped into g-C3N4 formed a Fe-Nx bond in the intercalation, improving charge separation and expanding the visible region which could be proven by transient photocurrent response and electrochemical impedance spectroscopy characterization. In addition, by growing ZnIn2S4 nanosheets on the surface of Fe doped g-C3N4, the unique close interface contact produced massive high-speed charge transfer channels, which was beneficial to shortening the charge transfer time and distance that was shown in SEM and TEM results. The two favorable factors overlap each other, effectively improving the rate of photoinduced carrier separation and transfer. As a result, significantly improved the rate of photocatalytic reduction of Cr(Ⅵ) in a wide pH range. Furthermore, the 30% FeCN/ZIS composites also had good adsorption for Cr(Ⅲ) and hence could be used as a novel adsorbent. After five cycle tests, it still maintains good performance at a fair good level strengthening the practical usability as well. The Fe-Nx bond formation limited the Fe leaching to avoid second environmental pollution was favored in actual sewage treatment. Consequently, this study provided a reference for the preparation of excellent heterostructure materials to remove chromium ions from water.
Declaration of competing interest
The authors declare that they have no known competing financial interests or personal relationships that could have appeared to influence the work reported in this paper.
Acknowledgment
This work was supported by the National Natural Science Foundation of China (No. 22066022).
Supplementary materials
Supplementary material associated with this article can be found, in the online version, at doi:10.1016/j.cclet.2022.08.006.
[1]
Q. Ge, X. Feng, R. Wang, et al., Environ. Sci. Technol. 54 (2020) 8022–8031. doi: 10.1021/acs.est.0c01018
F. Chen, W. Sun, D. Zhang, et al., Adv. Mater. 34 (2022) 2108504. doi: 10.1002/adma.202108504
Figure 1
(a) The synthesis route of 30% FeCN/ZIS composites. (b) XRD pattern of samples. (c) XRD patterns of carbon nitride doped with different Fe ratios. (d) FTIR spectra of series samples. (e) HRTEM images of 30% FeCN/ZIS. (f) UV–vis DRS spectra and (g) Mott–Schottky plots of series samples.
Figure 2
The XPS spectra of series samples, (a) C 1s, (b) N 1s, (c) Fe 2p, (d) Zn 2p. (e) In 3d and (f) S 2p the high resolution XPS spectra of samples.
Figure 3
The change of Cr(Ⅵ) concentration and its removal kinetics at different pH. (a, d) pH = 4. (b, e) pH = 6. (c, f) pH = 8 and the stability of 30% FeCN/ZIS. (g) Cycle experimental performance diagram. (h) Leaching experiment of iron ion. (i) XRD patterns of the sample before and after the reaction.
Figure 4
(a) Removal of T-Cr and Cr(Ⅵ) by 30% FeCN/ZIS at different pH values. (b) Cr 2p high resolution XPS after 30% FeCN/ZIS reaction. (c) FTIR spectra before and after reaction. (d) Quenching effect of different radical scavengers on removal rate of Cr(Ⅵ). (e) TRPL. (f) PL spectra. (g) Transient photocurrent response. (h) Nyquist impedance plots. (i) The schematic illustration of the reduction of Cr(Ⅵ) on 30% FeCN/ZIS under AM1.5 irradiation.

 DownLoad:

 下载:
下载:


