Figure 1.
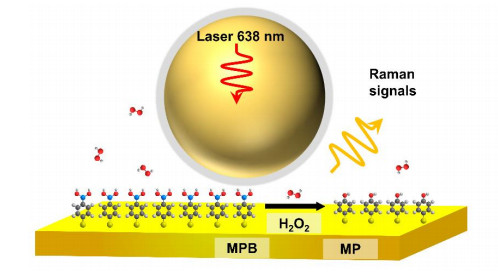
Schematic diagram of ratiometric SHINs substrate

As an active chemical substance that has been extensively studied, reactive oxygen species (ROS) play an important role in physiological and pathological processes[1]. Abnormal changes of ROS could lead to diseases (e.g., chronic granulomatosis, cancer, arteriosclerosis). Among various ROS, hydrogen peroxide (H2O2) is an important component which is mainly used as an important signal molecule for cell growth, proliferation and differentiation in cells[2-4]. The amount of H2O2 is also related to physiological and pathological processes such as aging, Alzheimer's disease and cancers. Meanwhile, excess production of H2O2 attacks organs or living biomolecules in cells like proteins, liposomes and DNA[5-8], so it is particularly important to real-time monitor the concentration of H2O2 in vivo. Currently, the common methods used to detect H2O2 include electrochemical sensing[9], colorimetric detection[10], and fluorescence analysis[11, 12]. Especially, fluorescence analysis is widely used in the detection of H2O2 in cells. However, the high fluorescence background from the species in the cells and the rapid photo-bleaching of fluorescent probe would cause inaccurate results of tests and greatly limits the application of this technology.
Surface Enhanced Raman spectroscopy (SERS) is a fingerprint spectroscopic technology with extremely high sensitivity down to single molecule, which is suitable for the detection of trace species. Meanwhile, compared with fluorescence analysis, SERS has the advantage of resisting photobleaching and high fluorescence background in detection[13-16]. To date, SERS technology was widely used in various fields, especially in the biological system. Nevertheless, some inorganic molecules with small Raman cross section, such as hydrogen peroxide, carbon monoxide and hydrogen sulfide, were hard to directly detect. In addition, the signal of detected molecule can be enhanced only when the molecule is located at the hot spot due to the near-field effect.
In order to solve the above problems, ratiometric SERS nanoprobes were proposed for the quantitative detection of inorganic small molecules in biological system[17-27]. For example, according to the principle that p-aminobenzenethiol (ABT) can diazotize with an equimolecular nitric oxide (NO) at acidic conditions, Alvarez-Puebla group designed a ratiometric SERS substrate to quantitatively detect NO by self-assembly of p-aminobenzenethiol (ABT) on substrate[17]. Long and their colleagues took advantage of this feature that palladacycle can react with CO to generate carbonyl products, which will produce the change of SERS signal to construct a ratiometric SERS nanoprobe for quantitative detection of CO content in the cells[18]. Furthermore, the ratiometric SERS nanoprobes can also be used to sense the change of pH. Yang and their co-workers used a pH-sensitive molecule, 4-aminothiophenol (4-ATP), to construct the ratiometric SERS substrate for detecting the change of pH[21].
Herein, we designed and synthesized a new ratiometric SERS nanoprobe based on SHINs (Au@SiO2, shell-isolated nanoparticles) for quantitative detection of H2O2. According to the previous reference report, p-mercaptophenylboric acid (MPB) molecule can react with equimolecular H2O2 to produce p-mercaptophenol (MP), following the Raman spectrum peaks of MPB and MP with obvious differences[28-31]. Based on this reaction, we assembled MPB molecules on the Au film and then dropped SHINs on it to prepare a ratiometric SHINs probe for quantitative detection of H2O, as shown in Fig. 1. The Au film/MPB nanosensors can react with H2O2 quickly and selectively in solution. Meanwhile, SHINs can not only enhance the Raman signal on the Au film to observe small changes of Raman signal, but also ensure that the Au core will not be interfered by impurity.
The 4-mercaptophenylboronic acid (MPB, 97%), 4-mercaptophenol (MP, 97%), and hydrogen peroxide solution (H2O2, 30 wt% in H2O) were purchased from Aladdin. Chloroauric acid (HAuCl4·3H2O, 99.99%), sodium citrate (99.0%), and (3-aminopropyl) trimethoxysilane (APTMS, 97%) were purchased from Alfa Aesar; Sodium silicate solution (27% SiO2) was purchased from Sigma-Aldrich. All the chemicals were used directly without purification. Deionized Milli-Q water (~18.2 MΩ⋅cm) was used throughout the study. Raman spectrum was recorded on a confocal Raman system Xplora Plus (Jobin-Yvon Horiba) with a 638 nm laser (and the laser power is 1.6 mW) and 50× magnification (0.5 NA).
The first step of preparing SHINs was the synthesis of 55 nm Au nanoparticles[32]: 1.5 mL sodium citrate solution (1 wt%) was quickly added to 200 mL HAuCl4 (0.01 wt%) boiling solution and heated to reflux for 30 minutes, then naturally cooled to room temperature for subsequent experiments.
The second step was the preparation of the shell[33, 34]: The prepared Au sol was added with 0.4 mL APTMS solution (1 mM) and stirred at room temperature for 15 min. After that, 3 mL of sodium silicate solution (0.54 wt%) was added to the sol. Finally, the sol was transferred to a 95 ℃ water bath with stirring for 15 min, and then cooled in an ice bath. The silicon shell with a thickness of about 1~2 nm was coated.
The Au film was immersed in an 1 mM MPB ethanol solution for 1~2 hours to form the MPB molecules which self-assembled into monolayers on the Au film. Then, a large amount of ethanol was rinsed to remove the physically adsorbed MPB molecules on the surface. Finally, the SHINs particles were dropped on the Au film and dried by pure nitrogen.
Fig. 2a shows the SERS spectra and the structural formulas of MPB and MP. In Fig. 2a, there are specific differences in the characteristic peaks of MPB and MP. The Raman shifts at 999 and 1023 cm-1 in MPB molecule are attributed to the symmetric stretching vibration of B–O and the deformation vibration of B–O–H, respectively, while that at 1078 cm-1 in MP to the in-plane deformation vibration of C–H. Moreover, in Fig. 2a, the structure of MPB molecule is similar to MP because they both have the benzene ring structure (the corresponding Raman shift at 1078 cm-1), which means the benzene ring structure does not change during the reaction of MPB molecule and H2O2 to form MP molecule. Only the B–O reacted with H2O2 and disappeared. Therefore, this disappearance characterized H2O2 in the following experiments. MPB reacted in equimolecular H2O2, so the same amount of MPB and H2O2 is consumed in solution. Besides, the structure of the benzene ring with specific Raman characteristic peaks does not change in this reaction, so we can use the characteristic peak of benzene ring (1078 cm-1) as the internal standard to calibrate the Raman signal.
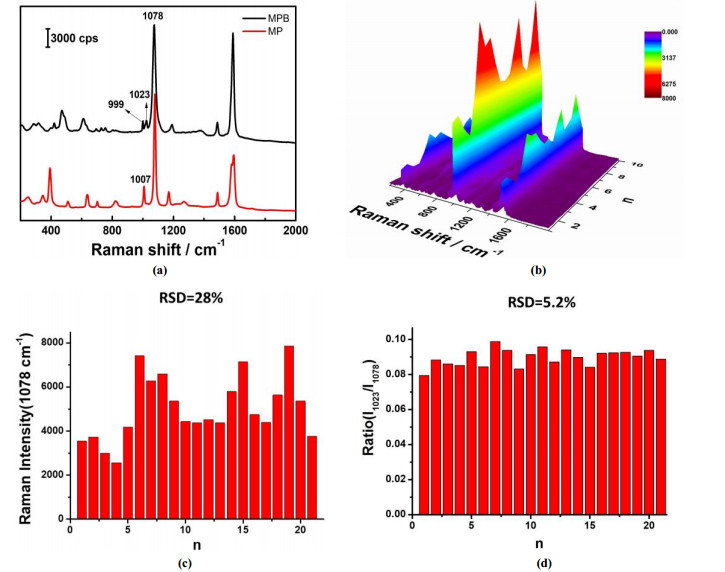
In order to ensure the method can accurately quantify H2O2, we first verified the reproducibility of this method. Fig. 2b shows the SERS spectra of randomly collected 20 points on the ratiometric SHINs nanoprobe. It can be seen from Fig. 2b that there is a large difference in Raman intensity between different points. Simultaneously, we calculated the intensity of the strongest peak (1078 cm-1) in Fig. 2b, and obtained the histogram as shown in Fig. 2c. We found that the relative standard deviation of Raman intensity for 1078 cm-1 between different points was 28%, which means the SHINs substrate was extremely nonuniformity and cannot be used for quantitative detection. As mentioned above, the structure of the benzene ring does not change in this experiment, so the characteristic peak of the benzene ring (1078 cm-1) could be used as the internal standard to calibrate the Raman signal. Fig. 2d shows the histogram of intensity for 1023 cm-1 after calibration by using 1078 cm-1 as the internal standard. As we can find that the relative standard deviation of 1023 cm-1 is 5.2% (after internal standard calibration), which meets the requirements of quantitative analysis. It means that this method can be used for quantitative analysis.
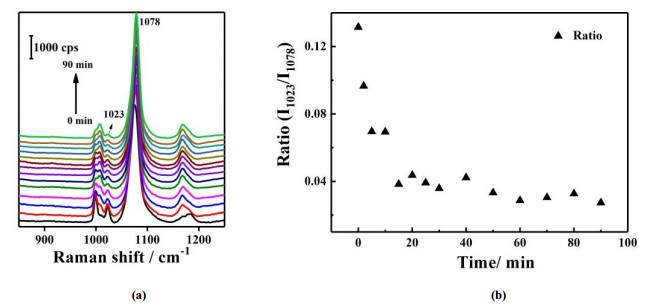
In addition to reproducibility, reaction time is also a key factor in the analysis. We explored the reaction time of H2O2 with ratiometric SHINs nanoprobe. As shown in Fig. 3a, there is SERS spectrum of ratiometric SHINs nanoprobe placed in 10 μM H2O2 solution with different reaction time. It can be found the extent of reaction for MPB is various in different reaction time. And, as the reaction time goes on, the Raman characteristic peak of B–O becomes smaller and smaller, and finally tends to be stable. Therefore, we plotted the Raman intensity of B–O (normalized by the characteristic peaks of the benzene ring) as the function of reaction time, with the result shown in Fig. 3b. It is not difficult to find that the reaction progresses gradually with time and reaches stability in about 20 minutes. After 20 minutes of reaction, this Raman intensity of B–O tended to be constant. It indicates that the ratiometric SHINs sensor responds quickly to H2O2, which could respond completely within 20 minutes. Thus, this ratiometric SHINs probe can be used for rapid detection of H2O2. And, in the subsequent experiments, the reaction time of MPB and H2O2 was 20 minutes.
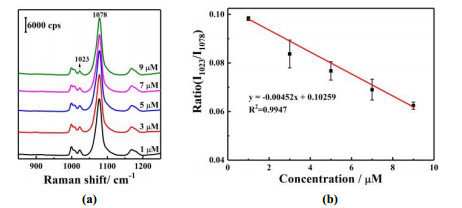
Firstly, we used different concentrations of H2O2 standard solution to verify the feasibility of this method. We placed ratiometric SHINs nanoprobe in as-prepared series of H2O2 solution with different concentrations (from 1 to 9 μM), and reacted for 20 minutes. Then we took them out and rinsed the surface of ratiometric SHINs nanoprobe with a large amount of ultrapure water to remove the physical adsorption. Fig. 4a shows the SERS spectrum of ratiometric SHINs nanoprobe in different concentrations of H2O2 solution. The results show that the higher the concentration of H2O2, the smaller the Raman intensity of B–O (1023 cm-1), which means the MPB on the nanoprobe was gradually consumed to produce MP. Then, the Raman characteristic peak of MPB (1023 cm-1, normalized by 1078 cm-1) and the different concentrations of H2O2 were charted and shown in Fig. 4b. It can be found that the Raman intensity of MPB was inversely proportional to the concentration of H2O2. And the higher the concentration of H2O2, the smaller the Raman intensity of MPB. Meanwhile, we also carried out the linear fitting to the curve and the correlation can reach 0.9947, which indicates that this curve could achieve the quantitative detection for H2O2 in this concentration range. The above experiments prove that this method can be used for the quantitative detection of H2O2.
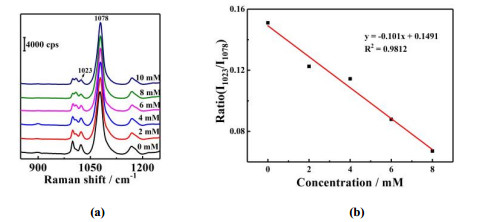
As people's diet changes, the number of people suffered from diabetes has also risen sharply. Various complications of this disease cause serious harm to human body, such as heart disease, cataract, kidney disease and so on. One of the hallmarks of diabetes is high levels of glucose in the blood[35, 36]. Therefore, it is very important to monitor the concentration of glucose in blood. As we all know, the glucose could be hydrolyzed by glucose oxidase to generate H2O2. Encouraged by the promising results obtained in standard solution, we further extended this method to the actual application system. Thus, we used glucose oxidase to hydrolyze glucose to produce H2O2, and then used the above-mentioned ratiometric SHINs nanoprobe to quantitatively detect H2O2. We placed ratiometric SHINs nanoprobe in the mixture solution of glucose solution and glucose oxidase for 30 minutes. Then we removed it from the mixture solution and rinsed it by ultrapure water to remove the physical adsorption from the nanoprobe surface. Finally, we directly conducted the Raman test of ratiometric SHINs nanoprobe.
After the Raman test, the results are shown in Fig. 5a. It can be found that the mixture without glucose (0 mM) shows a MPB response, which indicates MPB molecules do not react with glucose oxidase. Moreover, with the increase of the concentration of glucose, the characteristic peak of MPB gradually decreased and the characteristic peak of MP gradually enhanced, which means the MPB molecule is converted in the presence of glucose. In other words, glucose oxidase hydrolyzes glucose to H2O2, causing MPB molecules to react with H2O2. This means that MPB reacts with H2O2 specifically to produce MP, which further proves that this method has good selectivity. Hence, the content of glucose can be deduced back according to the consumption amount of MPB, thereby achieving the quantitative detection of glucose. And we can also find that the more glucose added, the more H2O2 produced, and the more MPB consumed. Then we plotted the curve of Raman intensity of the characteristic peak of MPB at 1023 cm-1 (normalized by 1078 cm-1) with glucose at different concentrations (Fig. 5b). There is a negative correlation between the concentration of glucose and the Raman intensity of the characteristic peak for MPB, which means that the higher the glucose concentration, the more MPB consumed on the ratiometric SHINs nanoprobe. At the same time, we also carried out the linear fitting for this curve, and the correlation can reach 0.9812. There is a good correlation between the MPB consumption on the ratiometric SHINs nanoprobe and the concentration of glucose, which can be used for the quantitative determination of glucose.
In conclusion, we have developed a new method for quantitative detection H2O2 based on ratiometric SHINs nanoprobe. Here, the SHINs are not only the Raman signal amplifier, but also can protect the Au core from the interference of impurities. Furthermore, this method is user-friendly and stable with high bio-compatibility. We have successfully used this method to quantitatively detect the actual sample-glucose, with the correlation coefficient up to 0.9812. Therefore, this method provides a new idea for detecting inorganic molecules with low Raman cross section, and expands the application of SERS technology in biological systems.
Rhee, S. G. H2O2, a necessary evil for cell signaling. Science 2006, 312, 1882−1883. doi: 10.1126/science.1130481
Winterbourn, C. C. Reconciling the chemistry and biology of reactive oxygen species. Nat. Chem. Biol. 2008, 4, 278−286. doi: 10.1038/nchembio.85
Burmistrova, N. A.; Meier, R. J.; Schreml, S.; Duerkop, A. Reusable optical sensing microplate for hydrogen peroxide using a fluorescent photoinduced electron transfer probe (HP Green). Sensor. Actuat. B: Chem. 2014, 193, 799−805. doi: 10.1016/j.snb.2013.12.025
Murphy, M. P.; Holmgren, A.; Larsson, N. G.; Halliwell, B.; Chang, C. J.; Kalyanaraman, B.; Rhee, S. G.; Thornalley, P. J.; Partridge, L.; Gems, D.; Nyström, T.; Belousov, V.; Schumacker, P. T.; Winterbourn, C. C. Unraveling the biological roles of reactive oxygen species. Cell Metab. 2011, 13, 361−366. doi: 10.1016/j.cmet.2011.03.010
Duan, X. B.; Berthiaume, F.; Yarmush, D.; Yarmush, M. L. Proteomic analysis of altered protein expression in skeletal muscle of rats in a hypermetabolic state induced by burn sepsis. Biochem. J. 2006, 397, 149−158. doi: 10.1042/BJ20051710
Finkel, T.; Serrano, M.; Blasco, M. A. The common biology of cancer and ageing. Nature 2007, 448, 767−774. doi: 10.1038/nature05985
Stone, J. R.; Yang, S. Hydrogen peroxide: a signaling messenger. Antioxid. Redox Sign. 2006, 8, 243−270. doi: 10.1089/ars.2006.8.243
Barnham, K. J.; Masters, C. L.; Bush, A. I. Neurodegenerative diseases and oxidative stress. Nat. Rev. Drug Discov. 2004, 3, 205−214. doi: 10.1038/nrd1330
Kafi, A. K. M.; Wu, G.; Chen, A. A novel hydrogen peroxide biosensor based on the immobilization of horseradish peroxidase onto Au-modified titanium dioxide nanotube arrays. Biosens. Bioelectron. 2008, 24, 566−571. doi: 10.1016/j.bios.2008.06.004
Chen, S.; Hai, X.; Chen, X. W.; Wang, J. H. In situ growth of silver nanoparticles on graphene quantum dots for ultrasensitive colorimetric detection of H2O2 and glucose. Anal. Chem. 2014, 86, 6689−6694. doi: 10.1021/ac501497d
Lippert, A. R.; Van de Bittner, G. C.; Chang, C. J. Boronate oxidation as a bioorthogonal reaction approach for studying the chemistry of hydrogen peroxide in living systems. Acc. Chem. Res. 2011, 44, 793−804. doi: 10.1021/ar200126t
Xu, K.; Qiang, M.; Gao, W.; Su, R.; Li, N.; Gao, Y.; Xie, Y.; Kong, F.; Tang, B. A near-infrared reversible fluorescent probe for real-time imaging of redox status changes in vivo. Chem. Sci. 2013, 4, 1079−1086. doi: 10.1039/c2sc22076h
Hou, S. S.; Xu, Z. T.; Zhang, Y. K.; Xie, G.; Gan, L. Z. Enhanced CO2 electrolysis with Mn-doped SrFeO3-δ cathode. Chin. J. Struct. Chem. 2020, 39, 119−125.
Song, M. J.; Zhang, L. Z.; Wang, G. F. Growth and spectroscopic investigations of disordered Nd3+: Li3Ba2La3(MoO4)8 crystal. Chin. J. Struct. Chem. 2013, 5, 730−738.
Zhu, M.; Lu, G. F.; Zhu, Y.; Lu, A. X.; Ou, Z. P. Synthesis, crystal structure and electrochemical property of 5, 10, 15, 20-tetrakis(4-chlorophenyl)porphyrin. Chin. J. Struct. Chem. 2012, 7, 921−924.
Wang, J. G.; Lin, W.; Zhong, C. J.; Qi, X. Y.; Zhou, J. X.; Yi, D. L. Synthesis and crystal structure of (E)-ethyl 2-(5-(3-methyl-2-butenyloxy)-2-(3-(4-(3-methyl-2-butenyloxy)phenyl)acryloyl)phenoxy)acetate. Chin. J. Struct. Chem. 2011, 30, 604−608.
Rivera_Gil, P.; Vazquez-Vazquez, C.; Giannini, V.; Callao, M. P.; Parak, W. J.; Correa-Duarte, M. A.; Alvarez-Puebla, R. A. Plasmonic nanoprobes for real-time optical monitoring of nitric oxide inside living cells. Angew. Chem. Int. Ed. 2013, 125, 13939−13943. doi: 10.1002/ange.201306390
Li, D. W.; Qu, L. L.; Hu, K.; Long, Y. T.; Tian, H. Monitoring of endogenous hydrogen sulfide in living cells using surface-enhanced Raman scattering. Angew. Chem. Int. Ed. 2015, 54, 12758−12761. doi: 10.1002/anie.201505025
Huang, X.; Song, J.; Yung, B. C.; Huang, X.; Xiong, Y.; Chen, X. Ratiometric optical nanoprobes enable accurate molecular detection and imaging. Chem. Soc. Rev. 2018, 47, 2873−2920. doi: 10.1039/C7CS00612H
Xu, Q.; Liu, W.; Li, L.; Zhou, F.; Zhou, J.; Tian, Y. Ratiometric SERS imaging and selective biosensing of nitric oxide in live cells based on trisoctahedral gold nanostructures. Chem. Commun. 2017, 53, 1880−1883. doi: 10.1039/C6CC09563A
Hanif, S.; Liu, H.; Chen, M.; Muhammad, P.; Zhou, Y.; Cao, J.; Ahmed, S. A.; Xu, J.; Xia, X.; Chen, H.; Wang, K. Organic cyanide decorated sers active nanopipettes for quantitative detection of hemeproteins and Fe3+ in single cells. Anal. Chem. 2017, 89, 2522−2530. doi: 10.1021/acs.analchem.6b04689
Wang, W.; Zhang, L.; Li, L.; Tian, Y. A single nanoprobe for ratiometric imaging and biosensing of hypochlorite and glutathione in live cells using surface-enhanced Raman scattering. Anal. Chem. 2016, 88, 9518−9523. doi: 10.1021/acs.analchem.6b02081
Ma, D.; Zheng, J.; Tang, P.; Xu, W.; Qing, Z.; Yang, S.; Li, J.; Yang, R. Quantitative monitoring of hypoxia-induced intracellular acidification in lung tumor cells and tissues using activatable surface-enhanced Raman scattering nanoprobes. Anal. Chem. 2016, 88, 11852−11859. doi: 10.1021/acs.analchem.6b03590
Cui, J.; Hu, K.; Sun, J. J.; Qu, L. L.; Li, D. W. SERS nanoprobes for the monitoring of endogenous nitric oxide in living cells. Biosens. Bioelectron. 2016, 85, 324−330. doi: 10.1016/j.bios.2016.04.094
Chen, P.; Wang, Z.; Zong, S.; Zhu, D.; Chen, H.; Zhang, Y.; Wu, L.; Cui, Y. pH-sensitive nanocarrier based on gold/silver core-shell nanoparticles decorated multi-walled carbon manotubes for tracing drug release in living cells. Biosens. Bioelectron. 2016, 75, 446−451. doi: 10.1016/j.bios.2015.09.002
Tian, L.; Tadepalli, S.; Fei, M.; Morrissey, J. J.; Kharasch, E. D.; Singamaneni, S. Off-resonant gold superstructures as ultrabright minimally invasive surface-enhanced Raman scattering (SERS) probes. Chem. Mater. 2015, 27, 5678−5684. doi: 10.1021/acs.chemmater.5b02100
Cao, Y.; Li, D. W.; Zhao, L. J.; Liu, X. Y.; Cao, X. M.; Long, Y. T. Highly selective detection of carbon monoxide in living cells by palladacycle carbonylation-based surface enhanced Raman spectroscopy nanosensors. Anal. Chem. 2015, 87, 9696−9701. doi: 10.1021/acs.analchem.5b01793
Zhang, K.; Wang, Y.; Wu, M.; Liu, Y.; Shi, D.; Liu, B. On-demand quantitative SERS bioassays facilitated by surface-tethered ratiometric probes. Chem. Sci. 2018, 9, 8089−8093. doi: 10.1039/C8SC03263G
Qu, L. L.; Liu, Y. Y.; He, S. H.; Chen, J. Q.; Liang, Y.; Li, H. T. Highly selective and sensitive surface enhanced Raman scattering nanosensors for detection of hydrogen peroxide in living cells. Biosens. Bioelectron. 2016, 77, 292−298. doi: 10.1016/j.bios.2015.09.039
Peng, R.; Si, Y.; Deng, T.; Zheng, J.; Li, J.; Yang, R.; Tan, W. A novel SERS nanoprobe for the ratiometric imaging of hydrogen peroxide in living cells. Chem. Commun. 2016, 52, 8553−8556. doi: 10.1039/C6CC03412H
Gu, X.; Wang, H.; Schultz, Z. D.; Camden, J. P. Sensing glucose in urine and serum and hydrogen peroxide in living cells by use of a novel boronate nanoprobe based on surface-enhanced Raman spectroscopy. Anal. Chem. 2016, 88, 7191−7197. doi: 10.1021/acs.analchem.6b01378
Frens, G. Controlled nucleation for the regulation of the particle size in monodisperse gold suspensions. Nat. Phys. Sci. 1973, 241, 20−22. doi: 10.1038/physci241020a0
Li, J. F.; Huang, Y. F.; Ding, Y.; Yang, Z. L.; Li, S. B.; Zhou, X. S.; Fan, F. R.; Zhang, W.; Zhou, Z. Y.; Wu, D. Y.; Ren, B.; Wang, Z. L.; Tian, Z. Q. Shell-isolated nanoparticle-enhanced Raman spectroscopy. Nature 2010, 464, 392−395. doi: 10.1038/nature08907
Li, J. F.; Tian, X. D.; Li, S. B.; Anema, J. R.; Yang, Z. L.; Ding, Y.; Wu, Y. F.; Zeng, Y. M.; Chen, Q. Z.; Ren, B.; Wang, Z. L.; Tian, Z. Q. Surface analysis using shell-isolated nanoparticle-enhanced Raman spectroscopy. Nat. Protoc. 2012, 8, 52−65.
Sun, D.; Qi, G.; Xu, S.; Xu, W. Construction of highly sensitive surface-enhanced Raman scattering (SERS) nanosensor aimed for the testing of glucose in urine. RSC Adv. 2016, 6, 53800−53803. doi: 10.1039/C6RA06223G
Sooraj, K. P.; Ranjan, M.; Rao, R.; Mukherjee, S. SERS based detection of glucose with lower concentration than blood glucose level using plasmonic nanoparticle arrays. Appl. Surf. Sci. 2018, 447, 576−5 doi: 10.1016/j.apsusc.2018.04.020

Figure 2 (a) SERS spectrum and molecular formulas of MPB and MP; (b) SERS spectrum of randomly collected 20 points on the ratiometric SHINs nanoprobe; (c) Histogram of Raman intensity for 1078 cm-1; (d) Ratio of Raman intensity for 1023 and 1078 cm-1

Figure 3 (a) SERS spectrum of ratiometric SHINs nanoprobe placed in 10 μM H2O2 solution for different reaction times (b) Ratio of Raman intensity for 1023 and 1078 cm-1 plotted reaction time

Figure 4 (a) SERS spectrum of ratiometric SHINs nanoprobe in different concentrations of H2O2 solution; (b) Curve of different concentrations of H2O2 plotting the ratio of Raman intensity for 1023 and 1078 cm-1

 扫一扫看文章

扫一扫关注我们
 DownLoad:

 下载:
下载:
