Citation:
Pan Wang, Huixuan Zhang, Zhuohan Wu, Xiao Zhao, Ying Sun, Na Duan, Zhidan Liu, Wen Liu. A data-based review on norfloxacin degradation by persulfate-based advanced oxidation processes: Systematic evaluation and mechanisms[J]. Chinese Chemical Letters,
2023, 34(12): 108722.
doi:
10.1016/j.cclet.2023.108722
A data-based review on norfloxacin degradation by persulfate-based advanced oxidation processes: Systematic evaluation and mechanisms
English
A data-based review on norfloxacin degradation by persulfate-based advanced oxidation processes: Systematic evaluation and mechanisms
College of Water Resources and Civil Engineering, China Agricultural University, Beijing 100083, China
b.
College of Environmental Sciences and Engineering, Peking University, Beijing 100871, China
c.
Beijing Key Laboratory of Farmland Soil Pollution Prevention and Remediation, College of Resources and Environmental Sciences, China Agricultural University, Beijing 100193, China
Received Date:
23 February 2023 Accepted Date:
21 June 2023 Revised Date:
05 June 2023 Available Online:
15 December 2023
Abstract:
Persulfate-based advanced oxidation processes (AOPs) have obtained increasing attention due to the generation of sulfate radical (SO4•‒) with high reactivity for organic contaminants degradation. Numerous activation methods have been used to activate two common persulfates: peroxymonosulfate (PMS) and peroxydisulfate (PDS). However, the comparisons of activation methods and two oxidants in the comprehensive degradation performance of the target contaminant are still limited. Thus, taking norfloxacin (NOR) as the target contaminant, we proposed five key parameters (the observed pseudo-first-order rate constant, kobs; average mineralization rate, rm; utilization efficiency of catalyst, Ucat; utilization efficiency of oxidant, Uox; and net utilization efficiency of oxidant, Uox') to quantify the comprehensive degradation performance of NOR. The irradiation affected target pollutants, catalysts, and oxidants, leading to an improved degradation performance of NOR. Various heterogeneous catalysts were compared in terms of the key elements contained. Fe, Co, and Mn-based materials performed better, while carbon-based catalysts performed poorly on NOR degradation. The overall degradation performance of NOR was different for PMS and PDS, which can be ascribed to their varied reaction pathways towards NOR, but stemmed from different properties of PMS and PDS. Besides, the effect of pH on the degradation efficiency of NOR was investigated. A neutral solution was optimal for PMS system, while an acidic solution worked better for PDS system. Finally, we analyzed the molecule structure of NOR by density functional theory (DFT) calculation to study the sites easy to attack. Then, we summarized four typical degradation pathways of NOR in SO4•‒-based AOP systems, including defluorination, piperazine ring cleavage, piperazine ring oxidation, and quinoline group transformation.
Persulfate-based advanced oxidation processes (AOPs) is an efficient strategy to remove organic pollutants. Peroxymonosulfate (PMS) and peroxydisulfate (PDS) are two common persulfates which can be activated to generate sulfate radical (SO4•‒) [1]. Compared to hydroxyl radical (•OH), SO4•‒ has higher redox potential, longer half-life, a wider range of pH applications, and greater selectivity [2]. Subsequently, increasing numbers of review articles concerning persulfate-based AOPs have been published in recent years. Various activation methods, mechanisms, applications, and influencing factors for the activation of PMS and PDS [3,4] were summarized [5]. While, some other reviews focused on activators/catalysts and their properties/categories, mechanisms, and modification. Researchers gave thorough reviews on some commonly used materials, including carbon nanotube-based materials [6,7], graphitic carbon nitride (g-C3N4)-based materials [8], biochar composites [9], carbon-based materials [10,11], iron-based catalysts [12–15], copper catalysts [16], metal-based catalysts [17], layered double hydroxide-based materials [18], and visible-light-driven heterogeneous catalysts [19]. Moreover, the non-radical reaction mechanisms of PMS and PDS to various organic pollutants were in the spotlight [20,21]. The practical applications of persulfate-based AOPs in addressing environmental contamination [22–25] and diverse sustainability challenges [26] were overviewed as well. However, to our best knowledge, few reviews tried to give a comprehensive comparison of persulfate-based AOPs based on experimental data. Researchers used varied activators/catalysts under different experimental conditions, making it hard to evaluate or compare the performance between studies. Thus, a data-based review and a series of evaluating parameters are highly in need.
Persulfate-based AOPs were extensively used to remove various types of organic pollutants, including dyes [27–31], pesticides [32,33], pharmaceuticals [34–36], etc. In recent decades, the residuals of antibiotic in the environment have received widespread attention due to their extensive use and persistency [37,38]. Persulfate-based AOPs were widely applied for the degradation of antibiotics, such as ciprofloxacin [39,40], sulfamethoxazole [41–43], tetracycline [44,45]. Norfloxacin (NOR), as one of the most widely used fluoroquinolone antibiotics in the world [46], was often detected in drinking water, natural water bodies, and sewage treatment plant [47–49] due to its recalcitrance. The long-term residue of NOR in the aqueous environment may induce potential risks to ecosystem and human health. To remove NOR, persulfate-based AOPs are efficient alternatives and have been investigated intensively. Thus, NOR can serve as a representative target contaminant for systematical comparison of persulfate-based AOPs.
Taking NOR as the problem pollutant, we can give a fair examination on the performance of both activators/catalysts and oxidants (PMS and PDS). Varied activators/catalysts were used, including light, ultrasound, heat, base, and transition metals, etc., to activate persulfate [50]. The enhancement of irradiation on kinetic and removal efficiency [51,52] have been demonstrated in some publications, while how the irradiation can influence the utilization efficiency of catalysts and oxidants are unknown. The overall mechanisms should be summarized as well. In addition, a comprehensive examination on various heterogeneous catalysts and oxidants also should be performed in one normalized evaluating system. Solution pH can greatly influence the NOR degradation by persulfate-based AOPs, while mixed opinions were reported on its effect. For example, the highest degradation efficiency of NOR was found at pH 11 under PMS activation by α-MnO2/MnFe2O4 [53], while the degradation of NOR was restrained in alkaline (pH 11) solution in the CoFe2O4-SAC/PMS system [54]. Different degradation pathways for NOR have been proposed, and a systematic summary is needed.
Herein, NOR is selected as a target contaminant in the present work and the main objectives are to: ⅰ) establish a comprehensive evaluation system for NOR degradation; ⅱ) investigate the influence of various activation methods on NOR degradation performance, including the addition of irradiation (ultrasound, US; ultraviolet light A, UVA; vacuum ultraviolet light, VUV; and visible light, Vis) and heterogeneous catalysts; ⅲ) compare the differences between PMS and PDS based on proposed evaluation system; ⅳ) discuss the effect of pH on the degradation efficiency of NOR; and ⅴ) analyze molecule structure of NOR and summarize its typical degradation pathways.
2.
Methods
2.1
Data sources
We searched for all publications on the web of science by limiting the topic to “norfloxacin and (peroxymonosulfate or peroxydisulfate or persulfate)” and 126 outcomes were found. To determine whether the search results met our criteria, each literature was examined manually. We excluded all irrelevant studies (the addition of homogeneous catalysts, etc.) and a total of 39 studies remained. The reactors used in these literatures were all small-scale batch reactors. Then we summarized and calculated based on the original data of 39 studies.
2.1.1
Effect of irradiation
First, we extracted the data from the literature with additional irradiation (US, UVA, VUV, and Vis) and grouped them as “irradiation” group. The data from the same literature for the experimental sets with no irradiation (commonly referred to as control or blank for comparison) under otherwise identical conditions were also collected and regarded as “no irradiation” group. For two groups, the parameters were calculated (Table S1 in Supporting information) and compared.
2.1.2
Comparison of the heterogeneous catalysts
In this part, we took data without irradiation originally from literature and combined them with the data of “no irradiation” group from Section 2.1.1. In this section, the raw data (Table S2 in Supporting information) were classified into 13 groups in terms of the element contained in the catalysts. The carbon-based catalysts with no metal element were named “C” groups. While other catalysts were classified into “Fe”, “Co”, “Cu”, etc. according to the metal elements contained in them.
2.1.3
Comparison of the oxidants
The data used in this section were the same as those in Section 2.1.2, but were divided according to the oxidant used, and named “PMS” and “PDS” groups. The parameters were calculated (Table S3 in Supporting information) and compared in each category.
2.1.4
Effect of pH
To probe the effect of pH, raw data of NOR degradation efficiency (%) as a function of pH were firstly extracted. The efficiency at pH 7 in each study was set as 100%. The normalized degradation efficiency (Table S4 in Supporting information) can be calculated per (Eq. 1):
(1)
2.2
Key parameters to quantify the efficiency of catalyst and oxidant
The observed pseudo-first-order rate constant (kobs, min−1) is commonly used to evaluate the degradation kinetics of NOR. This constant can be found in most studies [55–57] and calculated per (Eq. 2):
(2)
where Ct refers to the concentration of NOR at time t, C0 refers to the initial NOR concentration.
Mineralization refers to the target contaminant is degraded to CO2 and H2O [58]. Usually, the difference between initial TOC (TOC0) and final TOC (TOCt) is used to calculate the degree of mineralization. To measure the ability of the system to mineralize the target contaminant within time t, we propose the average mineralization rate (rm, mg L−1 min−1), which can be calculated through (Eq. 3):
(3)
The utilization efficiency of both catalyst and oxidant are important to guide to select catalyst or oxidant. Thus, we propose two parameters to quantify the utilization efficiency of catalyst (Ucat) and oxidant (PMS and PDS, Uox), which can be defined as the ratio of the degraded NOR (mg/L) to the initially introduced catalyst (mg/L) or oxidant (mmol/L) (Eqs. 4 and 5):
(4)
(5)
where Ccat0 and Cox0 represent the initial concentration of catalyst and oxidant, respectively.
Recently, increasing studies have proved that oxidants can also be consumed during the degradation of target pollutants [59,60] and eventually converted into sulfates [61]. Several methods have been reported for the quantitative determination of PMS and PDS [62–64]. The most commonly used are spectrophotometric methods, including modified 2,2′-azino-bis(3-ethylbenzothiazoline-6-sulfonic acid)diammonium salt (ABTS) [65] and iodometric titration [66] method. Instead of using the initially introduced oxidant (Cox0) in the utilization efficiency of oxidant, the consumed oxidant (ΔCox = Cox0 - Coxt) was used to calculate the net utilization efficiency of oxidant (Uox'). Thus, the net utilization efficiency of oxidant (Uox') is defined as the ratio of the degraded NOR (mg/L) to the consumed oxidant (mmol/L) (Eq. 6):
(6)
In the five parameters, only the value of kobs were extracted directly, and other parameters were calculated based on the extracted raw data. In addition, only the parameters of kobs and Uox' [67] have been used in the previous articles.
3.
Results and discussion
3.1
Effect of irradiation
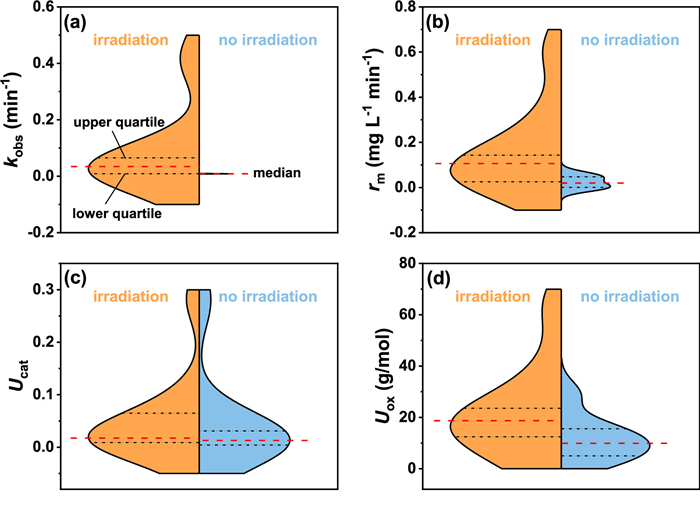
The overall NOR degradation performance for the systems with or without irradiation was compared based on four key parameters (Fig. 1). Apparently, there was great dispersion of data with irradiation (orange violin plots) compared to no irradiation (blue violin plots), especially the observed pseudo-first-order rate constant (Fig. 1a) and average mineralization rate (Fig. 1b). In addition, irradiation increased the observed pseudo-first-order rate constant (Fig. 1a), average mineralization rate (Fig. 1b), and utilization efficiency of oxidant (Fig. 1d) significantly. While the improvement of irradiation on utilization efficiency of catalyst (Fig. 1c) was moderate. For kobs (Fig. 1a), the dispersion degree of data with irradiation was much greater than that without irradiation, which was possible because the sample volume of kobs for no irradiation (n = 2) was little. Besides, the lower quartile with irradiation (lower black dashed line of orange violin plot) was equal to the median with no irradiation (red dashed line of blue violin plot) for kobs (Fig. 1a), suggesting that 75% of data with irradiation was higher than 50% without irradiation for the value of kobs. Irradiation enhanced NOR degradation rate resulting in higher kobs values. Extracted data also revealed that kobs increased in all cases after irradiation was used (Fig. S1a in Supporting information). Similarly, in comparison to irradiation, the data of rm (Fig. 1b) without irradiation was relatively centralized. The lower quartile of rm with irradiation (lower black dashed line of orange violin plot) was greater than the median with no irradiation (red dashed line of blue violin plot in Fig. 1b), meaning that irradiation improved rm of NOR significantly. The values of rm for each case were all increased by 2.09~3.73 times compared to no irradiation (Fig. S1b in Supporting information). The median of Ucat with irradiation (red dashed line of orange violin plot) was slightly higher than that without irradiation (red dashed line of blue violin plot in Fig. 1c), indicating that utilization efficiency of catalyst was a little bit high with irradiation. In all the cases, the Ucat increased more than 1-fold after irradiation was used (Fig. S1c in Supporting information). Moreover, the utilization efficiency of catalyst for MnO2/PDS system without UVA (0.2810) was much larger than in other cases without irradiation [68]. The data distribution of Uox (Fig. 1d) was consistent with rm, demonstrating that the enhancement of irradiation on Uox was also remarkable. The values of Uox all increased by the input of irradiation (Fig. S1d in Supporting information). Especially, the utilization efficiency of oxidant in the system of Laterite/PDS/UVA (22.14 g/mol) was improved most (8.35 times) compared to no irradiation (2.65 g/mol) [69]. While the Uox of MnO2/PDS system with UVA was 15.27 g/mol, it was only 1.01 times larger than that without UVA (15.17 g/mol) [68].
Figure 1
Figure 1.
Split violin plots for groups with or without irradiation of (a) observed pseudo-first-order rate constant (kobs, min−1), (b) average mineralization rate (rm, mg L−1 min−1), (c) utilization efficiency of catalyst (Ucat), and (d) utilization efficiency of oxidant (PMS and PDS, Uox, g/mol). The red dashed line represents the median. The upper and lower black dashed lines are the upper quartile and the lower quartile, respectively.
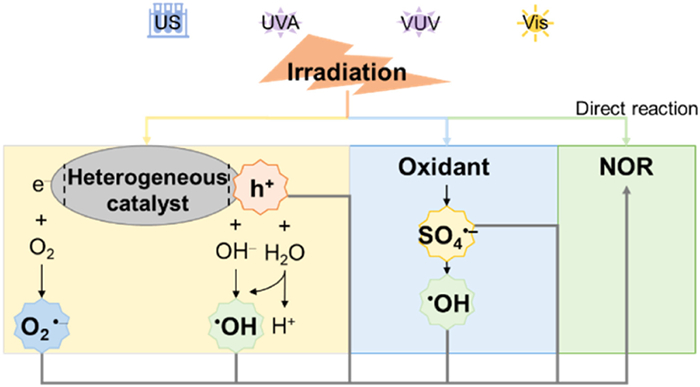
Irradiation can affect target contaminants, catalysts, and oxidants thus leading to an improved degradation performance (Fig. 2). For NOR, it can be directly degraded by some irradiation (US, UVA, VUV, and Vis) alone, the process is limited though. Hu et al. found NOR (2 mg/L) was degraded only 6.4% under ultrasound within 80 min [70]. The direct photolysis of NOR was observed under UVA alone [69]. Wang et al. claimed that the removal of NOR by single VUV irradiation was very limited within 4 min [52,71]. It has also been reported that poor degradation of NOR occurred by visible light irradiation alone [51,57,72].
Figure 2
Figure 2.
The effects of irradiation on NOR degradation.
For catalysts, the effect of irradiation varies depending on whether the catalyst is homogeneous or heterogeneous. In this study, we only focused on the effect of irradiation on heterogeneous catalyst. For heterogeneous catalyst, valence band holes (h+) and conduction band electrons (e−) can produce at the surface of heterogeneous catalyst under irradiation (Eq. 7) [70]. Then, on one hand, h+ can directly degrade NOR. On the other hand, h+ can produce •OH if the VB position of the catalyst is more positive than the reduction potential of OH−/•OH (1.99 eV) [73] or H2O/•OH (2.27 eV) (Eqs. 8 and 9) [57]. The conduction band electrons can react with oxygen to generate O2•− if CB position is higher than the redox potential of O2/O2•− (−0.33 eV) (Eq. 10) [72].
For the heterogeneous catalysts:
(7)
(8)
(9)
(10)
For oxidants, on one hand, they can be directly decomposed by irradiation (Eq. 11). On the other hand, oxidants can also react with e− from heterogeneous catalyst to produce SO4•‒, and SO4•‒ could be converted into •OH (Eqs. 12 and 13) [51].
(11)
(12)
(13)
As a result, NOR can be degraded to lower organic molecules and finally mineralized to CO2 and H2O by generated reactive species, including h+, •OH, SO4•‒, and O2•−.
3.2
Comparison of the heterogeneous catalysts
Increasing numbers of new heterogeneous catalysts were synthesized to activate oxidants for organic pollutant removal. Heterogeneous catalysts can be divided into two main categories considering the elements contained, carbon-based catalysts and metal catalysts. Carbon-based catalysts include graphite, graphene, etc. [74], which are environmentally friendly and cost-effective [75]. In addition, many modification methods [76] were applied to enhance their catalytic performance. For metal catalysts, iron-based and cobalt-based materials were most widely used in the forms of ions, oxides, hydroxides, sulfides, etc. Iron-based materials have various advantages such as huge abundance, low cost, environmental friendliness, and low toxicity [77,78]. Besides, Co was also commonly used for its high reactivity. In the cases we extracted for NOR degradation (n = 39), iron-based and cobalt-based catalysts accounted for nearly 3/5 and 1/3, respectively. Furthermore, many other elements (Cu, Mn, etc.) were introduced into the catalyst. Therefore, the catalysts were classified into 13 sub-groups according to the elements contained, which were named “Fe”, “Co”, “Cu”, etc., and “C” groups.
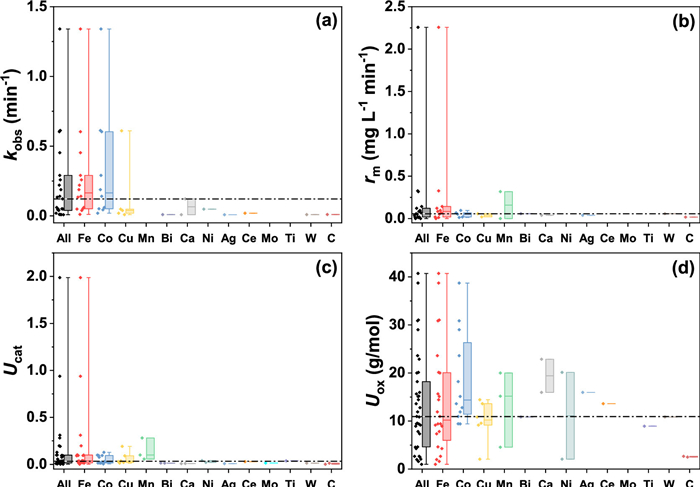
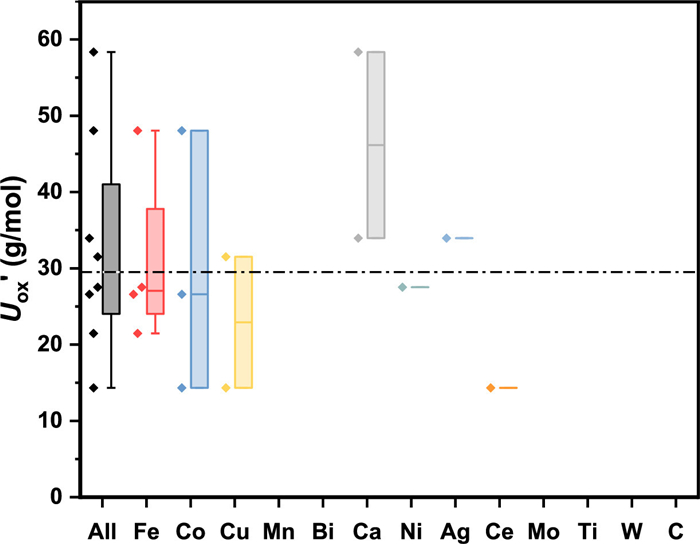
The catalysts were compared in sub-groups according to five key parameters (Figs. 3 and 4). The values of kobs (Fig. 3a) for all the catalysts clustered in a range of 0.039~0.290 min−1 with a median of 0.122 min−1. Apparently, Fe-based and Co-based catalysts both exhibited higher kobs with an equal median of 0.164 min−1, implying that the degradation rate of NOR was faster when both metals were used. For rm (Fig. 3b), most of the cases the values were lower than 0.122 mg L−1 min−1 with a median of 0.057 mg L−1 min−1. Fe-based and Mn-based (though only 2 cases) catalysts showed higher rm with a median of 0.085 and 0.160 mg L−1 min−1, respectively. Similarly, the improvement of Fe-based and Mn-based catalysts (though only 3 cases) were more profound on Ucat (Fig. 3c). Figs. 3b and c suggested that both the average mineralization rate and utilization efficiency of catalyst for Fe-based and Mn-based catalysts were superior to most other catalysts. While for Uox (Fig. 3d) of all the catalysts, the values were mainly distributed in the range of 4.627 g/mol to 18.202 g/mol with a median of 10.944 g/mol. Ca-based (though only 2 cases), Mn-based (though only 3 cases), and Co-based catalysts exhibited higher values with a median of 19.418 g/mol, 15.175 g/mol, and 14.366 g/mol, respectively. In addition, Ca-based catalysts (though only 2 cases) had the best performance for Uox' (Fig. 4) among sub-groups with a median of 46.154 g/mol. Besides, the carbon-based catalysts performed poorly on NOR degradation.
Figure 3
Figure 3.
Data and box plots for all catalysts and sub-groups: (a) observed pseudo-first-order rate constant (kobs, min−1), (b) average mineralization rate (rm, mg L−1 min−1), (c) utilization efficiency of catalyst (Ucat), and (d) utilization efficiency of oxidant (Uox, g/mol). The rhombuses represent sample cases. The horizontal line within the box represents the median. The upper extreme and lower extreme of the box refer to the upper quartile and the lower quartile, respectively. Whiskers show the maximum and minimum values.
Bimetallic catalysts seemed to have attracted more attraction than monometallic catalysts in recent years, due to the potential synergistic effects by the combination of two metals [79]. In bimetallic catalysts, two main metals are structured in the heterostructure, alloy structure, core-shell structure, and spinel structure, resulting in adapted physicochemical properties [80]. And the core-shell structure and spinel structure were more popular than the others.
The core-shell structured bimetallic catalysts were synthesized in many studies and exhibited better performance than monometallic catalysts under the same conditions. Co3O4@Fe2O3 core-shell performed better (kobs of 0.1402 min−1) for the degradation of NOR by coupling with PMS than Co3O4 (0.0691 min−1) or Fe2O3 (0.0162 min−1) individually [81]. The Fe2O3@CoFe2O4/PMS system exhibited a first-order rate constant of 0.1883 ± 0.0214 min−1 for NOR degradation, which was 12.9 and 2.9 times higher than those for Fe2O3/PMS and CoFe2O4/PMS system, respectively [50]. The same trend was found for other antibiotics. The degradation efficiency of ciprofloxacin reached 49.6% within 240 min when using Fe3O4@Bi2O3 core-shell as a catalyst, while only about 17.2% and 35.5% for Fe3O4 and Bi2O3, respectively [82]. It was also reported that the oxytetracycline degradation within 60 min by Cu@Fe3O4 core-shell (99.9%) for H2O2 was higher than of which only nanoparticle of Cu (98%) or Fe3O4 (77.5%) was used [83]. Generally, both two metals contained in the core-shell structure can activate oxidants to generate radicals for target pollutant degradation. The reason why the core-shell structure exhibits improved performance could be ascribed to: (ⅰ) Usually, the core-shell structure gives a higher specific surface area and total pore size than monometallic catalyst particles. This increases interfacial active sites [84], improving the catalytic activity; (ⅱ) the shell can disperse the catalyst particles better, preventing them from aggregation [85]; (ⅲ) the core-shell structure possesses dual characteristics of two metals and facilitates electron transfer [86]. Metal ions with stronger reductive potential can act as electron donors, thereby accelerating the reduction of another metal ion; and ⅳ) core-shell structure can reduce the outflow of metal ions and suppress the contribution from homogenous activation [87] since usually heterogeneous activation is more effective than homogenous activation.
Bimetallic spinel structure usually refers to transition metal spinel, with a formula of AxB3-xO4, where A and B represent transition metal elements [88]. Spinel ferrites with the general formula of MFe2O4 (M is a divalent transition metal such as Co, Cu, Mn) are the most common transition metal spinel due to their magnetic property [89]. Many researchers have studied the activation mechanisms of PMS by spinel ferrites per free radical quenching experiments, together with the examination of ion leaching tests and metal valence change. It was widely accepted that the activation reaction mainly occurred on the surface of spinel ferrites [90]. Metal ions function as Lewis acid and combined with the absorbed H2O molecules to generate metal hydroxyl groups (MOH+ and FeOH2+), which is the crucial step to activate PMS (Eqs. 14 and 15). Meanwhile, the existence of iron enriches the formation of MOH+ (Eq. 16).
(14)
(15)
(16)
With the addition of PMS, these metal hydroxyl groups are combined by HSO5− through hydrogen bonds to form MFe2O4O-H—HSO5−. MOH+ can activate HSO5− to generate MO+ and SO4•‒, and then MO+ can reduce HSO5− to MOH+, realizing the regeneration of MOH+ (Eqs. 17 and 18). When H+ exists, MO+ can further be acidified to M3+, which can react with HSO5− to release SO5•‒ (Eqs. 19 and 20).
(17)
(18)
(19)
(20)
Besides, Fe3+ on MFe2O4 surface can activate HSO5− to SO5•‒ and SO4•‒ (Eqs. 21 and 22). The generated SO4•‒ can further formed •OH (Eq. 23).
(21)
(22)
(23)
It is worth noting that the existence of iron element can enhance the reversibility of M2+/M3+ redox pairs and electron transfer efficiency, if the standard reduction potential of M3+ is higher than Fe3+ (Eqs. 24–26), thereby improving its catalytic performance [91].
(24)
(25)
(26)
3.3
Comparison of the oxidants (PMS vs. PDS)
There are two kinds of oxidants commonly used, which are PMS and PDS. PMS is an asymmetrical oxidant containing HSO5− structure. The common PMS used is Oxone (KHSO5·0.5KHSO4·0.5K2SO4). PDS has a symmetrical structure, and it usually exists in the form of Na2S2O8 or K2S2O8. Both PDS and PMS can be activated per O–O bond breakage to produce reactive species for the AOPs [92]. The properties of PMS and PDS were listed in Table 1.
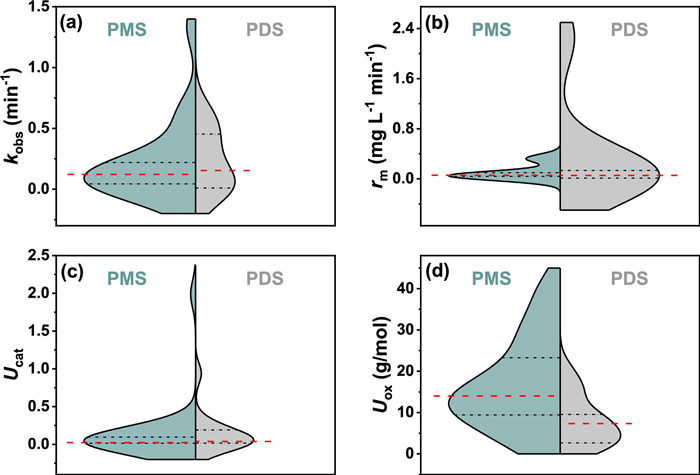
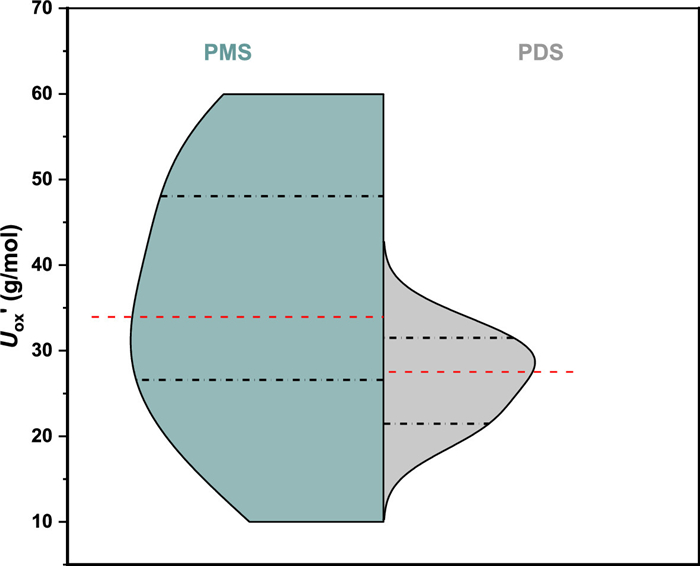
The comparison of four key parameters between PMS and PDS groups were presented in Fig. 5. Both observed pseudo-first-order rate constant (Fig. 5a) and utilization efficiency of catalyst of PDS (Fig. 5c) were slightly higher than PMS group with a similar data distribution. The average mineralization rate (Fig. 5b) was moderately greater when PMS was used. While the utilization efficiency of oxidant value (Fig. 5d) was significantly improved when the oxidant was PMS. The lower quartile of Uox for PMS group was greater than the median for PDS group (Fig. 5d), suggesting that 75% value of Uox for PMS group was higher than 50% for PDS group. That is to say, the utilization efficiency of PMS was higher than PDS significantly for heterogeneous catalysis. Same trend also reported in individual cases. For example, PMS and PDS (both with an initial concentration of 0.2 mmol/L) systems were compared for NOR (initial concentration = 15 µmol/L) degradation with CoFe@N-GC as catalyst. The degradation efficiency of NOR for PDS system (24.75%) was clearly inferior to PMS system (98.41%) within 20 min. So, the utilization efficiency of PMS (23.62 g/mol) activated by CoFe@N-GC was 3.98 times as large as PDS (5.94 g/mol) for NOR degradation per calculation [93]. In addition, we also compared the net utilization efficiency (Uox') of PMS and PDS groups. The median of PMS was higher than the upper quartile of PDS for the parameter of Uox' (Fig. 6), meaning 50% data of Uox' for PMS was higher than 75% of that for PDS. In other words, the net utilization efficiency of PMS was obviously superior to PDS.
Figure 5
Figure 5.
Split violin plots for PMS and PDS groups of (a) observed pseudo-first-order rate constant (kobs, min−1), (b) average mineralization rate (rm, mg L−1 min−1), (c) utilization efficiency of catalyst (Ucat), and (d) utilization efficiency of oxidant (Uox, g/mol).
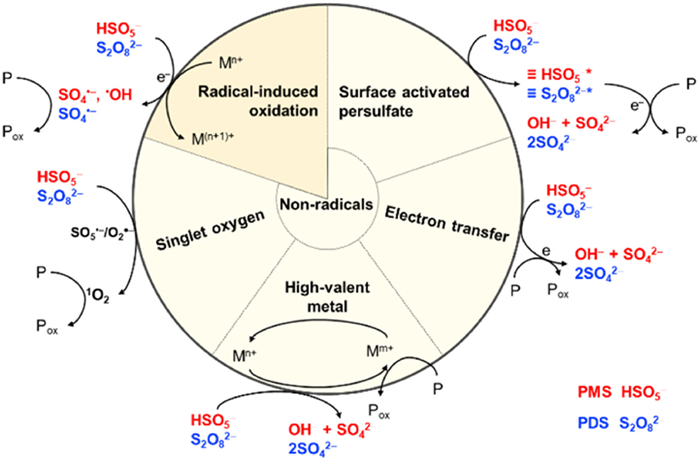
The reason that the overall degradation performance of NOR was different for PMS and PDS can be ascribed to their varied reaction pathways towards NOR. Typically, radical and nonradical induced oxidation can be involved in PMD/PDS reaction with organic pollutants (Fig. 7). In radical-induced oxidation, the radicals formed between PMS and PDS by direct decomposition are different. PMS molecule can generate SO4•‒ and/or •OH [94], while PDS only produce SO4•‒ [95]. SO4•‒ can be transformed into •OH by reacting with water molecules at a slow rate or under alkaline conditions [96]. Then NOR can be attacked by generated SO4•‒ (kSO4•−, NOR = 107 − 1010 L mol−1 s−1) [97] and •OH (k•OH, NOR = (1 − 8.81) × 109 L mol−1 s−1) [98]. While in nonradical oxidation, NOR can be degraded through surface activated persulfate, electron transfer, high-valent metal, and singlet oxygen [20]. Compared with radical oxidation, non-radical induced oxidation is more selective to the electron-rich substance [20,99] and has a relatively mild oxidation capacity [100]. PMS is more active against nucleophilic molecules attacked by electron-rich organic pollutants, compared to PDS [101]. Thus, PMS can induce direct oxidation of some electron-rich organic pollutants by electron transfer, rather than catalysts/activators. Moreover, for activation of PMS and PDS, the same catalysts/activators may exhibit different reaction mechanisms [102]. It was reported that PMS tended to induce a nonradical oxidation pathway, while PDS may promote the dissociation of H2O and facilitate the generation of hydroxyl in the CoFe@N-GC system for NOR degradation [93]. Although the same reaction pathways towards NOR are involved for PMS and PDS, the dominant one varies greatly for two oxidants. For instance, the oxidation pathways induced by electrochemically activated PMS and PDS for sulfamethoxazole involved were the same, but SO4•‒ accounted for 64.93% contribution for PMS system and nonradical oxidation was the dominant pathway (95.79% contribution) in PDS based on calculation [103].
Figure 7
Figure 7.
Possible five pathways for PMS/PDS induced oxidation of organic pollutions. P, Pox, and M stand for organic pollutants, oxidation products, and metals, respectively.
The different pathways for PMS and PDS induced NOR oxidation stem from varied properties of PMS and PDS: (ⅰ) the steric hindrance coming from the proximity of two SO3 groups in PDS leads to its lower reactivity compared to PMS; (ⅱ) the O–O bond in PMS is asymmetrical in charge distribution, but symmetrical for PDS, making the nonpolar PMS more prone to nucleophilic attack [95]; (ⅲ) the pH working range may be different for them (details can be found in Section 3.4) due to the extremely low pKa2 value of PDS (−3.5), while 9.4 for PMS; ⅳ) the dissociation energy of the O–O bond for PDS (92 kJ/mol) is lower than PMS (377 kJ/mol); ⅴ) PMS is less stable due to a longer O–O bond (1.326 Å) than PDS (1.222 Å); and ⅵ) redox potential of PDS (2.01 V) is higher than that of PMS (1.82 V). Therefore, the property differences between PMS and PDS lead to their different degradation performance for NOR.
3.4
Effect of pH
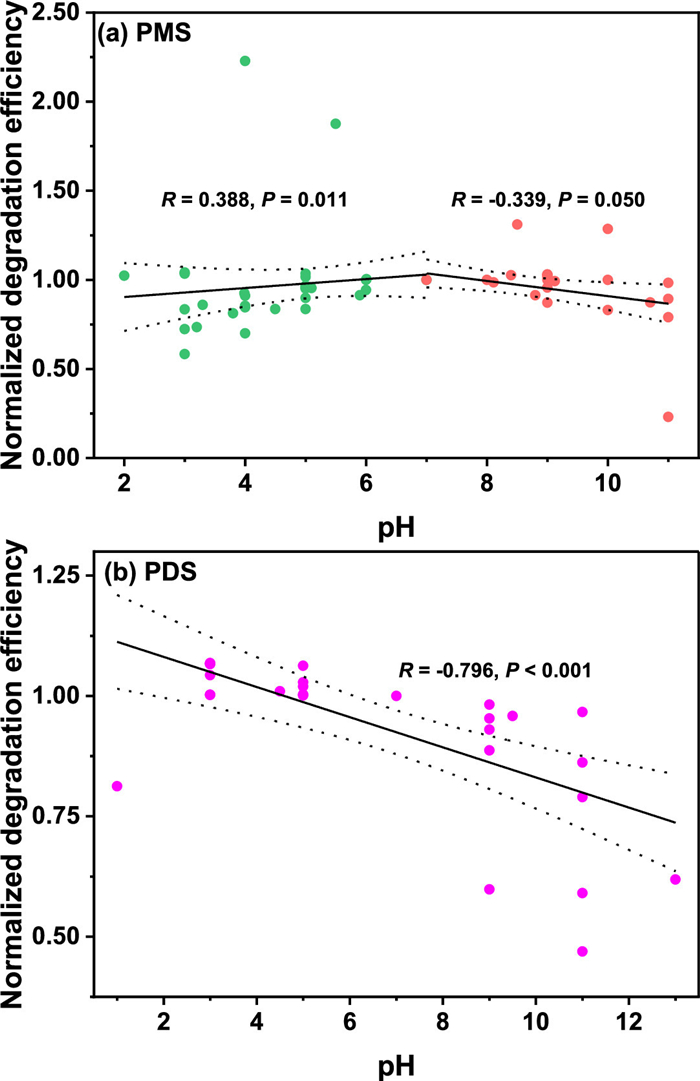
The solution pH is a critical factor controlling target contaminant degradation [104], because it affects the form of target contaminants, the surface charge of catalysts, species distribution of oxidants, and generation of radical species [105]. Here, the effect of pH on normalized degradation efficiency of NOR in PMS and PDS systems was compared (Fig. 8). For PMS system (Fig. 8a), the normalized degradation efficiency of NOR was positively correlated with pH in a range of 2–7 (Spearman's R = 0.388, P = 0.011), but negatively correlated with pH in the range of 7–11 (Spearman's R = −0.339, P = 0.050). This demonstrated that neutral solution was most beneficial to NOR degradation when PMS was used as the oxidant. While for PDS system (Fig. 8b), the normalized degradation efficiency of NOR showed a significantly negative correlation with pH (Spearman's R = −0.796, P < 0.001), implying that the highest NOR degradation efficiency was obtained at an acidic solution.
Figure 8
Figure 8.
Scatter plot of Spearman correlation analysis between normalized degradation efficiency of NOR and pH for (a) PMS and (b) PDS system. The solid line represents the linear fitting results and the dotted lines represent 95% confidence intervals.
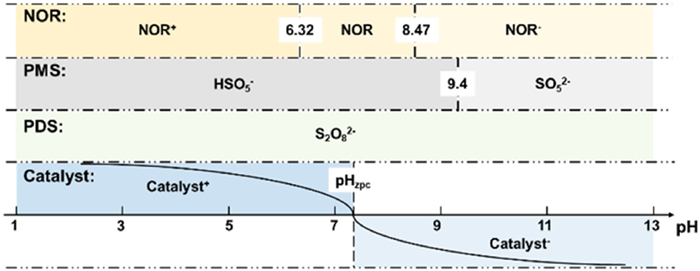
The theoretical species distribution or surface charge of NOR, catalyst, PMS, and PDS at pH 1–13 were presented in Fig. 9. Generally, NOR is an amphoteric compound with two pKa values (pKa1 = 6.32 and pKa2 = 8.47) due to the existence of a carboxyl group and a piperazinyl ring in its structure. At pH < 6.32, NOR exists in a cationic form in the solution. In the pH range of 6.32–8.47, NOR mainly exists as a zwitterionic form. While at pH > 8.47, NOR transforms to an anionic form [106]. Moreover, the surface charge of catalyst is also highly dependent on pH. It is positive at pH < pHzpc and negative at pH > pHzpc [107]. For PMS, its existing form is significantly influenced by the solution pH [5]. The main species of PMS is HSO5‒ at pH 1–9.4 and SO52‒ at pH > 9.4 according to its two pKa values [94,108]. The existence of SO52‒ can greatly suppress the generation of SO4•‒. For PDS, its pKa2 is −3.5, thus it appears in the form of S2O82‒ in the solution at different pH. In addition, pH also affects the generation, transformation, and oxidation capacity of radical species. Hydrogen ion acts as the scavenger of SO4•‒ and •OH at an acidic solution (Eqs. 27 and 28) [109]. While in basic solution, SO4•‒ can consume OH‒ and transform into •OH per Eq. 29, which is also the main mechanism of base activation for persulfate [15]. Meanwhile, the oxidation capacity of predominant reactive radical drops from 2.5 to 3.1 V (for SO4•‒) to 1.8 V (for •OH) [110].
(27)
(28)
(29)
Figure 9
Figure 9.
Species distribution or surface charge of NOR, PMS, PDS, and catalyst at pH 1–13.
For PMS system, it is seemingly that neutral pH range is optimal for NOR degradation. The reasons could be that under acidic condition, hydrogen ions can act as the scavengers of SO4•‒ and •OH and the protonation of piperazine ring on NOR decreases its reactivity towards radicals [111] resulting in poor NOR degradation. The reason why alkaline condition reduces the degradation efficiency of NOR is that PMS ion mainly exists in the specie of SO52‒, which inhibits the generation of SO4•‒. Furthermore, in basic solution, the surface charge of NOR, catalysts, and PMS (SO52‒) could all be negative, leading to great electrostatic repulsion to suppress the reactions. In addition, dominated •OH possesses a weaker oxidation capacity than SO4•‒ at alkaline condition [91]. Thereby, both low and high pH restrain the NOR degradation in PMS system, leaving the neutral condition as the optimal.
For PDS system, the increase of hydroxide ions greatly inhibits the NOR degradation. The acidic solution is beneficial for NOR degradation because that PDS is favored to produce SO4•‒ at acidic condition (Eqs. 30 and 31) [112].
(30)
(31)
While at alkaline condition, NOR, catalyst, and PDS ion are all negatively charged. The existence of electrostatic repulsion inhibits the interactions between any two of them, thus reducing the degradation efficiency of NOR [113]. Besides, at alkaline condition, •OH is the dominating radical possessing a weaker oxidation capacity than SO4•‒. Thus, acidic solution is beneficial for NOR degradation in PDS system.
3.5
Degradation mechanism and pathways of NOR
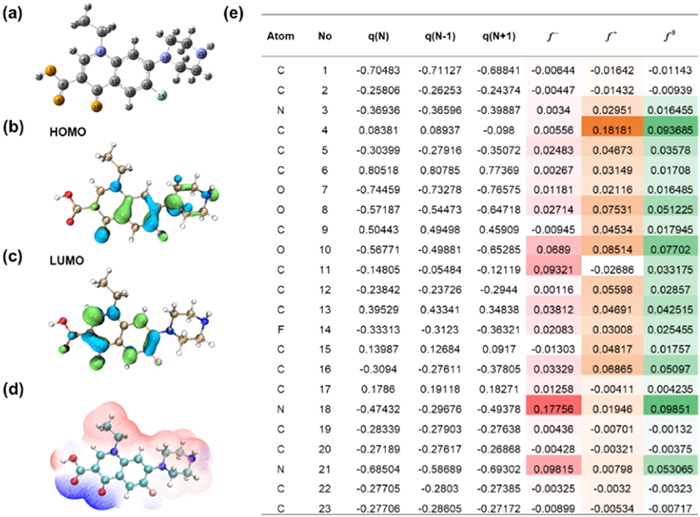
As a typical quinolone antibiotic, the main structure of NOR includes a quinolone group and a piperazine ring (Fig. 10a). Thus, the attack to NOR by reactive species has regioselectivity due to its complicated molecular structure. •OH, SO4•‒ and 1O2 are the major reactive species in PMS/PDS-related AOPs [5,114,115], of which •OH and SO4•‒ are strong electrophilic species, while 1O2 is a weak electrophilic species. Computational chemistry provides a new method to deeply investigate the reaction mechanism between reactive species and organic pollutant. Fukui index, which is based on density functional theory (DFT) calculation, is widely used to predict the regioselectivity for different reactive species [116–119]. We performed DFT calculation on Gaussian 16C.01 program package for NOR based on our previous studies. The Fukui indexes representing electrophilic attack (f–), radical attack (f0) and nucleophilic attack (f+) were all considered and calculated. Firstly, B3LYP theoretical method is applied to optimize NOR geometry under standard 6–31 + G (d, p) basis set, and then single-point energy calculation was performed. In addition, based on the frontier orbital theory, the highest occupied molecular orbital (HOMO) and lowest unoccupied molecular orbital (LUMO) are generally used to describe the oxidation and reduction ability of NOR, respectively. Specifically, the HOMO (Fig. 10b) and LUMO (Fig. 10c) of NOR were showed. The HOMO of NOR represented that the regions of NOR molecule that can easily lose electrons for oxidation were located primarily on the piperazine ring and benzene ring bound with F atom. Moreover, the electrostatic potential (ESP) mapping showed that the electron-rich sites contained piperazine ring and N, O-containing heterocyclic ring (Fig. 10d), which preferred to react with electrophiles such as •OH and SO4•‒. However, both HOMO and ESP distribution spectra cannot quantitively describe the reactivity of NOR at each site, thus Fukui index was then introduced to precisely describe the reactive sites (Fig. 10e). f– and f0 were considered in this system due to the electrophilicity property of •OH, SO4•‒ and 1O2. It is apparent that N18 and N21 in the piperazine ring were the most active sites, with high f– values of 0.1776 and 0.0982 (f0 values of 0.0985 and 0.0531), respectively. Besides, C4 was another active site (f0 = 0.0937) for radical attack. Although the Fukui index values of C11 (f– = 0.0932, f0 = 0.0332), O8 (f– = 0.0271, f0 = 0.0512) and O10 (f– = 0.0689, f0 = 0.0770) were also high, it was hardly to be attacked by these radicals owing to the steric hindrance effect and n→π* interaction [120].
Figure 10
Figure 10.
NPA charge and distribution of Fukui index for NOR: (a) Chemical structure of NOR, (b) HOMO and (c) LUMO distributions of NOR, (d) ESP mapping of NOR, (e) NPA charge and Fukui index of NOR atoms.
It is worth noting that different reactive species have different characteristics and reaction mechanisms on NOR degradation, resulting in varied degradation products. In comparison to •OH [118], SO4•‒ has a higher oxidation potential and electrophilicity index [118], so SO4•‒ is easily to attack NOR. However, SO4•‒ has higher steric hindrance for its reaction due to the larger Van der Waals radius [118]. Both SO4•‒ and •OH can react with NOR through radical adduct formation (RAF) route, while the reactions exhibit different Gibbs free energy changes (ΔG) and activation energy barriers (ΔG‡) at each reactive site. Generally, SO4•‒ tends to attack the electron-rich sites via electron transfer owing to a higher electron affinity than •OH [118], while only •OH react with NOR by hydrogen atom abstraction (HAA) route. Therefore, the degradation mechanism for the target molecule is different when the process is dominated by SO4•‒ or •OH. For instance, when SO4•‒ attacks NOR, the NOR•+ can be formed first via an electron transfer reaction. Then NOR•+ reacts quickly with H2O by hydroxyl abstraction or addition reaction to produce (OH)NOR. However, when •OH attacks NOR, (OH)NOR is preferentially produced via hydroxyl abstraction or addition reaction [121]. In addition, SO4•‒ and •OH may attack different sites on target molecules. Piperazine ring contained two N atoms where the lone pair electrons could be attacked by SO4•‒via electron transfer mechanism [122]. While hydroxylation reaction induced by •OH occurs predominantly on the quinolone group instead of the piperazine ring. It was proposed that quinolone group transformation and piperazine ring transformation of NOR were the main pathways in the Co/g-C3N4/H2O2 (•OH as the main radical) and Co/g-C3N4/PMS (SO4•‒ as the main radical) process, respectively [123]. The formation of the carbonyl group is considered to be one of the features of •OH reaction. For instance, five amide intermediates were observed in the piperazine ring transformation pathway of the simulated solar light-mediated Bi2WO6 system, but not in the simulated solar light system. This difference was apparently ascribed that •OH was the main active species in the simulated solar light-mediated Bi2WO6 process and the lack of •OH in the simulated solar light process [124].
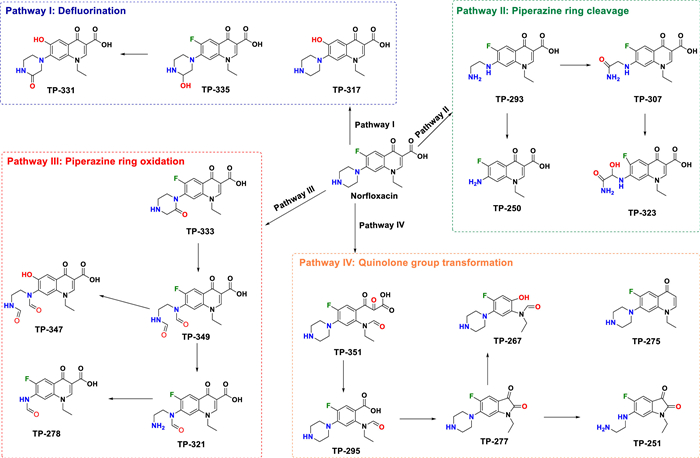
Based on DFT calculation results and previously liquid chromatogram-mass (LC-MS) detection for transformation products (TPs) [125–127], we summarized the degradation pathways of NOR in SO4•‒-based AOP systems, which generally included four pathways [49,126,128]: (Ⅰ) defluorination, (Ⅱ) piperazine ring cleavage, (Ⅲ) piperazine ring oxidation, and (Ⅳ) quinoline group transformation (Fig. 11). Pathway Ⅰ was fluorine substitution by –OH, leading to formation of TP-317. Besides, NOR could be transformed into TP-335 by radical addition, which further degraded into defluorinated TP-331. This pathway was also the key process for F− yield and detoxification [129]. Pathway Ⅱ and pathway Ⅲ were related to oxidation and cleavage of piperazine ring since the N sites of piperazine has a high activity and f0 values. For pathway Ⅱ, TP-293 was formed by radical attack on N18 and N21 sites. Subsequently, TP-293 was oxidized to TP-307 by addition of O atom. Meanwhile, TP-250 was generated by the further oxidation of TP-293. Pathway Ⅲ is performed by the piperazine ring oxidation. NOR was first oxidized to TP-333, and further oxidation of TP-333 along with ring-opening reaction led to generation of TP-349. Finally, TP-347, TP-321 and TP-278 formed with the deep oxidation by radicals. For pathway Ⅳ, the quinolone group of NOR was destroyed to form TP-351. Later, TP-351 was further transformed into TP-295 and TP-277 by decarboxylation and decarbonylation, respectively. Then TP-251 and TP-267 formed by the cleavage of piperazine ring and five-membered ring of TP-277. NOR also could be converted into TP-275 by decarboxylation. Finally, deep oxidation led to mineralization of NOR for formation of CO2, H2O, F−, NO3−, NH4+ and so on [49,130,131].
Figure 11
Figure 11.
The summarized typical degradation pathways of NOR in SO4•‒-based AOP systems.
An increasing number of studies have been conducted to degrade NOR by activating PMS or PDS with various activation methods in recent years, but few reviews focused on the differences among various activation methods and two oxidants on the comprehensive degradation performance of NOR. In this work, we extracted the published data to fill in this gap. The main conclusions were as follows:
(ⅰ) Five key parameters were proposed to comprehensively quantify the degradation performance of NOR, including the observed pseudo-first-order rate constant (kobs), average mineralization rate (rm), the utilization efficiency of catalyst (Ucat), the utilization efficiency of oxidant (Uox), and the net utilization efficiency of oxidant (Uox').
(ⅱ) The overall degradation performance of NOR was improved by the input of irradiation based on first four parameters, which was because irradiation can affect target contaminants, catalysts, and oxidants.
(ⅲ) Fe, Co, and Mn-based catalysts had a better performance on NOR degradation, while carbon-based catalysts performed poorly among variously heterogeneous catalysts. In addition, we also elaborated the benefits of bimetallic catalysts with core-shell structure and spinel structure.
(ⅳ) The difference of overall NOR degradation performance for PMS and PDS can be ascribed to their varied reaction pathways towards NOR, but stemmed from their different properties.
(ⅴ) The effect of pH on degradation efficiency of NOR was different for PMS and PDS system. The neutral condition was beneficial to degradation efficiency of NOR in PMS system, but the NOR degradation efficiency was optimal under acidic condition for PDS system.
(ⅵ) The piperazine ring, benzene binding with F atom, and N, O-containing heterocyclic ring of NOR were easy to be attacked according to DFT calculation. Moreover, four typical degradation pathways for NOR were summarized in SO4•‒-based AOP systems, including defluorination, piperazine ring cleavage, piperazine ring oxidation, and quinoline group transformation.
Although the persulfate-based advanced oxidation processes are powerful in the degradation of organic pollutants, barriers still exist between lab experiments and practical application. More works need to be done in the following aspects:
(ⅰ) The efficiency of AOPs for degradation of a series of organic pollutants need to be investigated. Most of the study focused on one specific problem pollutant, while two or more pollutants could co-exist in waters. The understanding on their interactions during degradation is limited.
(ⅱ) Real wastewater treatment needs to be included even in lab scale experiments. It was found that most studies were carried out in synthetic wastewater, and mostly only considering the effect of single factor. It is reasonable for fundamental study. However, there are many substances coexisting in the real wastewater, and the theoretical conclusions may not applicable. Therefore, use of real wastewater is highly recommended.
(ⅲ) The use of density functional theory (DFT) could be more involved for interpreting the complicated practical scenarios. Computational chemistry provides new solutions to deeply investigate the reaction mechanisms between reactive species and organic pollutants. We should make full use of DFT to provide theoretical supports for application of AOPs.
Declaration of competing interest
The authors declare that they have no known competing financial interests or personal relationships that could have appeared to influence the work reported in this paper.
Acknowledgments
This work was supported by National Natural Science Foundation of China (Nos. U21A20162 and 52279051), the National Key Research and Development Program of China (No. 2021YFA1202500), the Key Special Projects for Science and Technology of Inner Mongolia (No. 2021EEDSCXSFQZD001), and the 2115 Talent Development Program of China Agricultural University (No. 00109018).
Supplementary materials
Supplementary material associated with this article can be found, in the online version, at doi:10.1016/j.cclet.2023.108722.
[1]
J. Li, Y.J. Li, Z.K. Xiong, G. Yao, B. Lai, Chin. Chem. Lett. 30 (2019) 2139–2146. doi: 10.1016/j.cclet.2019.04.057
[2]
C. Wang, J. Kim, V. Malgras, et al., Small 15 (2019) e1900744. doi: 10.1002/smll.201900744
M.K. Nazal, An overview of carbon-based materials for the removal of phamaceutical active compounds, in: M. Bartoli, M. Frediani, L. Rosi (Eds.), Carbon-Based Material for Environmental Protection and Remediation, 2020, doi: 10.5772/intechopen.91934.
Figure 1
Split violin plots for groups with or without irradiation of (a) observed pseudo-first-order rate constant (kobs, min−1), (b) average mineralization rate (rm, mg L−1 min−1), (c) utilization efficiency of catalyst (Ucat), and (d) utilization efficiency of oxidant (PMS and PDS, Uox, g/mol). The red dashed line represents the median. The upper and lower black dashed lines are the upper quartile and the lower quartile, respectively.
Figure 3
Data and box plots for all catalysts and sub-groups: (a) observed pseudo-first-order rate constant (kobs, min−1), (b) average mineralization rate (rm, mg L−1 min−1), (c) utilization efficiency of catalyst (Ucat), and (d) utilization efficiency of oxidant (Uox, g/mol). The rhombuses represent sample cases. The horizontal line within the box represents the median. The upper extreme and lower extreme of the box refer to the upper quartile and the lower quartile, respectively. Whiskers show the maximum and minimum values.
Figure 5
Split violin plots for PMS and PDS groups of (a) observed pseudo-first-order rate constant (kobs, min−1), (b) average mineralization rate (rm, mg L−1 min−1), (c) utilization efficiency of catalyst (Ucat), and (d) utilization efficiency of oxidant (Uox, g/mol).
Figure 7
Possible five pathways for PMS/PDS induced oxidation of organic pollutions. P, Pox, and M stand for organic pollutants, oxidation products, and metals, respectively.
Figure 8
Scatter plot of Spearman correlation analysis between normalized degradation efficiency of NOR and pH for (a) PMS and (b) PDS system. The solid line represents the linear fitting results and the dotted lines represent 95% confidence intervals.
Figure 10
NPA charge and distribution of Fukui index for NOR: (a) Chemical structure of NOR, (b) HOMO and (c) LUMO distributions of NOR, (d) ESP mapping of NOR, (e) NPA charge and Fukui index of NOR atoms.

 DownLoad:


 下载:
下载:


