Citation:
Yang Fu, Wang Chao, Wang Lu, Ye Zhi-Wei, Song Xin-Bo, Xiao Yi. Hoechst-naphthalimide dyad with dual emissions as specific and ratiometric sensor for nucleus DNA damage[J]. Chinese Chemical Letters,
2017, 28(10): 2019-2022.
doi:
10.1016/j.cclet.2017.07.030
Hoechst-naphthalimide dyad with dual emissions as specific and ratiometric sensor for nucleus DNA damage
Received Date:
10 April 2017 Accepted Date:
30 July 2017 Revised Date:
17 May 2017 Available Online:
22 October 2017
Abstract:
A ratiometric fluorescent sensor (Hoe-NI) was developed by connecting a nucleus targeted Hoechst unit to a naphthalimide dye via "click chemistry". The sensor achieves high specific nucleus labeling with wash-free staining method in various kinds of living cells. The fluorescence ratio of the two emission bands (450 nm for Hoechst and 505 nm for naphthalimide) is changed sensitively to the variation of DNA concentrations, which provides the quantitative information in the processes of DNA damage induced by hydroxyl radicals and antitumor drug. Therefore, Hoe-NI is a recommendable sensor for the monitoring of nuclear DNA damage that reveals the health status of cells.
The topic on structural damage of nucleus DNA is always attractive for the researchers in the field of cancers. On the one hand, DNA damage induced by some endogenous or exogenous chemical species may cause gene mutation and even cancer generation [1]. On the other hand, for many anticancer drugs, e.g., cis-platinum and etoposide, their pharmacological mechanisms are closely related to DNA damage that results in apoptosis [2, 3]. These drugs may directly attack DNA, or indirectly block the repairing of damaged DNA.
Fluorescence microscopy imaging has been well-recognized as a powerful bioanalytical technique taking advantages of noninvasiveness, real-time detection, high sensitivity and simplicity. However, it remains a challenging task to monitor DNA damage in living cells. The first issue to be addressed is how to guarantee the nucleus targeting ability of a sensor. Although quite a few fluorescent sensors have been reported to show high affinity to DNA in buffer solutions or in fixed cells [4-9], only a very limited number of them can stain the nucleus specifically in living cells [10-18]. The other issue is how to get quantitative information of DNA, since DNA damage means the decrease in the content (concentration) of DNA. Most of these reported sensors respond to DNA by the intensity enhancement of a single emission band. They are good tools for tracking morphological changes of nucleus, but intensity of a single emission can hardly reflect the local concentration of DNA in a complicated and non-uniform microenvironment of nucleus. Ratiometric sensors should be more desirable, from the viewpoint of quantitation accuracy [19, 20]. Recently, there have been two reports on DNA sensors with dual emissions [8, 16]. However, in these only two cases, ratiometric DNA detections were performed just in buffer solutions. To this date, ratiometric imaging of nucleus in living cells has not been achieved, not to mention the evaluation of nucleus DNA damage.
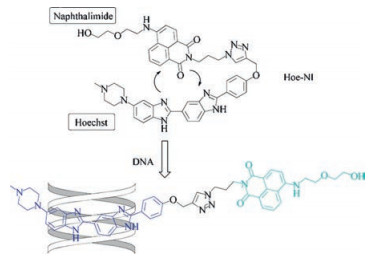
Herein, we report a nucleus-specific dual-emission sensor HoeNI for ratiometric imaging of DNA damage processes. Hoe-NI is composed of a DNA target Hoechst unit and a naphthalimide dye (Fig. 1). Hoe-NI is synthesized by "click chemistry" that connects the Hoechst unit to the naphthalimide dye, as shown in Fig. S1 (Supporting information). The design strategy is based on the following considerations. Firstly, Hoechst unit, i.e., 5-(4-methyl-1-piperazinyl)-2, 5-bi(1H-benzimidazole), is used as the "tag" to nucleus, for its strongly binding to minor groves of double strand DNA [5, 7]. Hoechst tagging is an outstanding strategy to deliver functional molecules into nucleus of living cells [21-25]. Secondly, Hoe-NI may emits dual emissions characteristic for naphthalimide [26, 27] and Hoechst upon excitation at the same wavelength. Thirdly, in aqueous solution or biological systems e.g., cytoplasm, the Hoechst and naphthalimide unit within free Hoe-NI tend to get together closely due to their hydrophobicity and the intramolecular π-π stacking effect, etc., which result in the quenching of their fluorescence by each other. However, once Hoe-NI is bound to DNA, the Hoechst unit and naphthalimide unit will be separated from each other, which may induce the fluorescence enhancement and the change of intensity ratio (Fig. 1).
图 1
图 1
Structure of Hoe-NI and principles of fluorescent labeling of DNA.
Figure 1.
Structure of Hoe-NI and principles of fluorescent labeling of DNA.
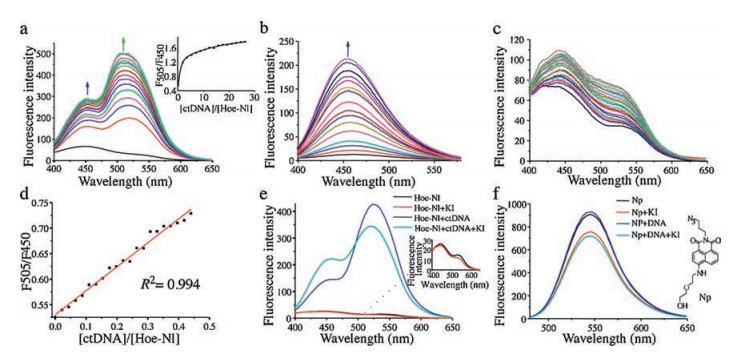
DNA titration experiment on Hoe-NI was performed by using calf thymus DNA (ctDNA) [5]. The fluorescent intensities of Hoe-NI (both Hoechst and naphthalimide) in aqueous buffer were very weak (Fig. 2a). Following the gradual addition of ctDNA, the two emission bands (peak at 450 nm and 505 nm) increased remarkably. On the other hand, the sensor without a naphthalimide unit, i.e., Hoe-yl, just shows one single emission enhancement at 455 nm upon the addition of ctDNA (Fig. 2b). The results indicate that the DNA-binding process of Hoe-NI may separate the Hoechst unit and naphthalimide unit, which suppress the fluorescence quenching effect that will increase the intensity of the two fluorescence emissions. The wavelength difference (55 nm) between two emissions peaks is favorable for dual imaging of DNA in nucleus with less cross-talk observed. In addition, the fluorescence enhancement of naphthalimide is more pronounced than that of Hoechst, which can be possibly ascribed to fluorescence resonance energy transfer (FRET) from Hoechst to naphthalimide. The fluorescence intensity ratio value between the two wavelengths (F505/F450) varied from 0.52 to 1.76 with the concentrations of ctDNA changing from 0 to 25 μmol/L, which allows a ratiometric fluorescence response for the detection of DNA.
图 2
图 2
The fluorescence properties of Hoe-NI with ctDNA in Tris-HCl buffer. (a) Fluorescence spectra of Hoe-NI (1 μmol/L) upon the addition of ctDNA (0–25 μmol/L). Inset: Curve-fitting analysis of the intensities ratios at 450 nm and 505 nm. (b) Fluorescence spectra of Hoe-yl (1 μmol/L) upon addition of ctDNA (0–25 μmol/L). (c) Fluorescence spectra of Hoe-NI (1 μmol/L) upon addition of ctDNA (0-0.5 μmol/L). (d) The linear response of ratio intensities at low concentration of ctDNA from 0 to 0.5 μmol/L. The fluorescent spectra with KI quenching for Hoe-NI-ctDNA systems (e) and Np-ctDNA systems (f). λex = 345 nm.
Figure 2.
The fluorescence properties of Hoe-NI with ctDNA in Tris-HCl buffer. (a) Fluorescence spectra of Hoe-NI (1 μmol/L) upon the addition of ctDNA (0–25 μmol/L). Inset: Curve-fitting analysis of the intensities ratios at 450 nm and 505 nm. (b) Fluorescence spectra of Hoe-yl (1 μmol/L) upon addition of ctDNA (0–25 μmol/L). (c) Fluorescence spectra of Hoe-NI (1 μmol/L) upon addition of ctDNA (0-0.5 μmol/L). (d) The linear response of ratio intensities at low concentration of ctDNA from 0 to 0.5 μmol/L. The fluorescent spectra with KI quenching for Hoe-NI-ctDNA systems (e) and Np-ctDNA systems (f). λex = 345 nm.
Further, we proceeded to investigate the linear correlation between the fluorescence intensity ratio and concentration of ctDNA by performing the titration experiment in a low concentration of ctDNA (Fig. 2c). Upon addition of ctDNA from 0 to 0.5 μmol/L, an excellent linear correlation (R2 = 0.994) between the fluorescence intensity ratio (F505/F450) and concentration of ctDNA was observed (Fig. 2d). The fluorescence intensities of both the Hoechst and naphthalimide unit show distinct enhancement at low concentration range, which result in the linear response between the intensity ratio and concentration of ctDNA. The limit of detection was determined to be 72 nmol/L, exhibiting high sensitivity for DNA. In addition, Fluorescence quantum yield of ctDNA saturated Hoe-NI showed about four-fold rise than that of Hoe-NI (Table S1 in Supporting information), exhibiting high potential in fluorescent sensing experiments.
In addition, the interaction mechanism between Hoe-NI and ctDNA was further studied through the quenching experiments with an effective fluorescence quencher iodide [28]. The results indicated that the fluorescence of Hoe-NI without DNA was obviously quenched by KI (Fig. 2e). However, the fluorescence of Hoechst unit with ctDNA was clearly enhanced, which means that the binding between Hoechst unit and ctDNA prevented the fluorescent quenching. The interactions between different dyes and ctDNA are mainly noncovalent bond including outside binding, intercalation binding and groove binding [29]. The enhancement of absorbance and the weak red-shift of absorption peak of Hoe-NI after binding with DNA are similar to that of classical Hoechst dye (Fig. S2 in Supporting information). All the results suggested that the main interaction mode between Hoe-NI and DNA must be binding with A-T base-pairs and groove binding, which is similar to that of Hoechst dyes [5, 7]. The fluorescence of the naphthalimide unit of Hoe-NI binding with DNA was quenched by KI, which indicated that the interaction between naphthalimide unit and DNA was mainly outside binding by electrostatic interaction or without interaction. In order to clarify the relationship between naphthalimide unit of Hoe-NI and DNA, we investigated the interaction of a naphthalimide compound (Np, identical to the naphthalimide unit in Hoe-NI) between DNA (Fig. 2f). The fluorescence intensity of Np with DNA was a little high than that of Np alone, which indicated that may be exist a weak interaction between naphthalimide and DNA. The fluorescence of both Np and Np with DNA were obviously quenched by KI. So we could draw the conclusion that there an outside binding by electrostatic interaction was existed between naphthalimide unit and DNA. So we can get the conclusion that the main interaction mechanism of Hoe-NI to DNA is the groove binding of the Hoechst unit to DNA, and the naphthalimide unit will promote the binding between Hoe-NI and DNA.
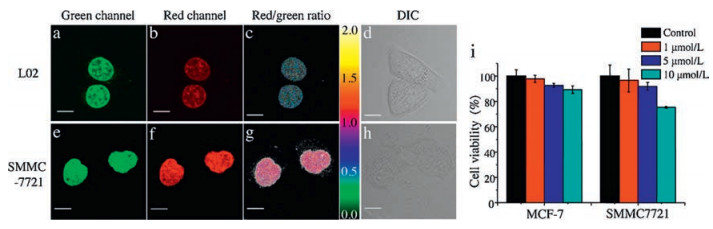
Next, the nucleus-labeling ability of Hoe-NI was evaluated in various living cells. Two closely relevant types of cells (normal hepatocytes L02 cells and hepatoma carcinoma SMMC-7721 cells) were stained under same conditions for comparison. The fluorescence signals were specifically in the nucleus with nearly no background, which indicates that Hoe-NI could permeate into nucleus of living cells. (Fig. 3a–h and Fig. S3 in Supporting information). Upon excitation at 405 nm, strong fluorescence in both Hoechst (450 ± 20 nm) channel and naphthalimide (520 ± 20 nm) channel were observed. The ratio images were gathered by comparing the fluorescence of naphthalimide channel (red) to that of Hoechst channel (green). The ratio (red/green) of SMMC-7721 cells was 1.116 ± 0.068, which was about 2 folds of that of L02 cells (0.535 ± 0.030) (Figs. 3c and g). Quantitative line scan analysis of the fluorescence image also shows the highly selective staining of the nucleus over the cytoplasm (Fig. S4 in Supporting information). Further, the nucleus staining experiments were performed on various kinds of cells including COS-7, MCF-7 and Hela cells. For all kinds of cells, specifically staining of nucleus was observed (Fig. S5 in Supporting information). All the results confirmed the universality of Hoe-NI for the application in nucleus labeling. In addition, Hoe-NI exhibited a relatively low cytotoxicity in MTT assay (Fig. 3i). This was a favorable characteristic of a practical nucleus sensor for dynamic imaging and long-time monitoring in living cells.
图 3
图 3
Confocal fluorescence imaging of cells stained with Hoe-NI and cell viability. (a-d) L02 cells. (e-h) SMMC-7721 cells. Cells were stained with Hoe-NI (10 μmol/L) for 30 min. λex = 405 nm, green channel: 450 ± 20 nm, red channel: 520 ± 20 nm. Differential interference contrast (DIC). Scale bar = 10 μm. (ⅰ) Cell viability of different concentrations of Hoe-NI (1 μmol/L, 5 μmol/L and 10 μmol/L) at 24 h.
Figure 3.
Confocal fluorescence imaging of cells stained with Hoe-NI and cell viability. (a-d) L02 cells. (e-h) SMMC-7721 cells. Cells were stained with Hoe-NI (10 μmol/L) for 30 min. λex = 405 nm, green channel: 450 ± 20 nm, red channel: 520 ± 20 nm. Differential interference contrast (DIC). Scale bar = 10 μm. (ⅰ) Cell viability of different concentrations of Hoe-NI (1 μmol/L, 5 μmol/L and 10 μmol/L) at 24 h.
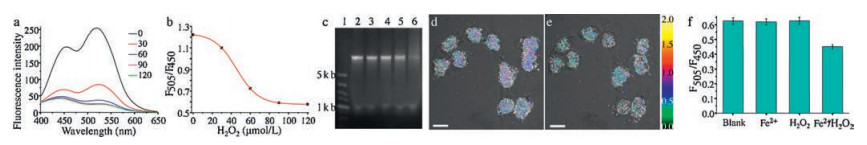
We are interested in utilize the feature of Hoe-NI to quantify the DNA damage under various pathological, toxicological or pharmacological conditions. DNA oxidative damage is considered to be an important reason for carcinogenesis [30, 31]. When DNA is damaged, wrong messages will be sent which might induce the disorder of cell metabolism. Hydroxyl radicals (·OH), one of the highly reactive oxygen species (ROS), can react with various biomolecules [32]. The effect of hydroxyl radicals to DNA damage was well studied [33, 34]. Fe2+ (FeSO4) was used to generate ·OH in the presence of H2O2via a Fenton-type reaction [33]. When Fe2+ or H2O2 was individually added into DNA solution, the fluorescence intensity and ratio (F505/F450) remained unchanged. In contrast, when both Fe2+ and H2O2 were added, total fluorescence intensity of two emission bands and their ratio (F505/F450) decreased rapidly (Figs. 4a, 4b). This process could be completed within one minute. Since Fe2+ was a catalyst [35], the concentration was kept at 30 μmol/L. The dosage of H2O2 was increased from 0 μmol/L to 120 μmol/L, which means the concentration of generated ·OH was increased. It was found that ratio (F505/F450) exhibited a huge decrease from 1.22 to 0.58, which confirms that Hoe-NI is able to evaluate DNA damage induced by ·OH in buffer solution.
图 4
图 4
The effect of ·OH on fluorescence ratio changes of Hoe-NI with ctDNA and cells labeling. (a) Fluorescence spectra of Hoe-NI (1 μmol/L) with ctDNA (2.5 μmol/L) upon addition of Fe2+ (30 μmol/L) and different concentration of H2O2 (0, 30, 60, 90 and 120 μmol/L). (b) Ratio (F505/F450) changes of Hoe-NI (1 μmol/L) with ctDNA (2.5 μmol/L) upon addition of Fe2+ (30 μmol/L) and different concentration of H2O2. λex = 345 nm. (c) Agarose gel electrophoresis: Band 1: DNA marker; 2: ctDNA (125 μmol/L); 3-6: ctDNA (125 μmol/L), Fe2+ (25 μmol/L) and different concentration H2O2 (0, 25, 50 and 75 μmol/L). Fluorescent ratio image of COS-7 cells stained with Hoe-NI before (d) and after (e) added Fe2+ (10 μmol/L) and H2O2 (10 μmol/L) for 2 h. The ratio imaging was obtained by comparing red channel (520 ± 20 nm) to green channel (450 ± 20 nm). λex = 405 nm. Scale bar = 10 μm. (f) The fluorescence ratios of Hoe-NI in COS-7 cells with different conditions.
Figure 4.
The effect of ·OH on fluorescence ratio changes of Hoe-NI with ctDNA and cells labeling. (a) Fluorescence spectra of Hoe-NI (1 μmol/L) with ctDNA (2.5 μmol/L) upon addition of Fe2+ (30 μmol/L) and different concentration of H2O2 (0, 30, 60, 90 and 120 μmol/L). (b) Ratio (F505/F450) changes of Hoe-NI (1 μmol/L) with ctDNA (2.5 μmol/L) upon addition of Fe2+ (30 μmol/L) and different concentration of H2O2. λex = 345 nm. (c) Agarose gel electrophoresis: Band 1: DNA marker; 2: ctDNA (125 μmol/L); 3-6: ctDNA (125 μmol/L), Fe2+ (25 μmol/L) and different concentration H2O2 (0, 25, 50 and 75 μmol/L). Fluorescent ratio image of COS-7 cells stained with Hoe-NI before (d) and after (e) added Fe2+ (10 μmol/L) and H2O2 (10 μmol/L) for 2 h. The ratio imaging was obtained by comparing red channel (520 ± 20 nm) to green channel (450 ± 20 nm). λex = 405 nm. Scale bar = 10 μm. (f) The fluorescence ratios of Hoe-NI in COS-7 cells with different conditions.
Agarose gel electrophoresis of ctDNA was employed to verify the levels of DNA damage induced by ·OH. This experiment was also performed to make a comparison with fluorescence detection using Hoe-NI as the sensor. As shown in Fig. 4c, the fluorescent bands in the gel indicate that DNA damage could not be induced by Fe2+ alone. But the DNA damage immediately increased after the concentration of generated ·OH was increased, which can be certificated by the reduction of ctDNA band and the increase of DNA fragments. These trends were similar to that observed in fluorescent measurements. However, to track ctDNA in the agarose gel image, we would have to enhance the DNA concentration to 125 μmol/L, otherwise DNA band was hardly trackable in gel. It should be noted again, the fluorescence detection in Fig. 4b, the concentration was 2.5 μmol/L which was just 1/50 that was required in gel imaging. Undoubtedly, using the fluorescence of Hoe-NI to detect DNA damage in solution took the advantage of much higher sensitivity than agarose gel electrophoresis.
Further, Hoe-NI was adopted to in situ detect the levels and realtime visualize the processes of DNA damage within nuclei of living cells. Hydroxyl radicals were used for DNA damage in living cells [33]. COS-7 cells stained with Hoe-NI were exposed to ·OH condition through addition of Fe2+ (10 μmol/L) and H2O2 (10 μmol/ L). The ratio of the fluorescence intensity decreased apparently by? 30% (from 0.62 to 0.44) within 2 h (Figs. 4d and e), which indirectly exhibited the tendency of DNA damage in nucleus. In control experiments, the respectively addition of Fe2+ or H2O2, did not cause an observable change of the ratio (Fig. 4f). This result proved that sensor Hoe-NI was applicable to detect DNA damage induced by ·OH in living cells.
Etoposide is one of the widely used anticancer drugs to kill cells by increasing levels of topoisomerase Ⅱ-mediated DNA breaks [36, 37]. It is known that the drug acts by inhibiting the ability of topoisomerase Ⅱ to stabilize a double-stranded DNA break. We assumed that the drop of the double-stranded DNA contents of cancer cells treated with etoposide might be visualized by the ratiometric imaging with Hoe-NI. Liver cancer SMMC-7721 cells were used to test our hypothesis. The cells stained with Hoe-NI were exposure to etoposide. The two channel imaging and ratio imaging (red/green) were recorded every five minutes (Fig. S6 in Supporting information). The ratio decreased steadily about 50% from 1.1 to 0.5 within 1 h, which can be used to track the variation tendency of DNA damage in nucleus (Fig. S6f). The above results indicate the applicability of Hoe-NI for detection of the doublestranded DNA breaks of cancer cells induced by etoposide. Therefore, Hoe-NI had been qualified as a potential indicator for real-time analysis of the DNA damage in anti-tumor treatment.
In summary, we have developed a sensor Hoe-NI for monitoring of nucleus DNA damage. The sensor was synthesized by an efficient "Click" connection of a DNA targeted Hoechst unit and a naphthalimide dye. This sensor emits dual fluorescence peaks at 450 nm and 505 nm, which can be used for sensitive ratiometric detection of DNA concentration with a limit of detection as low as 72 nmol/L. Hydroxyl radicals induced DNA damage can be quantified with the ratiometric detection in buffer solution. Hoe-NI exhibits specific and wash-free staining of nuclear DNA in various living cells, including normal cells (L02 and COS-7) and cancer cells (SMMC-7721, MCF-7 and Hela). The sensor labeled to nuclear DNA is applicable for two-channel ratiometric imaging of nucleus DNA content in living cells. Finally, the visualized ratiometric detection strategy can be used for the monitoring of nucleus DNA damage induced by hydroxyl radicals and anticancer drug etoposide, respectively.
Acknowledgments
This work was supported by the National Natural Science Foundation of China (Nos. 21376038, 21421005 and 21576040) and National Basic Research Program of China (No. 2013CB733702).
Figure 2
The fluorescence properties of Hoe-NI with ctDNA in Tris-HCl buffer. (a) Fluorescence spectra of Hoe-NI (1 μmol/L) upon the addition of ctDNA (0–25 μmol/L). Inset: Curve-fitting analysis of the intensities ratios at 450 nm and 505 nm. (b) Fluorescence spectra of Hoe-yl (1 μmol/L) upon addition of ctDNA (0–25 μmol/L). (c) Fluorescence spectra of Hoe-NI (1 μmol/L) upon addition of ctDNA (0-0.5 μmol/L). (d) The linear response of ratio intensities at low concentration of ctDNA from 0 to 0.5 μmol/L. The fluorescent spectra with KI quenching for Hoe-NI-ctDNA systems (e) and Np-ctDNA systems (f). λex = 345 nm.
Figure 3
Confocal fluorescence imaging of cells stained with Hoe-NI and cell viability. (a-d) L02 cells. (e-h) SMMC-7721 cells. Cells were stained with Hoe-NI (10 μmol/L) for 30 min. λex = 405 nm, green channel: 450 ± 20 nm, red channel: 520 ± 20 nm. Differential interference contrast (DIC). Scale bar = 10 μm. (ⅰ) Cell viability of different concentrations of Hoe-NI (1 μmol/L, 5 μmol/L and 10 μmol/L) at 24 h.
Figure 4
The effect of ·OH on fluorescence ratio changes of Hoe-NI with ctDNA and cells labeling. (a) Fluorescence spectra of Hoe-NI (1 μmol/L) with ctDNA (2.5 μmol/L) upon addition of Fe2+ (30 μmol/L) and different concentration of H2O2 (0, 30, 60, 90 and 120 μmol/L). (b) Ratio (F505/F450) changes of Hoe-NI (1 μmol/L) with ctDNA (2.5 μmol/L) upon addition of Fe2+ (30 μmol/L) and different concentration of H2O2. λex = 345 nm. (c) Agarose gel electrophoresis: Band 1: DNA marker; 2: ctDNA (125 μmol/L); 3-6: ctDNA (125 μmol/L), Fe2+ (25 μmol/L) and different concentration H2O2 (0, 25, 50 and 75 μmol/L). Fluorescent ratio image of COS-7 cells stained with Hoe-NI before (d) and after (e) added Fe2+ (10 μmol/L) and H2O2 (10 μmol/L) for 2 h. The ratio imaging was obtained by comparing red channel (520 ± 20 nm) to green channel (450 ± 20 nm). λex = 405 nm. Scale bar = 10 μm. (f) The fluorescence ratios of Hoe-NI in COS-7 cells with different conditions.

 下载:
下载:

 下载:
下载:


