
Scheme 1.
Synthesis of Cou-P

Coumarin-Based Turn-on Fluorescent Probe for Copper(Ⅱ) Detection and Its Application in Cell Imaging
Chang-Li ZHANG , Hong ZHANG , Feng-Yun HE , Hui YANG , Shao-Xian LIU , Min-Sheng LIU


Fluorescent sensing of chemical species of biological and environmental significance by fluorescence spectroscopy has emerged as an attractive field for scientists, especially inspired by the development of confocal microscope and optical imaging techniques[1-7]. As the third most abundant transition metal ions in the human body, copper ions play important roles in various biological processes, and maintaining its homeostasis is critical for development of living organisms[8-12]. The disturbed homeostasis of copper ions can result in severe cell damage and further lead to many diseases such as Menkes syndrome, Wilson disease, and Alzheimer disease[13-21]. Due to its essential toxic nature, long-term exposure to high levels of copper has been reported to induce the liver and kidney damage[22]. According to the World Health Organization (WHO) International Standard for drinking water, the maximum acceptable level of copper in drinking water is 30 μmol·L-1 [23]. Considering the important roles of copper in physiological processes and its high toxicity, development of specific fluorescent probes for sensitive copper detection, especially in environmental and physiological conditions is of great significance.
To date lots of fluorescent probes have been reported for Cu2+ detection based on two main mechanisms: coordination of receptor with Cu2+ [24-34] and Cu2+-triggered specific reactions[35-47]. Due to the paramagnetic nature of Cu2+, Cu2+ coordination often results in fluorescence quenching. Fluorescence "turnoff" signals are usually less sensitive and generate false-positive results[24, 48], which is a disadvantage for practical application. Such obstacles can be eliminated by employing reaction-based probes, which achieve fluorescence "turn-on" response and offer high selectivity by reacting specifically with Cu2+ to generate fluorescent products. However, few fluorescence turn-on Cu2+ probes have been reported[49-54], which make the development of new fluorescence turn-on Cu2+ probes highly desired.
In this paper, Cou-P, a turn-on fluorescent probe for Cu2+ sensing based on a mechanism of Cu2+-coordination-induced hydrolysis of hydrazides was developed. Cou-P exhibits a selective and sensitive emission turn-on response to Cu2+ and features visible light excitation and emission profiles. Moreover, its turn-on imaging ability for intracellular Cu2+ has been confirmed in human breast adenocarcinoma cells (MCF-7 cells) using a confocal microscope.
The synthesis route for Cou-P was depicted in Scheme 1. Cou-P was synthesized by reacting of 7-(diethylamino)-coumarin-3-carbonyl chloride and 2, 2′-(hydrazonomethylene)dipyridine in the presence of Et3N in a high yield (85%). It was well characterized by 1H, 13C NMR and ESI-MS (Supporting Information).
All chemicals and solvents were of analytical grade or spectroscopic grade and were used without further purification. Dichloromethane was refluxed with calcium hydride and distilled at ambient pressure. 1H NMR and 13C NMR spectra were recorded on a Bruker DRX-300 spectrometer or Bruker DRX-500 spectrometer with TMS as internal reference in CDCl3. Mass spectrometric data were determined with LCQ ESI-MS Thermo Finnigan mass spectrometer. Absorption spectra were measured on a Shimadzu UV-3100 UV-Vis-NIR spectrophotometer. The fluorescence spectra were recorded with an AMINCO Bowman series 2 luminescence spectrophotometer (cuvette, 1 cm) with a xenon lamp as the light source.
A solution of compound 1 (200 mg, 0.72 mmol) in CH2Cl2 (5 mL) was slowly added to a solution of compound 2 (143 mg, 0.72 mmol) and Et3N (80 mg, 0.68 mmol) in CH2Cl2 (10 mL). The reaction mixture was stirred at room temperature for 24 h. The mixture was washed with water (3×15 mL). The organic layer was dried on MgSO4 and filtered, and the filtrate was concentrated to dryness. The crude product was purified by column chromatography (silica gel, VMeOH: VCH2Cl2 =1:10, Rf=0.4), and pure compound Cou-P was obtained as an orange solid (270 mg) in 85% yield. 1H NMR (400 MHz, CDCl3): δ 8.97 (d, 1H, J=4.0), 8.83 (s, 1H), 8.58 (d, 1H, J=4.0), 8.28 (d, 1H, J=8.0), 7.86~7.78 (m, 2H), 7.52 (d, 2H, J=8.0), 7.46~7.30 (m, 2H), 7.28~7.31 (t, 1H, J=4.0), 6.63~6.66 (dd, 1H, J1=2.4, J2=2.0), 6.47(s, 1H), 3.42~3.48(q, 4H, J1=7.6, J2=6.8), 1.21~1.253 (t, 6H, J=7.2); 13C NMR (100 MHz, CDCl3): δ 161.92, 161.04, 158.12, 156.23, 153.04, 151.85, 149.45, 149.25, 149.07, 148.59, 136.86, 136.82, 131.53, 126.13, 124.18, 124.14, 123.70, 110.23, 110.16, 108.82, 96.84, 45.30, 12.59. ESI-MS (positive mode): Calcd. 905.90, Found: 905.08 for [2M+Na]+. Element analysis Calcd. for C25H23N5O3(%): C, 68.01; H, 5.25; N, 15.86. Found(%): C, 68.12; H, 5.46; N, 15.78.
All the solvents were of analytic grade. The stock solution of Cou-P was prepared in CH3OH (1.04 mmol ·L-1). For spectroscopic determination, the stock solution was diluted with PBS to the desired concen-tration. The stock solutions of metal ions were prepared by dissolving Cu(NO3)2, CoCl2·6H2O, NiCl2·6H2O, HgCl2, MnCl2, Fe(NO3)3·9H2O, FeSO4·7H2O, AgNO3, PbCl2, Zn(NO3)2·7H2O, CdCl2·2.5H2O, KCl, CaCl2, NaCl, MgCl2·6H2O with doubly distilled water. Fluorescence measurements of Cou-P (10 μmol·L-1) were performed with 4 nm slit for excitation and 4 nm slit for emission. The UV-Vis titration of Cou-P was carried out by adding aliquots of 2.5 μL of Cu(NO3)2 aqueous solution (1.2 mmol·L-1) to 3 mL of probe solution (10 μmol·L-1) in a cuvette. The spectra were recorded after the solution was completely mixed. The fluorescence titration of Cou-P was also carried out by adding aliquots of 2.5 μL of Cu(NO3)2 aqueous solution (1.2 mmol·L-1) to 3 mL of sample solution (10 μmol·L-1) in a cuvette. The measurements were carried out in 2 min after the addition. All experiments were carried out at 298 K.
MCF-7 cells were cultured in Dulbecco′s Modified Eagle Medium supplemented with 10% fetal bovine serum, penicillin (100 unit·mL-1), streptomycin (100 mg·mL-1) and 5%(V/V) CO2 at 37 ℃. After removing the incubation media and rinsing with 1×PBS (0.01mol·L-1) for three times. The MCF-7 cells were incubated with Cou-P (20 μmol·L-1) for 30 min at 25 ℃. Then the cells were washed three times with 1×PBS and imaged with Zeiss LSM-710 microscope equipped with a 63× oil-immersion objective. For the imaging of MCF-7 cells upon incubation with exogenous Cu2+, the exogenous Cu2+ was introduced by incubating the cells with Cu(NO3)2 (200 μmol·L-1) solution for 5 h at 25 ℃. The excitation wavelength of Cou-P used in experiment was 405 nm, while the filter was 420~520 nm.
The sensing ability of probe Cou-P for Cu2+ was investigated using fluorescence spectroscopy in HEPES buffer solution (50 mmol·L-1, 0.1 mol·L-1 KNO3, pH=7.2). As shown in Fig. 1, the probe Cou-P itself showed relatively weak fluorescence at 497 nm (Ф=0.005) when excited by 460 nm. However, upon addition of 5 eq. of Cu2+, probe Cou-P exhibited a significant fluorescence enhancement at 464 nm (Ф=0.068), indicating that Cou-P could be efficiently responded in the presence of Cu2+.
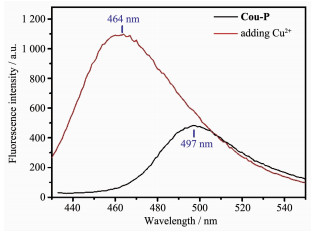
Excitation wavelengths are 460 nm for Cou-P and 400 nm for adding 5 eq. Cu2+, respectively
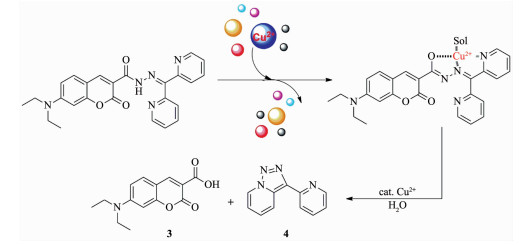
Due to few reports on the reaction copper probes of hydrazide derivatives, the recognition mechanism of probe Cou-P for Cu2+ was investigated in detail. First, Cu2+ binding behaviour in Cou-P was investigated by fluorescent and UV-Vis titration experiments. The UV-Vis titration experiment demonstrates that free Cou-P has two main absorption bands centering at 454 (ε=2.8×10⁴ L·mol-1·cm-1) and 318 nm, which can be assigned to ICT and π-π* transition bands, respectively (Fig. 2a). When Cu2+ was added, distinct reduction of the former band can be observed accompanied by the evident bathochromic shift to 474 nm, suggesting the increased coplanarity of electrondonating group induced by Cu2+ binding. Similar change was also observed for the latter band, yet the band shift is much less pronounced. The clear isosbestic points at 471, 396 and 339 nm imply the undoubted conversion of free Cou-P to a copper complex. The titration profile based on the former band shows that the absorbance descends linearly with cCu2+ at the ratio of cCu2+/cCou-P≤1. Higher cCu2+ does not lead to any further evident change of isosbestic points at 471, 396 and 339 nm, suggesting a 1:1 stoichiometry for the copper complex. The result obtained from fluorescence Job′s plot also confirms the 1:1 Cu2+ binding stoichiometry (Supporting information, Fig.S1). Cou-P/Cu2+ complexes can remain stable for at least 120 min at pH 7.2 (Fig.S2). However, after the ratio of cCu2+/cCou-P attained 1, upon addition of another 0.1 eq. Cu2+ to the solution of Cou-P/Cu2+ complex, a new absorption band centered at 414 nm appeared and the intensity enhanced gradually in a time-dependent manner; at the same time, the absorption band at 474 nm exhibited decrease(Fig. 2b). The clear isosbestic points at 454 nm imply the undoubted conversion of Cou-P/Cu2+ complex to another compound. Normalized emission spectra of 3-(carboxylic acid)-7-(diethylamino)-coumarin (Cou-COOH) and Cou-P incubated with 1.1 eq. Cu(NO3)2 for 80 min overlaped well, Cou-P/Cu2+ complex may convert to Cou-COOH (Fig.S3).
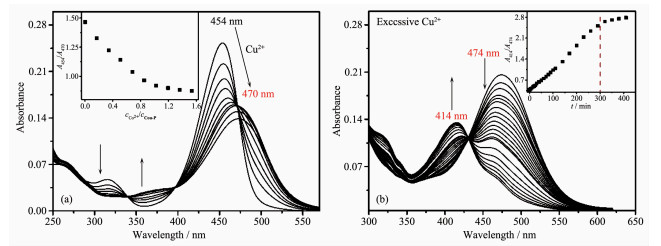
Inset: (a) titration profile based on the absorption ratio at 454 and 470 nm, A454/A470; (b) plot of A414/A474 as a function of time upon addition of Cu(NO3)2
Further fluorescence titration of Cou-P by Cu2+ shows similar phenomena. Titration of Cou-P by Cu2+ exhibits a linear emission decrease with cCu2+, and the fluorescence of Cou-P was quenched efficiently when the cCu2+/cCou-P ratio attained 1 (Fig. 3a). However, after the cCu2+/cCou-P ratio attained 1, upon addition of another 0.1 eq. Cu2+ to the solution of Cou-P/Cu2+ complex, a new excitation band centered at 403 nm appeared and the intensity enhanced gradually in a time-dependent manner (Fig. 3b). After 300 minutes, the fluorescence intensity at 403 nm (I403) was reached its maximum. Further addition of EDTA could not eliminate the fluorescence (Fig.S4). This result demon-strates that Cou-P/Cu2+ complex might have undergone Cu2+-catalyzed chemical reactions.
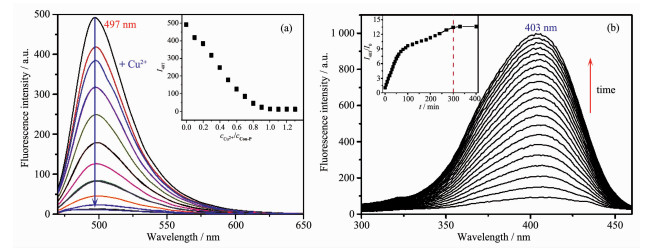
Inset: (a) titration profile based on the emission intensity at 497 nm, I497, λex=460 nm; (b) time-dependent fluorescence at 403 nm, λem=510 nm, slit width=dex=dem=4.0 nm, PMT voltage=950 V
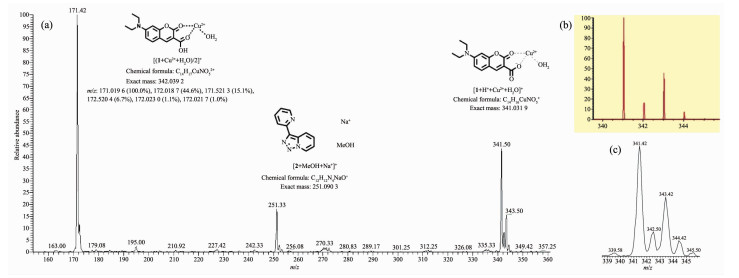
To further verify the recognition mechanism of probe Cou-P for Cu2+, the reaction product of Cou-P with Cu2+ was characterized by the ESI-MS spectrometry. After addition of 1.1 eq Cu(NO3)2 for 60 min, ESI-MS of Cou-P shows a peak assigned to [Cou-P-H++Cu2++CH3OH]+ (Fig.S5). After 300 min, there are three prominent peaks, 341.5 assigned to [3-H++Cu2++H2O]+, 171.42 assigned to [(3+Cu2++H2O)/2]+, 251.33 assigned to [4+MeOH+Na+]+, respectively (Fig. 4). The isotopic distribution of peak at 341.5 matches with the results of ISOPRO 3.0 simulation, which further indicates the reaction product of Cou-P with Cu2+. This result is consistent with the experimental results of spectroscopy.
Thus, the coordination of Cu2+ to picolinic ester in probe Cou-P is essential for the Cu2+-promoted hydrolytic cleavage of Cou-P to Cou-COOH (3). Based on the above results, a detailed recognition mechanism of probe Cou-P for Cu2+ was proposed as shown in Scheme 2.
Selectivity is a crucial parameter to assess the performance of the developed probes. Therefore, the selectivity experiments of Cou-P were extended to a variety of biological-related species including common cations (K+, Na+, Mg2+, Ca2+, Co2+, Ni2+, Fe2+, Fe3+, Hg2+, Mn2+, Zn2+, Cd2+, Pb2+ and Ag+). As shown in Fig. 5a, only introduction of Cu2+ could cause apparent fluorescence intensity changes of the probe Cou-P solution, most of the tested cation did not induce any emission enhancement at 403 nm. According to the value of I403/I460, Cu2+ can induce 13-fold fluorescence enhancement, and Co2+ and Ni2+ also induce very minor enhancement due to fluorescence quenching at 460 nm (Fig. 5b). Moreover, the abundant metal cations in natural water such as Na+, K+, Ca2+ and Mg2+ do not result in distinct emission either. This provides probe Cou-P the advantage in sense Cu2+ in samples containing abundant Na+, K+, Ca2+, and Mg2+, such as living cells.
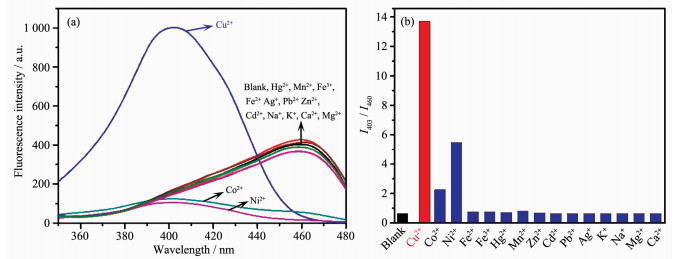
Final concentration for Cd2+, Zn2+, Co2+, Cu2+, Fe2+, Fe3+, Hg2+, Mn2+, Ni2+ and Pd2+ is 20 μmol·L-1, for Na+, K+, Ca2+ and Mg2+ is 10 mmol·L-1
The cytotoxicity of probe Cou-P in MCF-7 cells was evaluated by MTT assays with the concentration of the probe ranging from 2 to 50 μmol·L-1 (Fig.S6). The results show that Cou-P is of low cytotoxicity to cultured cells and should be safe when used for bioimaging of Cu2+.
Based on the favorable features of Cou-P including visible emission, high selectivity for Cu2+ and low toxicity, the potential utility of Cou-P to visualize Cu2+ in living cells was investigated. As shown in Fig. 6, MCF-7 cells incubated with Cou-P (10 μmol·L-1) alone for 30 min at 37 ℃ exhibited no observable fluorescence. However, when cells were further incubated with Cu2+ (200 μmol·L-1) for 300 min at 37 ℃, remarkable intracellular fluorescence could be observed. These results indicate that probe Cou-P is permeable to cell membrane and suitable for imaging Cu2+ in living cells.
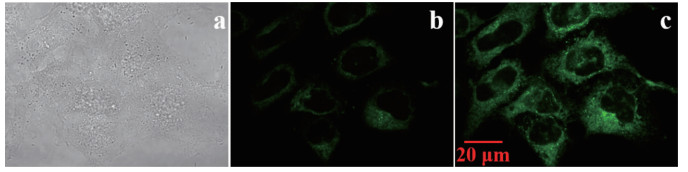
Band path: 420~520 nm, λex=405 nm
In summary, we successfully developed a new reaction fluorescent probe for detecting Cu2+. Probe Cou-P exhibits a fluorescence "turn-on" recognition process for Cu2+. The recognition mechanism of probe Cou-P for Cu2+ was investigated by UV-Vis, fluorescence and ESI-MS spectrometry. In application, Cou-P shows low cytotoxicity and good membrane permeability. More importantly, Cou-P was successfully used for the detection of Cu2+ in living cells, indicating its great potential for Cu2+ detection in biological science.
Supporting information is available at http://www.wjhxxb.cn
Martínez-Máez R, Sancenón F. Chem. Rev., 2003, 103:4419-4476 doi: 10.1021/cr010421e
Thomas S W, Joly G D, Swager T M. Chem. Rev., 2007, 107:1339-1386 doi: 10.1021/cr0501339
Kim S K, Lee D H, Hong J I, et al. Acc. Chem. Res., 2009, 42:23-31 doi: 10.1021/ar800003f
Xu Z C, Chen X Q, Kim H N, et al. Chem. Soc. Rev., 2010, 39:127-137 doi: 10.1039/B907368J
Zhou Y, Xu Z C, Yoon J. Chem. Soc. Rev., 2011, 40:2222-2235 doi: 10.1039/c0cs00169d
Vendrell M, Zhai D T, Er J C, et al. Chem. Rev., 2012, 112:4391-4420 doi: 10.1021/cr200355j
Liu Z P, He W J, Guo Z J. Chem. Soc. Rev., 2013, 42:1568-1600 doi: 10.1039/c2cs35363f
Prohaska J R, Gybina A A. J. Nutr., 2004, 134:1003-1006 doi: 10.1093/jn/134.5.1003
Davis A V, O'Halloran T V. Nat. Chem. Biol., 2008, 4:148-151 doi: 10.1038/nchembio0308-148
Que E L, Domaille D W, Chang C J. Chem. Rev., 2008, 108:1517-1549 doi: 10.1021/cr078203u
Thiele D J, Gitlin J D. Nat. Chem. Biol., 2008, 4:145-147 doi: 10.1038/nchembio0308-145
Robinson N J, Winge D R. Annu. Rev. Biochem., 2010, 79:537-562 doi: 10.1146/annurev-biochem-030409-143539
Cuajungco M P, Lees G J. Neurobiol. Dis., 1997, 4:137-169 doi: 10.1006/nbdi.1997.0163
Bush A I. Curr. Opin. Chem. Biol., 2000, 4:184-191 doi: 10.1016/S1367-5931(99)00073-3
Valentine J S, Hart P J. Proc. Natl. Acad. Sci. USA, 2003, 100:3617-3622 doi: 10.1073/pnas.0730423100
Brown D R, Kozlowski H. Dalton Trans., 2004, 13:1907-1917
Millhauser G L. Acc. Chem. Res., 2004, 37:79-85 doi: 10.1021/ar0301678
Frederickson C J, Koh J Y, Bush A I. Nat. Rev. Neurosci., 2005, 6:449-462 doi: 10.1038/nrn1671
Gaggelli E, Kozlowski H, Valensin D, et al. Chem. Rev., 2006, 106:1995-2044 doi: 10.1021/cr040410w
Lutsenko S, Gupta A, Burkhead J L, et al. Arch. Biochem. Biophys., 2008, 476:22-32 doi: 10.1016/j.abb.2008.05.005
Kaler S G. Nat. Rev. Neurol., 2011, 7:15-29 doi: 10.1038/nrneurol.2010.180
Domaille D W, Que E L, Chang C J. Nat. Chem. Biol., 2008, 4:168-175 doi: 10.1038/nchembio.69
World Health Oganization. Guidelines for Drinking-Water Quality. 4th Ed. Geneva:World Health Organization, 2017:341
Wang X B, Ma X Y, Yang Z, et al. Chem. Commun., 2013, 49:11263-11265 doi: 10.1039/c3cc46585c
Kang D E, Lim C S, Kim J Y, et al. Anal. Chem., 2014, 86:5353-5359 doi: 10.1021/ac500329k
Sharma N, Reja S I, Bhalla V, et al. Dalton Trans., 2014, 43:15929-15936 doi: 10.1039/C4DT01676A
Han Y Y, Ding C Q, Zhou J, et al. Anal. Chem., 2015, 87:5333-5339 doi: 10.1021/acs.analchem.5b00628
Kaur M, Ahn Y H, Choi K, et al. Org. Biomol. Chem., 2015, 13:7149-7153 doi: 10.1039/C5OB00907C
Li S, Zhang D, Xie X Y, et al. Sens. Actuators B, 2016, 224:661-667 doi: 10.1016/j.snb.2015.10.086
Jiang H, Li Z J, Kang Y F, et al. Sens. Actuators B, 2017, 242:112-117 doi: 10.1016/j.snb.2016.11.033
Li Y Y, Sun M T, Zhang K, et al. Sens. Actuators B, 2017, 243:36-42 doi: 10.1016/j.snb.2016.11.118
Liu L L, Dan F J, Liu W J, et al. Sens. Actuators B, 2017, 247:445-450 doi: 10.1016/j.snb.2017.03.069
Yoon J W, Chang M J, Hong S, et al. Tetrahedron Lett., 2017, 58:3887-3893 doi: 10.1016/j.tetlet.2017.08.071
范方禄, 靖金球, 陈雪梅.无机化学学报, 2015, 31(3):548-554 http://www.wjhxxb.cn/wjhxxbcn/ch/reader/view_abstract.aspx?flag=1&file_no=20150318&journal_id=wjhxxbcnFAN Fang-Lu, JING Jin-Qiu, CHEN Xue-Mei. Chinese J. Inorg. Chem., 2015, 31(3):548-554 http://www.wjhxxb.cn/wjhxxbcn/ch/reader/view_abstract.aspx?flag=1&file_no=20150318&journal_id=wjhxxbcn
Lin W Y, Yuan L, Tan W, et al. Chem. Eur. J., 2009, 15:1030-1035 doi: 10.1002/chem.200801501
Li N, Xiang Y, Tong A. Chem. Commun., 2010, 46:3363-3365 doi: 10.1039/c001408g
Cheng J H, Zhang Y H, Ma X F, et al. Chem. Commun., 2013, 49:11791-11793 doi: 10.1039/c3cc47137c
Huang L Y, Gu B, Su W, et al. RSC Adv., 2015, 5:76296-76301 doi: 10.1039/C5RA14443D
Hu X X, Zheng X L, Fan X X, et al. Sens. Actuators B, 2016, 227:191-197 doi: 10.1016/j.snb.2015.12.037
Li D X, Sun X, Huang J M, et al. Dyes Pigm., 2016, 125:185-191 doi: 10.1016/j.dyepig.2015.10.016
Sun J, Wang B, Zhao X, et al. Anal. Chem., 2016, 88:1355-1361 doi: 10.1021/acs.analchem.5b03848
Tan W B, Leng T H, Lai G Q, et al. J. Photochem. Photobiol. A, 2016, 324:81-86 doi: 10.1016/j.jphotochem.2016.03.014
Tang J, Ma S G, Zhang D, et al. Sens. Actuators B, 2016, 236:109-115 doi: 10.1016/j.snb.2016.05.144
Wang B G, Cui X Y, Zhang Z Q, et al. Org. Biomol. Chem., 2016, 14:6720-6728 doi: 10.1039/C6OB00894A
Zhu D J, Luo Y H, Shuai L, et al. Tetrahedron Lett., 2016, 57:5326-5329 doi: 10.1016/j.tetlet.2016.10.056
Zheng X L, Ji R X, Cao X Q, et al. Anal. Chim. Acta, 2017, 978:48-54 doi: 10.1016/j.aca.2017.04.048
Gu B, Huang L Y, Xu Z F, et al. Sens. Actuators B, 2018, 273:118-125 doi: 10.1016/j.snb.2018.06.032
Sirilaksanapong S, Sukwattanasinitt M, Rashatasakhon P. Chem. Commun., 2012, 48:293-295 doi: 10.1039/C1CC16148B
Zhao C C, Feng P, Cao J, et al. Org. Biomol. Chem., 2012, 10:3104-3109 doi: 10.1039/c2ob06980f
Yang C Y, Chen Y, Wu K, et al. Anal. Methods, 2015, 7:3327-3330 doi: 10.1039/C5AY00224A
Tang L J, He P, Zhong K L, et al. Spectrochim. Acta Part A, 2016, 169:246-251 doi: 10.1016/j.saa.2016.06.045
Zhu D J, Luo Y H, Yan X W, et al. RSC Adv., 2016, 6:87110-87114 doi: 10.1039/C6RA18669F
Zhang H T, Feng L, Jiang Y, et al. Biosens. Bioelectron., 2017, 94:24-29 doi: 10.1016/j.bios.2017.02.037

Figure 1 Fluorescence spectra of Cou-P (10 μmol·L-1) and the corresponding hydrolysis product after adding 5 eq. Cu2+ in HEPES buffer (50 mmol·L-1, 0.1 mol·L-1 KNO3, pH 7.2)
Excitation wavelengths are 460 nm for Cou-P and 400 nm for adding 5 eq. Cu2+, respectively

Figure 2 (a) Absorbance spectra of 10 μmol·L-1 Cou-P in HEPES buffer obtained by adding 0~1.6 eq. Cu(NO3)2 (1.2 mmol·L-1) solution; (b) Time-dependent UV-Vis absorption spectra of 20 μmol·L-1 Cou-P in HEPES buffer obtained by adding excessive Cu(NO3)2 (100 μmol·L-1) solution
Inset: (a) titration profile based on the absorption ratio at 454 and 470 nm, A454/A470; (b) plot of A414/A474 as a function of time upon addition of Cu(NO3)2

Figure 3 (a) Emission spectra of 10 μmol·L-1 Cou-P in HEPES buffer obtained by adding aliquots of 2.5 μL Cu(NO3)2 (1.2 mmol·L-1) solution; (b) Time-dependent fluorescent excitation spectra of 10 μmol·L-1 Cou-P in HEPES buffer after addition of 1.1 eq. Cu(NO3)2
Inset: (a) titration profile based on the emission intensity at 497 nm, I497, λex=460 nm; (b) time-dependent fluorescence at 403 nm, λem=510 nm, slit width=dex=dem=4.0 nm, PMT voltage=950 V

Figure 4 (a) ESI-MS of Cou-P in MeOH/H2O (1:1, V/V) after addition of 1.1 eq. Cu(NO3)2 for 5 h; (b) Corresponding simulated one for [3-H++Cu2++H2O]+; (c) Determined isotopic distribution patterns of the peak with m/z of 341.50

Figure 5 (a) Excitation spectra of Cou-P (10 μmol·L-1) in the presence of various metal ions in HEPES buffer (50 mmol·L-1, 0.1 mol·L-1 KNO3, pH 7.2); (b) Ratio of fluorescence intensity at 403 and 460 nm of 10 μmol·L-1 Cou-P induced by different metal ions in HEPES buffer
Final concentration for Cd2+, Zn2+, Co2+, Cu2+, Fe2+, Fe3+, Hg2+, Mn2+, Ni2+ and Pd2+ is 20 μmol·L-1, for Na+, K+, Ca2+ and Mg2+ is 10 mmol·L-1

Figure 6 Confocal fluorescence images of intracellular Cu2+ in MCF-7 cells with Cou-P-staining: (a) Bright-field transmission images; (b)MCF-7 cells incubated with Cou-P (10 μmol·L-1) at 37 ℃ for 30 min; (c)Stained cells further exposed to 200 μmol·L-1 Cu(NO3)2 solution at 37 ℃ for 300 min
Band path: 420~520 nm, λex=405 nm

 扫一扫看文章


扫一扫关注我们
 下载:
下载:

 下载:
下载:
