Citation:
Yukai Tong, Zhijun Wu, Bo Zhou, Min Hu, Anpei Ye. Surface tension of single suspended aerosol microdroplets[J]. Chinese Chemical Letters,
2024, 35(4): 109062.
doi:
10.1016/j.cclet.2023.109062
Surface tension of single suspended aerosol microdroplets
English
Surface tension of single suspended aerosol microdroplets
Key Laboratory for the Physics and Chemistry of Nanodevices, School of Electronics, Peking University, Beijing 100871, China
b.
State Key Joint Laboratory of Environmental Simulation and Pollution Control, College of Environmental Sciences and Engineering, Peking University, Beijing 100871, China
c.
Aerospace Information Research Institute, Chinese Academy of Sciences, Beijing 100094, China
Received Date:
24 May 2023 Accepted Date:
07 September 2023 Revised Date:
04 September 2023 Available Online:
15 April 2024
Abstract:
The surface tension of troposphere aerosols can significantly influence their atmospheric processes and key properties, particularly on the morphology, the phase transition, the activation as cloud condensation nuclei, and the gas-particle partitioning. However, directly measuring the surface tension of single ambient aerosol is quite challenging, due to the limitations of their picolitre volumes and thermal motion. Here, we developed a dual laser tweezers Raman spectroscopy (DLT-RS) system to directly sense the surface tension of single airborne microdroplets (PM10 particles). A pair of aerosol droplets were trapped and driven to coalesce by the laser tweezers. Meanwhile, the backscattering light intensity and bright-field images during the coalescence process were recorded to characterize the aerosol surface tension. A remarkable advantage of directly sensing aerosol surface tension is that the solutes in aerosols are often supersaturated, which is common in atmospheric aerosols but almost unavailable in bulk solutions. We experimentally measured the surface tension of aerosols composed of nitrates or oxalic acid/nitrate mixture. Besides, the variation of surface tension during aerosol aging process was also explored, which brings possible implications on the surface evolution of actual ambient aerosol during their atmospheric lifetime.
Ambient aerosols can directly influence the climate through impacting the atmospheric energy distribution by scattering and absorbing the solar radiation [1,2]. Meanwhile, aerosols can also indirectly influence the climate by modulating the cloud droplet number concentrations [3]. In the process known as cloud condensation nuclei (CCN) activation, nanometer-sized aerosol particles act as CCN and grow into supermicron-sized cloud droplets by condensation of water vapor. The aerosol surface tension is one of the influential physicochemical properties which dictate this process. The Köhler theory describes the thermodynamic conditions required for CCN activation and relates the surface tension to the relative humidity (RH) at which particles activate into cloud droplets [4]. Traditionally, surface tension has been supposed to a fixed term, which reduces the complexity of the activation process and provides compact and useful models to describe CCN activation [5,6]. However, recent laboratory measurements and field campaigns have reported a distinctive depression in aerosol surface tension because non-negligible surface behaviors, such as bulk-surface partitioning, surface adsorption, and organic components volatilizing, occurred in the gas-particle surface [7–10]. Thus, according to the Köhler theory, the CCN activation required RH conditions lower than traditionally predicted. Indeed, many out-field observations of cloud droplet number concentrations were not fully explained when using the static surface tension models [11,12]. It warrants direct measurements of aerosol surface tension to gain an explicit and robust understanding of CCN activation.
The incredibly complex components of aerosols lead to their diverse morphologies. A substantial population of troposphere aerosols are phase-separated [13–15], the morphologies of which are determined by their surface/interface tensions. A homogeneous airborne microdroplet has a morphology of sphere under the effect of self-surface tension. However, for phase-separated aerosols with various surface/interface tension values, their morphologies can be mainly categorized as partially-engulfed and core-shell [16–19]. Moreover. the variation of surface tension during aerosol aging may even convert their morphologies among partially-engulfed, core-shell and homogeneous [16,20,21]. Thus, a clear picture of aerosol surface tension plays a pivotal role in estimating the surface albedo and the dependent global radiation budget.
Despite of these importances, direct measurements on aerosol surface tension are still scarce. The solutes in aerosols are often supersaturated which implies that it is pretty hard to replicate aerosol concentration in bulk solutions. Besides, aerosols keep transferring volatile/semi-volatile materials with surrounding vapor, rendering a dynamic chemical composition. Therefore, reconciling bulk phase data with the high surface-to-volume aerosols is presumably problematic. Moreover, the limited amount of aqueous aerosol extracts collected from atmospheric aerosol samples also results a breakdown in conventional tensiometer techniques. Thus far, three archetypes of techniques have been harnessed to sense microdroplet surface tension. (ⅰ) One type is the microfluidic method which develops various microfluidic platforms to produce rheology and then determine the tension through conventional approaches, such as the pendant drop approach [7,22–25], the Young-Laplace approach [26], the adsorption isotherm model [27], and the shear flow hydrodynamics [28–31]. These works directly extrapolate the bulk techniques to the microscale, however, almost all of the measured data are liquid-liquid interface tension values while the air-liquid surface tension which is crucial for atmospheric environment is still rare. (ⅱ) Another type is the oscillating droplet method which can also be divided into two subtypes, i.e., damped oscillatory method and capillary wave method. The damped oscillatory method distorts the microdroplets through various ways, such as droplets coalescence [32–35] and droplets falling [36,37]. The process of silhouette restoration after droplets coalescence or falling follows the response of a damped oscillator [38,39], the oscillation frequency of which can be used to estimate the droplet surface tension. The timespan of droplet falling is too short to allow the droplets to come to full thermodynamic equilibrium with the surrounding gas phase, thus the controllable droplets coalescence is more feasible for characterizing aerosol surface tension. Contrast to the damped oscillatory method, the capillary wave method leverages the passive resonance of capillary waves in droplet surface rather than artificially induced distortion to estimate surface tension [40–42]. The characteristic resonant frequency of capillary waves derived by Lamb [39] can be used to infer the droplet surface tension. (ⅲ) The final type adopts various microscopes, including transmission electron microscopy (TEM) and atomic force microscopy (AFM), to detect microscale tensile behaviors and uses surface mechanics to sense the surface tension. The TEM method probes the contact angle of substrate-deposited droplets and infers surface tension according to the Young-Laplace equation [43]. The AFM method probes the surfaces of substrate-deposited droplets and relates the probe tip retention force to the surface tension [44–47] however, the contact with nanoneedle tip or substrate and the possible crystallization on the tip limit their measurement quality.
In this letter, we utilized a self-developed DLT-RS system to trap and manipulate droplets coalescence and examined the RH-dependent aerosol surface tension at an individual contactless particle level. First, we analyzed the recorded signal during the coalescence process to further infer aerosol surface tension. Afterwards, we measured and compared the surface tension of aerosols with composition of ammonium nitrate and magnesium nitrate. Considering the variable surface tensions reported in previous works [7–10], we finally characterized the dynamics of surface tension during nitrate aerosols aging to provide more evidences on single particle basis.
The aerosol surface tension can be inferred from observing a coalescence event of a pair of trapped droplets [38,39]. The process of droplet deformation and restoration can be described by a damped oscillator, the modal angular frequencies (ωl) of which is specified as follows (Eq. 1):
(1)
where l is the order of the oscillating mode and σ, a, ρ are the surface tension, radius, and density of the droplet, respectively. For a levitated microdroplet trapped in the laser tweezer, its radius and refractive index can be conveniently determined from its cavity-enhanced Raman spectrum (Section S5 in Supporting information). Then the droplet density can be calculated with the empirical relationship between refractive index and density [48,49]. Besides, previous works [32,50,51] indicated that only the l = 2 mode needed to be considered when describing the shape relaxation. Thus, once given the Raman spectrum and the oscillating frequency, ωl=2, the aerosol surface tension can be measured. An epitome of coalescence event is presented in Fig. 1.
Figure 1
Figure 1.
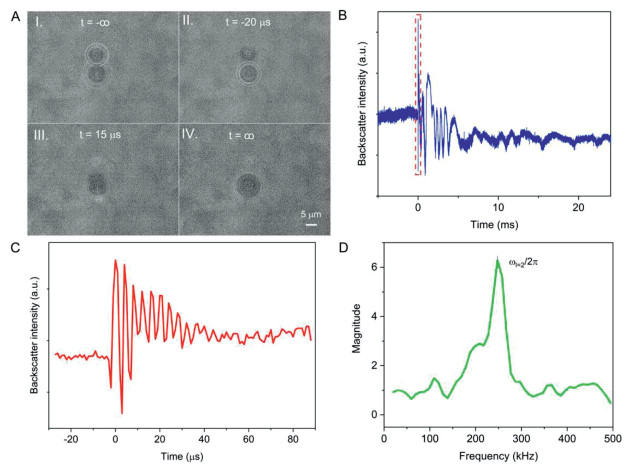
A coalescence event of aerosols composed of ammonium nitrate. (A) Time course of coalescence process of droplets (bright-field image). Ⅰ~Ⅳ are the representative stills of the coalescence process. Ⅰ: the trapped droplets after equilibrating with surrounding gas vapor. Ⅱ: the droplets just before coalescence. Ⅲ: droplet in the middle of coalescence. Ⅳ: droplet after coalescence. Time = -∞ means the droplets have equilibrated to the surrounding moisture and are ready to collide. Time = ∞ means the composited droplet return to a sphere after morphology distortion. (B) The recorded intensity of elastic backscattering light during the coalescence process. The sampling frequency is 200 MHz. Time = 0 indicates the onset of the coalescence. (C) Detail view of the signal labelled by red dashed rectangle frame in B. (D) Fast Fourier transform of the signal in C. The frequency of the shape oscillation is derived.
The RH in the aerosol trapping chamber was first to be pre-set as a value (e.g., 50%). As shown in Fig. 1A, after the readout of the RH probe (HC2A-S, ROTRONIC) reached the given value, the studied droplets were injected into the chamber, and then a pair of droplets were respectively trapped by two laser beams for a period to allow the droplets to equilibrate to the surrounding moisture. In this period, the nascent aerosols may absorb or lose water to come to full thermodynamic equilibrium with the surrounding moisture. Then, with modulating the intensities of the laser beams, the upper droplet escaped from the upper optical well, leading to a slight defocusing, and approached and collided with the lower droplet. Afterwards, the droplets coalescence took place, rendering a distinct non-spherical shape of the composited droplet. The coalescence event culminated in a stable larger droplet suspending in the lower optical well. Details of the single particle technique used here can be seen in Section S1 (Supporting information) and in our previous works [51–53]. The intensity of the elastic backscattering light during droplets coalescence was recorded by the PMT (photomultiplier tube). The cavity-enhanced Raman spectrum of the composite droplet was recorded by the spectrograph. Fig. 1B shows the corresponding time-variation of backscattering light intensity, where a prominent impulse existed at the moment of droplets coalescence (highlighted by red dashed rectangle frame). The subsequent rise and fall of the intensity indicated that the z-axis coordinate of the composited droplet kept changing because of the rebalance between the gravity of the nascent composited droplet and the restoring force of the optical well. Fig. 1C is the detail view of the impulse which shows a characteristic damped oscillation. The oscillation in the scattering intensity before t = 0 s resulted from the small fluctuations in position due to the Brownian motion of the droplet in the optical well. The abrupt growth at t = 0 s indicated that the incoming droplet made contact with the trapped droplet. The frequency of the oscillation in the backscatter intensity following the initial contact between the coalescing droplets was disproportionately higher than that before t = 0 s, indicating that it was most likely due to fluctuations in the shape of the composite droplet. Fig. 1D gives the fast Fourier transform of such oscillation and a single oscillation frequency corresponding to the l = 2 mode is evident at ~247 kHz. With this derived frequency, one can experimentally determine the droplet surface tension according to Eq. 1.
The nitrate aerosols which are pervasive in the troposphere have been substantiated to play pivotal roles in the burst of PM2.5 where the positive feedback between the particle increase and the interfacial catalytic oxidation enhancement gives rise to the boom of atmospheric particles [54–57]. To provide insights into this kind of aerosols from a fundamental physical chemistry perspective, we herein directly measured their surface tensions at single particle level. The inferred surface tensions of aerosols composed of ammonium nitrate or magnesium nitrate are reported in Fig. 2 and compared with previous bulk phase measurements.
Figure 2
Figure 2.
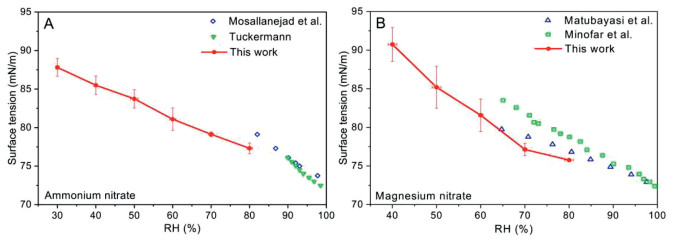
RH-dependent surface tension of aerosols composed of ammonium nitrate or magnesium nitrate. (A) Surface tension of ammonium nitrate aerosol. Red solid point: this work, single particle measurements; blue hollow diamond, Mosallanejad et al. [58], bulk measurements; green hollow inverted triangle, Tuckermann [59], bulk measurements. (B) Surface tension of magnesium nitrate aerosol. Red solid point: this work, single particle measurements; blue hollow triangle, Matubayasi et al. [60], bulk measurements; green hollow square, Minofar et al. [61], bulk measurements. The uncertainties are the standard deviations resulting from averaging multiple measurements. The experiment was conducted at 294.26 ± 0.71 K.
As shown in Fig. 2A, at RH range of 90%-100%, the extrapolated results of ammonium nitrate aerosols measured using laser tweezers agree well with other bulk measurements [58,59], which validates the experimental approach. Nonetheless, when RH decreased, the measurement difference between aerosol and bulk phase grew, indicating that the surface tension values of bulk phase cannot be linearly extrapolated to the microscale. A possible explanation is that the composition of aerosols at low RH was disparate with the bulk solutions because of their supersaturated states. Fig. 2B interprets the RH-dependent surface tension of magnesium nitrate aerosols. It can be seen that our results agreed well with that of Matubayasi et al. [60] at the RH range of 60%–80%. As RH decreased, the surface tension of magnesium nitrate aerosols elevated more promptly than ammonium nitrate aerosols. Moreover, at the same RH conditions, the surface tension of magnesium nitrate aerosols was higher than that of ammonium nitrate aerosols. Molecular dynamic simulation results showed that when a simple electrolyte constituted of cations and anions was dissolved in pure water, the anions was absorbed in the surface and depleted in the subsurface layer, meanwhile, the subsurface was preferentially occupied by cations, resulting in the formation of the electric double layer [58,61]. The magnesium was per se strongly repelled from the air/water interface [62], which implied that the magnesium had a far more profound impact on the aerosol surface tension than the ammonium. It may lead to the surface tension differences between ammonium nitrate and magnesium nitrate aerosol. More comparisons between literature works and this work can be seen in Section S4 (Supporting information).
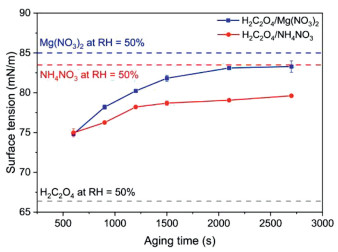
Fig. 3 illustrates the variation of surface tension of aging aerosols composed of organic/inorganic mixture obtained by the DLT-RS system. At a constant RH value (RH = 50%), pairs of ammonium nitrate/oxalic acid or magnesium nitrate/oxalic acid droplets were retained in the optical traps for desired times ranging from 600 s to > 2500 s before being induced to coalescence. The measured surface tensions of aerosols with different aging extents shown in Fig. 3 exhibit a clear elevating tendency. It has been reported that an unconventional displacement reaction, i.e., the nitrate depletion, may happen in aging nitrate aerosols where organic acid reacted with the nitrate to produce carboxylate and gaseous nitric acid [63,64]. The proton has a stronger surface affinity than ammonium, thus the depletion of proton in aerosol aging may lead to the increase of its surface tension. Notwithstanding, the curves of surface tension leveled off at aging time > 1800 s, culminating in an asymptotic value lower than the surface tension value of pure aqueous nitrate. It indicates that the displacement reaction during aerosol aging cannot reach completion. Meanwhile, the depletion of nitrate also increased the relative concentration of carboxylate, which may reduce the surface tension. The competition between the ramifications of nitrate depletion and proton depletion resulted in a breakdown in the sustained growth of surface tension. Moreover, the variation rate of surface tension of magnesium nitrate/oxalic acid aerosols was higher than that of ammonium nitrate/oxalic acid aerosols; the terminal surface tension value of the former was also higher than that of the latter. It indicated that magnesium nitrate/oxalic acid aerosols had a higher aging rate and extent.
Figure 3
Figure 3.
Surface tensions of aerosols composed of ammonium nitrate/oxalic acid or magnesium nitrate/oxalic acid as a function of aerosol aging time. The experiment was conducted at 294.51 ± 0.86 K and RH = 50%. Blue solid point: measurement data of magnesium nitrate/oxalic acid aerosols; red solid point: measurement data of ammonium nitrate/oxalic acid aerosols; gray dashed line: surface tension of bulk aqueous oxalic acid solution at RH = 50%, from Boyer et al. [27] and Booth et al. [70]; red dashed line: surface tension of bulk aqueous ammonium nitrate solution at RH = 50%; blue dashed line: surface tension of bulk aqueous magnesium nitrate solution at RH = 50%. The uncertainties are the standard deviations resulting from averaging multiple measurements.
Sea spray aerosols (SSAs) are the largest source of atmospheric particulate matter, which significantly affect climate, regional air quality, and human health. Organic acids account for a large fraction of SSAs, which contribute to ~34% of annual global SSA emission [65–67]. The formic acid, acetic acid, and oxalic acid are three main organic acids in SSAs, the concentrations of which can be up to 14.5 µmol/L, 20.4 µmol/L, and 13.7 µmol/L, respectively [68]. Song et al. [69] found that for SSAs containing organic acids with < 5 carbons, such as acetic acid, butyric acid, etc., their surface tensions were similar and were close to the seawater. However, for SSAs containing organic acids with > 5 carbons, such as heptanoic acid and octanoic acid, their surface tensions profoundly decreased with the increase of chain length.
Considering the measured surface tensions of aging aerosols here, one can deduce that SSAs composed of short-chain organic acids are easier to age and produce more organic acidic salts compared with that composed of long-chain organic acids. The organic acidic salts have higher surface tensions than the organic acids [70]. Thus, SSAs containing organic acids with < 5 carbons may have higher surface tensions. It provides a possible explanation to the results of Song et al. [69].
In summary, we herein directly measured the surface tension of single aerosol droplets (PM10 particles) via a self-developed dual laser tweezers Raman spectroscopy system. The results of ammonium nitrate and magnesium nitrate aerosols showed that the measurements of single particle phase agreed well with bulk measurements at high RH range (90%-100%), while the discrepancy increased at low RH range because of the supersaturated states of the aerosols. It underscores the necessity of direct surface tension measurements of single particle phase. Besides, the results of aging aerosols composed of ammonium nitrate/oxalic acid or magnesium nitrate/oxalic acid showed that with the progression of aging, the surface tension of the aerosols changed, which coincided with the dynamic surface tensions found in ambient aerosols [9,10]. It indicated that an unconventional reaction occurred in aerosol aging process which can be characterized as a displacement of a strong acid (nitric acid) by a weak acid (organic acid).
Declaration of competing interest
The authors declare that there is no interest for this manuscript.
Acknowledgment
This work was supported by the National Natural Science Foundation of China (Nos. U19A2007, 32150026 and 92043302).
Supplementary materials
Supplementary material associated with this article can be found, in the online version, at doi:10.1016/j.cclet.2023.109062.
[1]
M. Hallquist, J.C. Wenger, U. Baltensperger, et al., Atmos. Chem. Phys. 9 (2009) 5155–5236. doi: 10.5194/acp-9-5155-2009
[2]
A. Mellouki, T.J. Wallington, J. Chen, Chem. Rev. 115 (2015) 3984–4014. doi: 10.1021/cr500549n
A.M. Booth, D.O. Topping, G. McFiggans, et al., Phys. Chem. Chem. Phys. 11 (2009) 8021–8028. doi: 10.1039/b906849j
Figure 1
A coalescence event of aerosols composed of ammonium nitrate. (A) Time course of coalescence process of droplets (bright-field image). Ⅰ~Ⅳ are the representative stills of the coalescence process. Ⅰ: the trapped droplets after equilibrating with surrounding gas vapor. Ⅱ: the droplets just before coalescence. Ⅲ: droplet in the middle of coalescence. Ⅳ: droplet after coalescence. Time = -∞ means the droplets have equilibrated to the surrounding moisture and are ready to collide. Time = ∞ means the composited droplet return to a sphere after morphology distortion. (B) The recorded intensity of elastic backscattering light during the coalescence process. The sampling frequency is 200 MHz. Time = 0 indicates the onset of the coalescence. (C) Detail view of the signal labelled by red dashed rectangle frame in B. (D) Fast Fourier transform of the signal in C. The frequency of the shape oscillation is derived.
Figure 2
RH-dependent surface tension of aerosols composed of ammonium nitrate or magnesium nitrate. (A) Surface tension of ammonium nitrate aerosol. Red solid point: this work, single particle measurements; blue hollow diamond, Mosallanejad et al. [58], bulk measurements; green hollow inverted triangle, Tuckermann [59], bulk measurements. (B) Surface tension of magnesium nitrate aerosol. Red solid point: this work, single particle measurements; blue hollow triangle, Matubayasi et al. [60], bulk measurements; green hollow square, Minofar et al. [61], bulk measurements. The uncertainties are the standard deviations resulting from averaging multiple measurements. The experiment was conducted at 294.26 ± 0.71 K.
Figure 3
Surface tensions of aerosols composed of ammonium nitrate/oxalic acid or magnesium nitrate/oxalic acid as a function of aerosol aging time. The experiment was conducted at 294.51 ± 0.86 K and RH = 50%. Blue solid point: measurement data of magnesium nitrate/oxalic acid aerosols; red solid point: measurement data of ammonium nitrate/oxalic acid aerosols; gray dashed line: surface tension of bulk aqueous oxalic acid solution at RH = 50%, from Boyer et al. [27] and Booth et al. [70]; red dashed line: surface tension of bulk aqueous ammonium nitrate solution at RH = 50%; blue dashed line: surface tension of bulk aqueous magnesium nitrate solution at RH = 50%. The uncertainties are the standard deviations resulting from averaging multiple measurements.

 DownLoad:

 下载:
下载:


 下载:
下载:
