Figure 1.
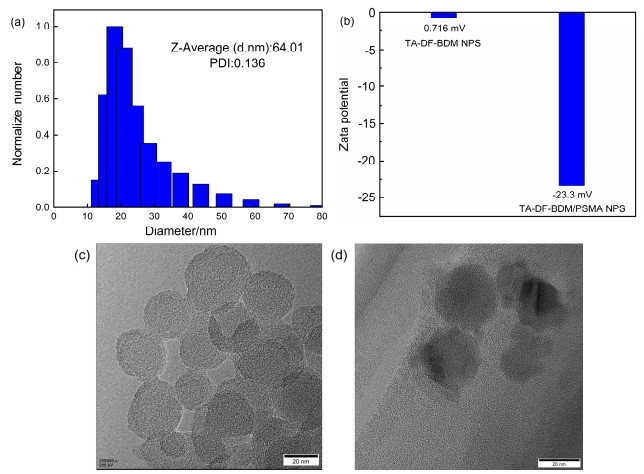
(a) DLS of TA-DF-BDM/PSMA NPs in aqueous solution, (b) comparison of zeta potentials of TA-DF-BDM NPs and TA-DF-BDM/PSMA NPs in aqueous solution, (c) TEM image of TA-DF-BDM NPs, and (d) TEM image of TA-DF-BDM/PSMA NPs
Hydrophilic Fluorescent Probes for Fe3+ Ions Based on Nanoparticles of Twisting D-π-A Type Compound Derived from Benzylidenemalononitrile
Xing Liu , Peng Tao , Jingjing Yang , Wen Liu , Hua Wang , Xuening Wang , Qiang Zhao , Wai-yeung Wong , Bingshe Xu

As one of the most essential elements in biological systems of human body, the Fe3+ ions perform crucial role in oxygen carrying capacity and act as a cofactor in many enzymatic electron transfer as well as oxidation reactions[1, 2]. One hand, deficiency in Fe3+ ions could cause degradation of oxygen transportation in cells, especially in anemia, liver damage, diabetes, and cancers.[3~5] The other hand, excessive accumulation of Fe3+ ions in cells causes a Fenton reaction, resulting in generation of reactive oxygen species (ROS) which is the major aetiological factors for Alzheimer's disease or Parkinson's disease.[6~8] Thus, the qualitative and quantitative analysis of Fe3+ ions is of great significance in clinical medical applications.[9]
At present, conventional detection methods of Fe3+ ions include voltammetry, atomic absorption spectrometry and inductively coupled plasma mass spectrometry.[10~13] How- ever, these methods suffer from such problems as destruction of testing samples and interference by other ions during testing. Recently, fluorescent probe technology has been considered as one of the most effective detection methods of microelements in human body due to good selectivity, high sensitivity, low detection limits, capability of both in vitro and in vivo detections and facile instrument operability.[14~17] Especially, the rapid development in confocal fluorescence microscopy and optical imaging push forward the application process of fluorescent probe technology in biomedical field.
Till now, many kinds of fluorescent probes for Fe3+ ions have been reported. For example, the rhodamine derivate fluorescent probes, benzimidazoquinoline derivate fluorescent probes, benzimidazole derivate fluorescent probes.[18~20] However, current fluorescent probes for Fe3+ions are limited by several disadvantages, e.g. small Stokes shift, poor performance for detections in pure water, and worse interference immunity of other ions. For example, the cross-sensitivity of Cu2+ and Al3+ ions during the Fe3+ ions detection is very difficult to eliminate, which is owing to analogous ion size of Fe3+ ions.[6, 21] In addition, the working medium of current fluorescent probes for Fe3+ions is usually mainly composed of organic solvents, which can damage microorganisms, destroy cellular structure functional integrity, inhibit cell growth and even lead to cell death.[22] Hence, it is necessary for designing and preparing hydrophilic fluorescent probe for Fe3+ ions with high selectivity. Furthermore, the reversibility ability of the fluorescent probes is one of the important properties for Fe3+ ions detection applications. Hence, it is necessary for designing and preparing hydrophilic and reversible fluorescent probe with high selectivity.
Herein, we report a novel reversible fluorescent probe for detection of Fe3+ ions, which is composed of nanoparticles derived from fluorescence material of TA-DF-PDM. It exhibits high selectivity for Fe3+ ions in pure water, high sensitivity with detection limit of 0.9833 μmol/L, excellent biocompatibility and low cytotoxicity.
The diameter distributions of TA-DF-BDM/PSMA NPs were characterized by dynamic light scattering (DLS). As shown in Figure 1a, the average diameter of TA-DF- BDM/PSMA NPs is estimated to be 64 nm. And, the morphology of the TA-DF-BDM/PSMA NPs in aqueous solution was observed by transmission electron microscope (TEM). As expressed in Figures 1c and 1d, the grain shape of TA-DF-BDM/PSMA NPs is nearly sphere with average diameter of about 50 nm, which is slightly smaller than that obtained using DLS method. It is because that hydrodynamic diameter of the nanoparticles measured by DLS is usually larger than their size obtained by TEM.[23] Furthermore, the DPI data (0.136) exhibits good hydrophilicity and dispersibility, which retain absence of nanoparticles aggregation in water even after being stored for months. In addition, the zeta potential of the TA-DF-BDM/ PSMA NPs was -23.3 mV (Figure 1b). For comparison, the PSMA-free TA-DF-BDM NPs was also prepared, which exhibited the zeta potential of -0.716 mV. It is suggested that the PSMA successfully incorporated into TA-DF- BDM and formed stable nanoparticles of TA-DF-BDM/ PSMA NPs.
The molecule of TA-DF-BDM is constructed with twi- sting D-π-A configuration, in which triphenylamine (TA), 9, 9-dioctylfluorene (DF) and benzylidenemalononitrile (BDM) serve as electron donor (D) unit, π conjugated unit, and electron acceptor (A) unit, respectively. TA-DF-BDM realizes blue-light emission by charger transfer from D unit of TA to A unit of BDM. As shown in Figure 2a, the UV-vis absorption spectrum of TA-DF-BDM exhibits absorption band at 350~420 nm, which attributes to charge transfer from TA to BDM. It induces in blue-light emission peak (λPL) located at 450 nm in PL spectrum of TA-DF- BDM. But, it can be found that the UV-vis absorption spectrum and PL spectrum of TA-DF-BDM show rather bigger overlap, which lead to self-absorption phenomenon. Additional, due to smaller Stokes shifts (ca. 26 nm), the blue-light emission of TA-DF-BDM will easily be interfered with background noise from excitation source during fluorescence imaging.[23~25]
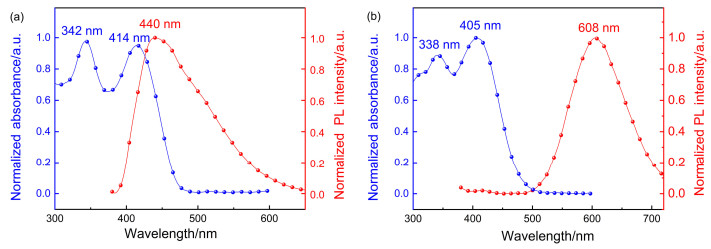
To solve above problem, the TA-DF-BDM/PSMA NPs were fabricated by reprecipitation method. It was known that the nanoparticles of fluorescence molecules can lead to bigger red-shift of emission peak relative to fluorescence molecules, owing to molecular accumulation. So, it can be seen from Figure 2b that the λPL of TA-DF-BDM/ PSMA NPs shows bathochromic shift from 450 nm to 608 nm, which separates with its UV-vis absorption spectrum totally. It expresses rather larger Stokes shifts (ca. 210 nm).[24] Furthermore, the TA-DF-BDM/PSMA NPs were fabricated by reprecipitation method, which will also improve hydrophilicity and dispersibility for satisfying requirement for biological measurement environment.
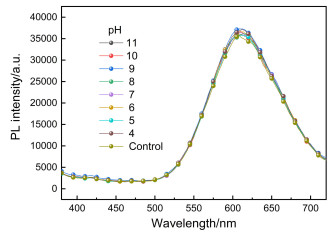
The pH values of different human organisms are quite different, which range from weak acidic in the lysosome and endosome (pH=4.7~6.5) to weak basic in active mitochondria (pH=8.0).[25] Hence, the photophysical properties TA-DF-BDM/PSMA NPs need to be stable in measurement scenes with different pH value. For testifying it, the PL spectra of TA-DF-BDM/PSMA NPs in solutions with different pH value were recorded. As shown in Figure 3, the PL spectra of TA-DF-BDM/PSMA NPs show no variation with increasing pH values from 4 to 11, for example, the λPL and emission intensity. It is indicated excellent photophysical stability of TA-DF-BDM/PSMA NPs in different pH value [26].
Selectivity is an essential prerequisite to evaluate a fluorescent probe before its practical application. To evaluate selectivity of TA-DF-BDM/PSMA NPs for Fe3+ ions, the PL spectra of TA-DF-BDM/PSMA NPs in aqueous solutions with presence of common environmental metal ions (i.e. Fe3+, Zn2+, Ag2+, Fe2+, Co2+, Na+, Pb2+, Hg2+, Ni2+, Cd2+, Mn2+, Ba2+, Cu2+, Mg2+, Ca2+, K+, Al3+) were recorded, respectively.[22, 29]
The UV absorbance spectra of TA-DF-BDM/PSMA NPs (10 μmol/L) in the presence of different metal ions (1 equiv.) in aqueous solution were shown in Figure 4a. It is obvious that, in the absorption peaks, there was no evident change except for Fe3+ ions. As shown in Figure 4b, the λPL located at around 610 nm corresponding to red emission of TA-DF-BDM/PSMA NPs is nearly vanished upon addition of Fe3+ ions, which distinguishes with other ions. Hence, it is can be drawn that only Fe3+ ions can quench red-emission of TA-DF-BDM/PSMA NPs, however, other metal ions including Cu2+ ions exhibit no quenching phenomenon. It is suggested that TA-DF-BDM/PSMA NPs possess excellent selectivity for detecting Fe3+ ions in potential.
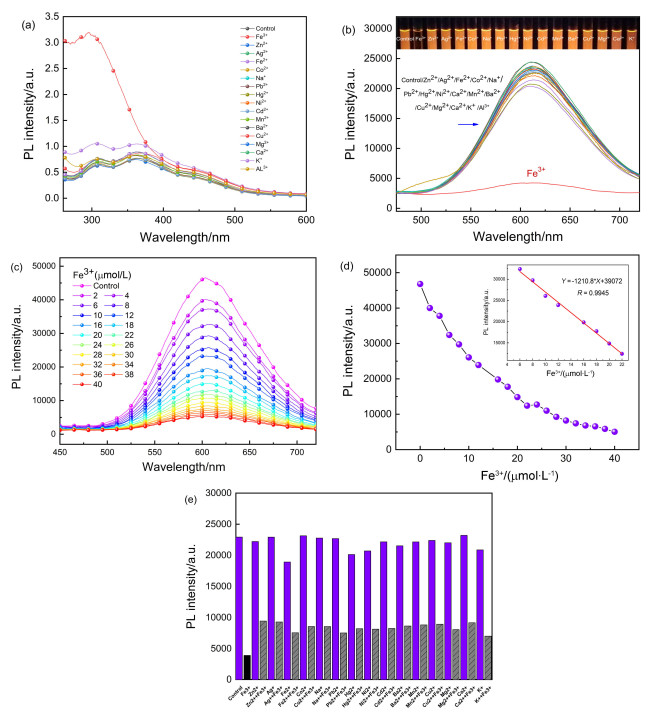
Furthermore, the fluorescence quenching behavior of Fe3+ ions was studied using fluorescence titration at fixed concentration of TA-DF-BDM/PSMA NPs with varying concentrations of Fe3+ ions. As expressed in Figure 4c, the PL intensity of red emission peak of TA-DF-BDM/PSMA NPs degrades with increasing Fe3+ ions concentration, which is almost fully quenched when the concentration of Fe3+ ions rises above 40 μmol/L. Under low concentrations of Fe3+ ions (6~22 μmol/L), the PL intensity of emission peak decreases rapidly and exhibits good linear (R=0.9945) relationship with concentrations of Fe3+ ions (Figure 4d). Hence, it is deduced that TA-DF-BDM/ PSMA NPs can act as fluorescent probe for quantitative detection of microscale Fe3+ ions. And, the detection limit was calculated from the equation DL=3δ/k, where δ is the standard deviation of the blank measurement and k is the slope between emission peak intensity versus Fe3+ ions concentration. The detection limit of TA-DF-BDM/PSMA NPs for Fe3+ ions is 0.9833 μmol/L.
To investigate the interference of other metal ions, Fe3+ions were detected by TA-DF-BDM/PSMA NPs in presence of different ions. The PL spectra of TA-DF-BDM/ PSMA NPs were further measured in complicated systems in the presence of Fe3+ ions mixed with 1.00 equiv. of Fe3+, Zn2+, Ag2+, Fe2+, Co2+, Na+, Pb2+, Hg2+, Ni2+, Cd2+, Mn2+, Ba2+, Cu2+, Mg2+, Ca2+, K+, Al3+ ions, respectively. As shown in Figure 4e, when other ions were added, the PL intensity of emission peak at 610 nm did not change much. The PL intensity decreased obviously after dropping of Fe3+ ions. To investigate the effect of pH on Fe3+detection, furthermore, we test the change of the solution fluorescence intensity adding the Fe3+ under variety of the pH. All these results confirm that the detection of TA-DF-BDM/PSMA NPs to Fe3+ions is exclusive, which possesses a potential to be applied in practice.
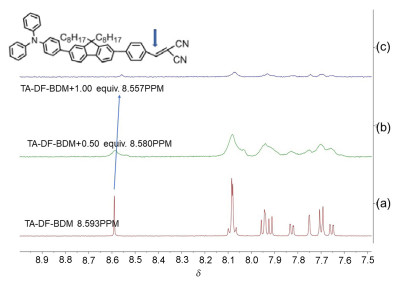
The Fe3+ ion is a type of paramagnetic metal ion, and its complex with TA-DF-BDM can affect the proton signals close to the Fe3+ binding site. As shown in Figure 5, the data revealed that proton signal of Ha at δ 8.589 shifted upfield to δ 8.550 and became board after the addition of 1.00 equiv. of Fe3+ ions. This might be attributed to coordination reaction between Fe3+ions and malononitrile of BDM unit in TA-DF-BDM, which can frustrate twisting D-π-A configuration and restrain emission originating from charge transfer from TA to BDM.[27]
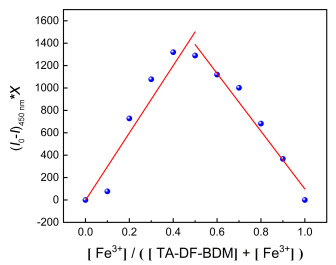
To determine the stoichiometry of TA-DF-BDM and Fe3+ ion, Job's method was employed. A series of mixture solutions of TA-DF-BDM and Fe3+ ion with various molar fractions were prepared by keeping the total TA-DF- BDM and Fe3+ ion concentration constant of 10 μmol/ L.[28, 29] The PL in intensity of emission peak at 450 nm was recorded for each solution. As expressed in Figure 6, it was found that the maximum PL intensity was observed when the molar fraction of Fe3+ ions reached 0.48, indicating that 1:1 stoichiometry for the complex of TA-DF-BDM to Fe3+ ions. It is owning to coordination reaction between Fe3+ ions with malononitrile of BDM unit.
[TA-DF-BDM]+[Fe3+]=10 μmol/L. X is the molar fraction of TA-DF-BDM, I0 and I indicate the emission intensity at 450 nm before and after addition of Fe3+ ions, respectively
The 200 μL of aqueous solution of Fe3+ ions with concentration of 10 μmol/L was injected into aqueous solution of TA-DF-BDM/PSMA NPs (names as Solution S-NP) to acquire solution S-NP-Fe. By comparing with PL spectra of solutions of S-NP and S-NP-Fe in Figure 7a, it can be found that the emission peak located at 610 nm corresponding to TA-DF-BDM/PSMA NPs vanished after injection of Fe3+ ions, which had been identified as above work. Then, 200 μL of L-ascorbic acid aqueous solution with concentration of 0.28 μmol/L was injected into solution S-NP-Fe to acquire solution S-NP-Fe-LAA. Then, it was observed that the emission peak located at 610 nm appeared again after injection of L-ascorbic acid. So, it is suggested the TA-DF-BDM/PSMA NPs have good reversibility of fluorescence probes for detection of Fe3+ ions. According to the reversibility of the fluorescent probe, it can be expected that composite probe of solution S-NP-Fe can also be used to detect L-ascorbic acid qualitatively and quantitatively as expressed in Figure 7b.
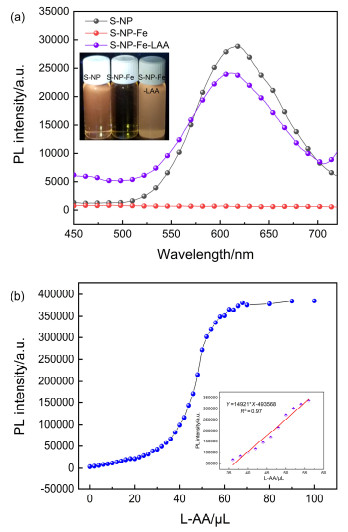
Inset: the relationship between emission peak intensity and LAA concentration
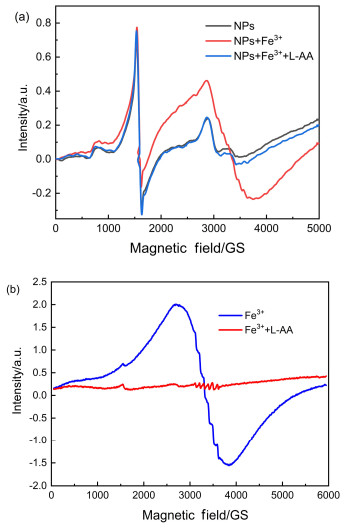
For understanding the fluorescence reversibility, electron paramagnetic resonance (EPR) tests were carried on TA-DF-BDM/PSMA NPs.[30] As shown in Figure 8a, the EPR spectrum of solution S-NP-Fe exhibits a strong paramagnetic signal in the area of 2500~3500 GS, due to paramagnetic effect Fe3+ ions. However, solution S-NP- Fe-LAA shows weaker paramagnetic signal. Upon addition of L-ascorbic acid, the paramagnetic signal of Fe3+ ions is weakened. It is because that L-ascorbic acid is a strong reducing agent that leads to transformation from Fe3+ ions to Fe2+ ions (as shown in Figure 8b).
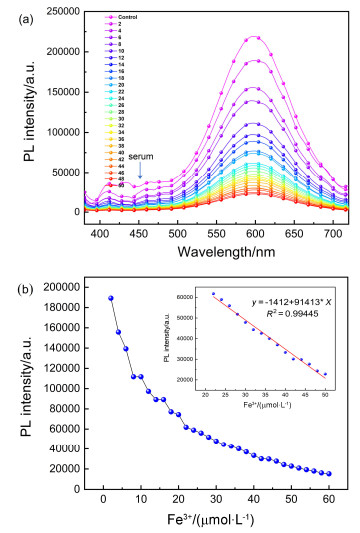
For evaluating the feasibility of TA-DF-BDM/PSMA NPs for detection Fe3+ ions in complex biological environment, the chemosensory based on TA-DF-BDM/PSMA NPs was challenged by human serum.[31] After human serum samples were centrifuged and removed the protein precipitate, the supernatant was diluted 100-fold with Tris- HCI buffer (10 mmol/L, pH=7.19). Then, 150 μL of aqueous solution containing TA-DF-BDM/PSMA NPs (20 μmol/L) and different concentration of Fe3+ ions dropped in 150 μL of diluted human serum. The PL spectra of testing sample were measured and the fluorescence titration curve was fitted. As shown in inset of Figure 9b, the unknown concentration of Fe3+ ions was obtained according to the relationship between the PL intensity of emission peak at 610 nm and concentration of Fe3+ ion. It can be seen from Table 1 that the recovery is in the range of 94.9%~108.2% and the relative standard deviation (RSD, n=5) is less than 3.5%, indicating high analytical precision of TA-DF-BDM/PSMA NPs.
 下载:
导出CSV
下载:
导出CSV
| No. | Added/(μmol•L-1) | Found/(μmol•L-1) | Recovery/% | RSD/% |
| 1 | 10 | 10.83 | 108.2 | 2.9 |
| 2 | 20 | 19.35 | 96.7 | 3.5 |
| 3 | 26 | 24.68 | 94.9 | 1.8 |
| 4 | 50 | 50.19 | 100.4 | 1.2 |
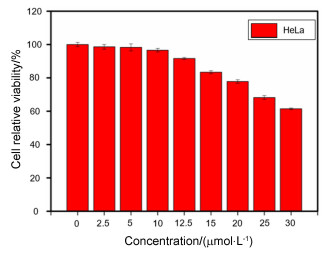
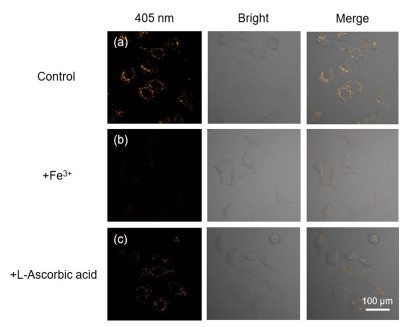
The toxicity of TA-DF-BDM/PSMA NPs is a natural concern because of its potential for bioimaging. The cytotoxicity of TA-DF-BDM/PSMA NPs was evaluated by 3-(4, 5-dimethylthiazol-2-yl)-2, 5-diphenyltetrazolium bromide (MTT) assays using HeLa cells at various concentration for 24 h.[27] In Figure 10, the results show that TA-DF-BDM/PSMA NPs is nontoxic to the cultured cells under the experimental conditions. We also used HeLa cells as model cells to study the subcellular distributions of TA-DF-BDM/PSMA NPs by confocal fluorescence microscopy. Herein, cultured HeLa cells were incubated with TA-DF-BDM/PSMA NPs (10 μmol/L) for 30 min under 37 ℃. As predicted, confocal fluorescence microscopy images showed that TA-DF-BDM/PSMA NPs with fluorescence were cell membrane permeable as shown in Figure 11. In a control experiment, the cells were pretreated with TA-DF-BDM/PSMA NPs for 30 min, and further incubated with Fe3+ (10 μmol/L) for 30 min, eliciting an obvious fluorescence decrease in the range of 550~650 nm, in agreement with the Fe3+ ions induced fluorescence response. The L-ascorbic acid was added to the cells incubate for 30 min, and the fluorescence reversibility is at 550~650 nm.
The reversible fluorescent probe for Fe3+ ions is pre- pared, i.e. TA-DF-BDM/PSMA NPs which is composed of nanoparticles based on fluorescence material of TA-DF- BDM. In this work, the fluorescence material of TA-DF- BDM was synthesized by Suzuki coupling reaction firstly, which was made into nanoparticles by reprecipitation method to acquire TA-DF-BDM/PSMA NPs. The spectral properties of TA-DF-BDM/PSMA NPs were discussed in detail. This fluorescence probe based on TA-DF-BDM/ PSMA NPs exhibited such properties as red emission (λPL=610 nm), larger Stokes shift (210 nm), excellent photophysical stability in different pH value, good selectivity, low detection of Fe3+ ions (0.9833 μmol/L) in pure water. In PL spectra, the PL intensity of red emission peak of TA-DF-BDM/PSMA NPs degrades with increasing Fe3+ ions concentration. It is attributed to coordination reaction between Fe3+ ions and malononitrile of BDM unit in TA-DF-BDM, which can frustrate the twisting D-π-A configuration and restrain red-emission originating from charge transfer from TA to BDM. Additionally, TA-DF- BDM/PSMA NPs have good reversibility of fluorescence probes for detection of Fe3+ ions. By human serum measurements and cellular imaging, it can be found that TA- DF-BDM/PSMA NPs shows high analytical precision, good biocompatibility and low cytotoxicity. Above all, TA-DF-BDM/PSMA NPs exhibits a huge potential to be applied in biomedical practice.
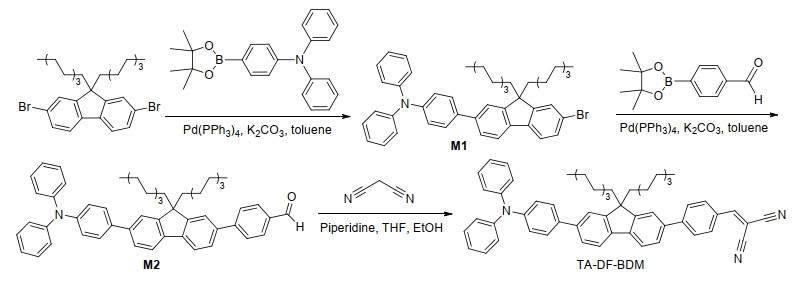
All reagents and organic solvents were purchased from commercial chemical reagent company and used without further purification. The synthetic route of TA-DF-BDM is shown in Figure 12.
The triphenylamine 4-borate (0.371 g, 1 mmol) and 9, 9- dioctyl-2, 7-dibromofluorene (1.192 g, 2 mmol) were dissolved in 15 mL of toluene, and K2CO3 aqueous solution (2 mol/L, 10 mL) was dropped into it. Then, tetrakistriphenylphosphine palladium (Pd(PPh3)4) (0.057 g, 0.05 mmol) was added into above reaction mixture. After refluxing for 4 h under nitrogen protection, the reaction mixture was poured into water and extracted with dichloromethane. The collected organic layer was dried over anhydrous MgSO4 and concentrated under reduced pressure. Finally, the resultant residue was purified by silica gel column chromatography using mixture eluents of ethyl acetate and hexane (V:V=1:20) to afford M1 as intermediate product, 0.3123 g, 74.2% yield. 1H NMR (600 MHz, DMSO-d6)δ: 7.86 (d, J=7.9 Hz, 1H), 7.77 (d, J=8.1 Hz, 1H), 7.72 (d, J=1.3 Hz, 1H), 7.64 (ddd, J=16.5, 10.7, 8.7 Hz, 4H), 7.51 (dd, J=8.0, 1.8 Hz, 1H), 7.36~7.29 (m, 4H), 7.10~7.02 (m, 8H), 2.04 (tt, J=13.3, 8.3 Hz, 4H), 1.25~0.95 (m, 20H), 0.75 (t, J=7.2 Hz, 6H), 0.49 (s, 4H). Anal. cald for C47H54BrN: C 79.22, H 7.59, Br 11.22, N 1.97; found C 79.17, H 7.72, Br 11.22, N 1.97.
The intermediate product of M1 (0.381 g, 0.5 mmol) and 4-acylphenylboronic acid (0.234 g, 1 mmol) were dissolved in 15 mL of toluene, which mixed with K2CO3 aqueous solution (2 mol/L, 10 mL). Then, Pd(PPh3)4 (0.057 g, 0.05 mmol) was added into reaction mixture, which was been refluxing overnight under nitrogen protection. Then, the resulting mixture was poured into water and extracted with dichloromethane. The collected organic layer was dried over anhydrous MgSO4 and concentrated under reduced pressure. Finally, the resultant residue was purified by silica gel column chromatography using ethyl acetate and hexane (V:V=1:15) as eluents to afford M2 as intermediate product, 0.2308 g, 60.6% yield. 1H NMR (600 MHz, CDCl3) δ: 10.08 (s, 1H), 8.00~7.96 (m, 2H), 7.85~7.82 (m, 2H), 7.81~7.75 (m, 2H), 7.64 (dd, J=7.9, 1.7 Hz, 1H), 7.61~7.54 (m, 5H), 7.30~7.27 (m, 3H), 7.26 (d, J=4.3 Hz, 1H), 7.20~7.13 (m, 6H), 7.04 (tt, J=7.5, 1.1 Hz, 2H), 2.08~1.98 (m, 4H), 1.21~1.00 (m, 20H), 0.78 (t, J=7.2 Hz, 6H), 0.70 (t, J=10.6 Hz, 4H). Anal. cald for C54H59NO: C 87.92, H 8.01, N 1.90, O 2.17; found C 87.75, H 8.12, N 1.90, O 2.17.
The intermediate product of M2 (0.246 g, 0.33 mmol) and malononitrile (0.066 g, 1 mmol) were dissolved into mixture solution of absolute ethanol (15 mL) and tetrahydrofuran (THF) (5 mL). The reaction mixture was keeping refluxing for 3 h. Then, the solvent was concentrated under reduced pressure. Finally, The resultant residue was purified by silica gel column chromatography using ethyl acetate and hexane (V:V=1:15) as eluents to afford TA- DF-BDM as yellow solid powder 0.2206 g, 69.7% yield. m.p. 166.2~168.6 ℃; 1H NMR (600 MHz, CDCl3) δ: 8.02 (d, J=8.4 Hz, 2H), 7.85 (t, J=8.3 Hz, 2H), 7.81 (t, J=3.9 Hz, 2H), 7.78 (d, J=7.9 Hz, 1H), 7.65 (dd, J=7.9, 1.7 Hz, 1H), 7.62~7.54 (m, 5H), 7.31~7.26 (m, 4H), 7.17 (ddd, J=9.7, 7.6, 1.5 Hz, 6H), 7.07~7.03 (m, 2H), 2.04 (dd, J=9.7, 6.8 Hz, 4H), 1.19~1.02 (m, 20H), 0.78 (t, J=7.2 Hz, 6H), 0.72~0.64 (m, 4H). Anal. cald for C57H59N3: C 87.13, H 7.51, N 5.35; found C 87.23, H 7.53, N 5.27.
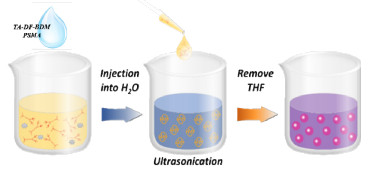
As shown in Figure 13, the TA-DF-BDM/PSMA nanoparticles (named as TA-DF-BDM/PSMA NPs) were prepared by reprecipitation method. First, TA-DF-BDM and PMSA were dissolved into THF to obtain a solution with concentration of 10-3 mol/L. Then, 100 μL of THF solution of TA-DF-BDM and PSMA (5:1, m/m) was added quickly to deionized water (10 mL) during ultrasonication.The THF was removed by heating under nitrogen protection, followed by filtration through a 0.22 μm aqueous phase needle filter. And, the resulting TA-DF-BDM/ PSMA NPs solution was acquired.
The aqueous solutions of FeCl3, Zn(NO3)2, AgNO3, FeCl2•7H2O, CoCl2•6H2O, NaCl, Pb(NO3)2, HgCl2, Ni(NO3)2•6H2O, CdCl2•2.5H2O, MnSO4, BaCl2, CuSO4• 5H2O, MgCl2, CaCl2, KCI, and Al(NO3)3•9H2O with a concentration of 10-3 mol/L were respectively prepared. Before spectral measurement, the high-concentration stock solution was diluted to the concentration required.
The 1H NMR spectra were recorded by an AVANCE 600 MHZ spectrometer. The infrared (IR) absorption spectra were measured using a Bruker TENSOR 27. The average diameter of TA-DF-BDM/PSMA NPs was determined by the dynamic light scattering (DLS, Malvern Zetasizer Nano ZS90). The morphology of TA-DF-BDM/PSMA NPs was investigated by transmission electron microscope (TEM) (JEOL JEM-2010, 200 KV). The ultraviolet-visible (UV-vis) absorption spectra were recorded on a Hitachi U-3900 scanning spectrophotometer. Fluorescence spectra were measured on a HORIBA FluoroMax-4 fluorescence spectrometer, and the fluorescence spectra were all excited by 365 nm.
Cytotoxicity studies on TA-DF-BDM/PSMA NPs were performed using MTT assay. The HeLa Cells (106 cell per mL) were dispersed within replicate 96-well microtiter plates to a total volume of 200 mL/well. The plates were maintained at 37 ℃ in incubator with mixture gas of CO2 and air (V:V=5:95) for 4 h. The TA-DF-BDM/PSMA NPs were diluted to different concentrations with medium and added to each well after removing original medium. HeLa cells were incubated with probe concentrations for 24 h. The concentrations of the TA-DF-BDM/PSMA NPs were 2.5~30 μmol/L, and 200 mL of MTT solution (5.0 mg•mL-1, HEPES) was added to each well. After 4 h, the remaining MTT solution was removed, and 150 mL of DMSO was added into each well to dissolve the formazan crystals. Absorbance was measured at 610 nm in a TRITURUS (Bio-Rad, Model 550) microplate reader.
The HeLa cells were cultured in DMEM medium supplemented with 10% FBS (fetal bovine serum) at 37 ℃ in a humidified environment of 5% CO2. The cells were plated on 6-well plates at 5×10⁴ cells per well and allowed to adhere for 12 h. TA-DF-BDM/PSMA NPs (0.5 μL, 10 μmol/L) were added to the cell medium (500 μL) at 10 mmol/L final concentration. After incubating for 60 min, excess TA-DF-BDM/PSMA NPs were removed by gentle rinsing with cold phosphate buffer saline (PBS, pH=7.4) three times. Then, the cells pretreated with TA- DF-BDM/PSMA NPs were treated with Fe3+ (50 μmol/L) in DMEM medium, incubated for further 30 min at 37 ℃ and washed with PBS buffer. Fluorescence images were collected by sequential line scanning using the Olympus FV1000 confocal laser-scanning microscope. Fluorescence images were recorded at red channels (550~650 nm).
Supporting Information 1H NMR spectrum of M1, M2 and TA-DF-BDM, 13C NMR spectrum of TA-DF-BDM in CDCl3, IR and ESI-MS spectra of TA-DF-BDM. Elements composites of M1 and M2, the high resolution ESI-mass spectrum of TA-DF-BDM, the change of the solution fluorescence intensity adding the Fe3+ ion under variety of the pH and the reducibility of glutathione at different concentrations.
Atchudan, R.; Edison, T. N. J. I.; Aseer, K. R.; Perumal, S.; Karthik, N.; Lee, Y. R. Biosens. Bioelectron. 2018, 99, 303. doi: 10.1016/j.bios.2017.07.076
Li, Y.; Chang, Z. L.; Huang, F.; Wu, P. Y.; Chu, H. C.; Wang, J. Dalton Trans. 2018, 47, 9267. doi: 10.1039/C8DT01145A
Choi, Y. W.; Park, G. J.; Na, Y. J.; Jo, H. Y.; Lee, S. A.; You, G. R.; Kim, C. Sens. Actuators, B 2014, 194, 343. doi: 10.1016/j.snb.2013.12.114
Chen, L.; Wu, C. L.; Du, P.; Feng, X. W.; Wu, P.; Cai, C. X. Talanta 2017, 164, 100. doi: 10.1016/j.talanta.2016.11.019
Kaur, K.; Chaudhary, S.; Singh, S.; Mehta, S. K. Sens. Actuators, B 2016, 232, 396. doi: 10.1016/j.snb.2016.03.076
Ghosh, D.; Luwang, M. N. J. Lumin. 2016, 171, 1. doi: 10.1016/j.jlumin.2015.10.020
Sharma, D.; Kuba, A.; Thomas, R.; Kumar, R.; Choi, H. J.; Sahoo, S. K. Spectrochim. Acta, Part A 2016, 153, 393. doi: 10.1016/j.saa.2015.08.051
Liu, F. J.; Yao, J.; Fan, C.; Zhang, L. Y.; Hua, Y; Zhang. C. X; Song, N.; Kong, Y. J. New J. Chem. 2018, 42, 9676. doi: 10.1039/C8NJ00711J
Lee, M. H.; Kim, J. S.; Sessler, J. L. Chem. Soc. Rev. 2015, 44, 4185. doi: 10.1039/C4CS00280F
Ma, J.; Yu, H. H.; Jiang, X.; Luo, Z. Z.; Zheng, Y. Sens. Actuators, B 2019, 281, 989. doi: 10.1016/j.snb.2018.11.039
Liu, Y. H.; Duan, W. X.; Song, W.; Liu, J. J.; Ren, C. L.; Wu, J.; Liu, D.; Chen, H. L. ACS Appl. Mater. Interfaces 2017, 9, 12663. doi: 10.1021/acsami.6b15746
Rao, L. S.; Tang, Y.; Li, Z. T.; Ding, X. R.; Liang, G. W.; Lu, H. G.; Yan, C. M.; Tang, K. R.; Yu, B. H. Mater. Sci. Eng., C 2017, 81, 213. doi: 10.1016/j.msec.2017.07.046
Wu, S.; Chen, Y.; Sung, Y. Analyst 2018, 99, 303.
Feng, H.; Meng, Q. T.; Wang, Y.; Duan, C. C.; Wang, C. P.; Jia, H. M.; Zhang, Z. Q.; Zhang, R. Chem.-Asian. J. 2018, 13, 2573. doi: 10.1002/asia.201801106
Asanuma, D.; Sakabe, M.; Kamiya, M.; Yamamoto, K.; Hiratake, J.; Ogawa, M.; Kosaka, N.; Choyke, P. L.; Nagano, T.; Kobayashi, H. Nat. Commun. 2015, 6, 6463. doi: 10.1038/ncomms7463
Chhatwal, M.; Kumar, A.; Singh, V.; Gupta, R. D.; Awasthi, S. K. Coord. Chem. Rev. 2015, 292, 30. doi: 10.1016/j.ccr.2015.02.009
Tao, P.; Miao, Y. Q.; Wang, H.; Xu, B. S.; Zhao, Q. Chem. Rec. 2019, 19, 1531. doi: 10.1002/tcr.201800139
Xing, J.; Liu, D.; Zhou, G. X.; Li, Y.; Wang, P.; Hu, K.; Gu, N.; Ji, M. Colloids Surf., B 2017, 160, 265. doi: 10.1016/j.colsurfb.2017.09.026
Liu, Y. M.; Shen, R.; R, J. X.; Yao, X.; Yang, Y.; Liu, H. L.; Tang, X. L.; Bai, D. C.; Zhang, G. L; Liu, W. S. RSC Adv. 2016, 6, 111754. doi: 10.1039/C5RA09758D
Manikandan, I.; Chang, C. H.; Chen, C. L.; Sathish, V.; Li, W. S.; Malathi, M. Spectrochim. Acta, Part A 2017, 182, 58. doi: 10.1016/j.saa.2017.03.055
Jung, H. J.; Singh, N.; Jang, D. O.; Tetrahedron Lett. 2008, 49, 2960. doi: 10.1016/j.tetlet.2008.03.002
Wang, P.; Zhou, D. G.; Chen, B. Spectrochim. Acta, Part A 2019, 207, 276. doi: 10.1016/j.saa.2018.09.029
Feng, X.; Li, Y.; He, X. W.; Liu, H. X.; Zhao, Z.; Ryan, T. K. K.; Mark, R. J. E.; Jaeky, W. Y.; Lam, J. W. Y.; Tang, B. Z. Adv. Funct. Mater. 2018, 28, 1802833. doi: 10.1002/adfm.201802833
Yang, C. C; Zhang, J.; Peng, W. T.; Sheng, W.; Liu, D. Y.; Kuttipillai, P. S.; Young, M.; Donahue, M. R.; Levine, B. G; Borhan, B.; Lunt, R. R. Sci. Rep. 2018, 8, 16359. doi: 10.1038/s41598-018-34442-3
王能, Arulkumar, M., 陈孝云, 王柏文, 陈思鸿, 姚辰, 汪朝阳, 有机化学, 2019, 39, 2771.Wang, N.; Arulkumar, M.; Chen, X. Y.; Wang, B. W.; Chen, S. H.; Yao, C.; Wang, Z. Y. J. Org. Chem. 2019, 39, 2771(in Chinese).
Feng, Z. Y; Tao, P.; Zou, L.; Gao, P. L.; Liu, Y.; Liu, X.; Wang, H.; Liu, S. J.; Dong, Q. C.; Li, J.; Xu, B. S; Huang, W.; Wong, W. Y.; Zhao, Q. ACS Appl. Mater. Interfaces 2017, 9, 28319. doi: 10.1021/acsami.7b09721
Zhang, Z. Y.; Lu, S. Z.; Sha, C. M.; Xu, D. M. Sens. Actuators, B 2015, 208, 258. doi: 10.1016/j.snb.2014.10.136
Wan, Q. Q.; Chen, S. M.; Shi, W.; Li, L. H.; Ma, H. M. Angew. Chem., Int. Ed. 2014, 53, 10916. doi: 10.1002/anie.201405742
Jiang, M. J.; Gu, X. G.; Lam, J. W. Y.; Zhang, Y. L.; Kwok, R. T. K.; Wong, K. S.; Tang, B. Z. Chem. Sci. 2017, 8, 5440. doi: 10.1039/C7SC01400G
Yang, X. D.; Chen, X. L.; Lu, X. D.; Yan, C. G.; Xu, Y. K.; Hang, X. D.; Qu, J. Q.; Liu, R. Y. J. Mater. Chem. 2016, 4, 383.
Wang, L. Y.; Fang, G. P.; Cao, D. R. Sens. Actuators, B 2015, 207, 849. doi: 10.1016/j.snb.2014.10.110
Wu, X. M.; Guo, Z. Q.; Wu, Y. Z.; Zhu, S. Q.; Tony, D. J.; Zhu, W. H. ACS Appl. Mater. Interfaces 2013, 5, 12215. doi: 10.1021/am404491f
Shi, B. F.; Su, Y. B.; Zhang, L. L.; Huang, M. J.; Liu, R. J.; Zhao, S. L. ACS Appl. Mater. Interfaces 2016, 8, 10717. doi: 10.1021/acsami.6b01325

Figure 1 (a) DLS of TA-DF-BDM/PSMA NPs in aqueous solution, (b) comparison of zeta potentials of TA-DF-BDM NPs and TA-DF-BDM/PSMA NPs in aqueous solution, (c) TEM image of TA-DF-BDM NPs, and (d) TEM image of TA-DF-BDM/PSMA NPs

Figure 2 UV-vis absorption spectra and PL spectra (a) TA-DF-BDM in THF; (b) TA-DF-BDM/PSMA NPs in aqueous solution

Figure 4 (a) UV absorbance and (b) PL spectra and photographs under UV lamp (365 nm) of TA-DF-BDM/PSMA NPs (10 μmol/L) in the presence of different metal ions (1 equiv.) in aqueous solution; From left to right are Fe3+, Zn2+, Ag2+, Fe2+, Co2+, Na+, Pb2+, Hg2+, Ni2+, Cd2+, Mn2+, Ba2+, Cu2+, Mg2+, Ca2+, K+ in the illustration; (c) PL spectra of TA-DF-BDM/PSMA NPs (25 μmol/L) exposed to various concentration of Fe3+ ions in aqueous solution; (d) fluorescence titration curve of TA-DF-BDM/PSMA NPs (25 μmol/L) with Fe3+ in aqueous solution, inset: the relationship between emission peak intensity and Fe3+ ions concentration; (e) PL intensity at 610 nm of TA-DF-BDM/PSMA NPs (10 μmol/L) exposed to 1.00 equiv. of various metal ions and mixtures of 1.00 equiv. of Fe3+ with 1.00 equiv. of other metal ions in aqueous solution

Figure 5 1H NMR spectra in DMSO-d6 of (a) TA-DF-BDM, (b) TA-DF-BDM+0.50 equiv. of Fe3+, and (c) TA-DF-BDM+1.00 equiv. of Fe3+

Figure 6 Job's plot of TA-DF-BDM for Fe3+ in aqueous solution
[TA-DF-BDM]+[Fe3+]=10 μmol/L. X is the molar fraction of TA-DF-BDM, I0 and I indicate the emission intensity at 450 nm before and after addition of Fe3+ ions, respectively

Figure 7 (a) Fluorescence reversibility of TA-DF-BDM/PSMA NPs and photographs of TA-DF-BDM/PSMA NPs under UV excitation; (b) fluorescence titration curve of TA-DF-BDM/ PSMA NPs+Fe3+ (10 μmol/L) with LAA in aqueous solution
Inset: the relationship between emission peak intensity and LAA concentration

Figure 8 (a) EPR spectra of solution S-NP-Fe and solution S-NP-Fe-LAA, and (b) EPR spectra of solution S-Fe and solution S-Fe-LAA

Figure 9 (a) PL spectra of TA-DF-BDM/PSMA NPs (10 μmol/ L) exposed to various concentration of Fe3+ ions in human serum; (b) fluorescence titration curve of TA-DF-BDM/PSMA NPs (10 μmol/L) with Fe3+ in human serum, inset: the relationship between PL intensity of emission peak at 610 nm and concentration of Fe3+ ions

Figure 10 Cytotoxicity test of HeLa cells treated with various concentrations of TA-DF-BDM NPs after 24 h

Figure 11 Fluorescence imaging of HeLa cells incubated with TA-DF-BDM/PSMA NPs (10 μmol/L) before (a) or after (b) addition of Fe3+ ions (10 μmol/L) and (c) addition of L-ascorbic acid
Table 1. Testing results for the determination of Fe3+ ions in human serum samples
| No. | Added/(μmol•L-1) | Found/(μmol•L-1) | Recovery/% | RSD/% |
| 1 | 10 | 10.83 | 108.2 | 2.9 |
| 2 | 20 | 19.35 | 96.7 | 3.5 |
| 3 | 26 | 24.68 | 94.9 | 1.8 |
| 4 | 50 | 50.19 | 100.4 | 1.2 |
 下载: 导出CSV

 扫一扫看文章

扫一扫关注我们