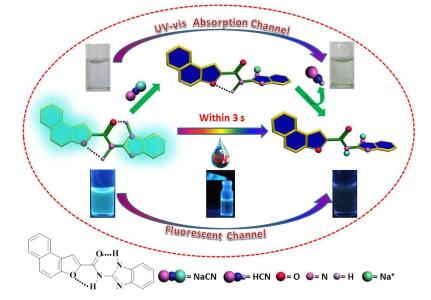
Scheme 1.
Chemical structures and cartoon representations of Q1-2 and cyanide in dimethyl sulfoxide (DMSO)/H2O (V:V=8:2) solutions
Rapid and Highly Sensitive Dual-Channel Detection of Cyanide in Aqueous Medium and the Applications in Food Samples
Wenjuan Qu , Wenting Li , Haili Zhang , Youming Zhang , Qi Lin , Hong Yao , Taibao Wei

The process of efficient fluorescent materials is of great interest in areas of supramolecular chemistry, such as imaging agents and sensors, components of light-emitting diodes, and data recording and storage.[1~8] Serve as an important role in supramolecular chemistry, host-guest interaction study has caused an extensive concern of chemists in recent years.[9~13] Molecular recognition and sensing of anions are major concern because of the roles that anions play in a wide range of biological, environmental, and chemical processes.[14~17] Thus, the development of sensitive anion luminescence sensors continues to be an important field of research.[18~20] Various anions have their different roles and importance. Cyanide is widespread in industrial processes, such as gold mining, metallurgy, electroplating, and the synthesis of fibers and resins, [21, 22] thus, inevitably causing accidental release of cyanide into the environment. The maximum permissive level of cyanide in drinking water is therefore set at 1.9 μmol/L by the World Health Organization (WHO).[23] Due to the great efforts made by the supramolecular scientists, numerous colorimetric and ratiometric cyanide sensors with sensitive and selective detection properties have been developed to date.[24~27] However, the reports concerning the applications in biological and environmental systems for cyanide were still very scarce.[28] Moreover, because cyanide anion is generally present in the aqueous medium in many biological and environmental systems, cyanide sensor which can commonly work in the aqueous medium is given priority. Therefore, the design and synthesis of cyanide sensors that can work well in aqueous medium is badly needed.
Herein, inspired by the fact that highly selective and sensitive detection of cyanide can be achieved through the nucleophilicity of cyanide.[29~31] We designed and synthesized a novel compound (Q1-2) containing amide and imidazole units in its main chain as a highly selective and sensitive cyanide sensor (Schemes 1 and 2). Their anion binding properties were investigated by means of UV-vis, ESI-MS, IR and 1H NMR spectroscopy, as well as naked eyes. The detection limits were determined to be 8.0769×10⁻⁷ mol/L in visible light and 1.0510×10⁻⁹ mol/L under the UV-light for cyanide. Furthermore, the Q1-2 can be used to detect cyanide anion in food samples and the Q1-2-based silica gel plates were prepared which can be used to visually detect cyanide anion as a potential smart stimuli-responsive material in the field of supramolecular chemistry.
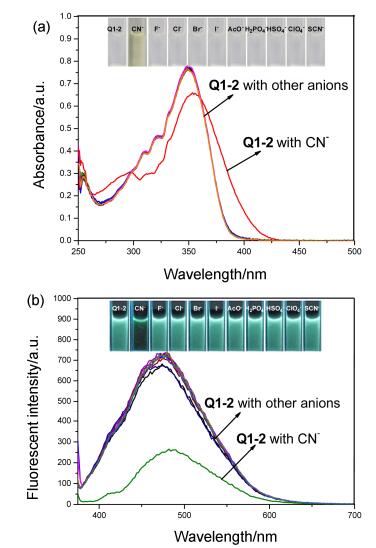
The sensing properties of Q1-2 were examined in DMSO/H2O (V:V=8:2) hydroxyethylpiperazine ethane sulfonic acid (HEPES) solution through the addition of various anions (including F-, Cl-, Br-, I-, AcO-, H2PO4-, HSO4-, ClO4-, SCN- and CN-) (Figure 1). Upon the addition of 50 equiv. of various anions (except for cyanide anion), the absorption spectra of Q1-2 did not show any significant change (Figure 1a). Nevertheless, in the presence of cyanide anion, an absorption bands red shift from 350 nm to 377 nm in the UV-visible spectrum, and there was accompanied by a visible color change from colorless to yellow, which could be clearly distinguished cyanide by the naked eyes. Upon the addition of 50 equiv. of various anions (except for cyanide anion), no substantial change observed in the emission spectra of Q1-2. The only significant response appeared when cyanide was added (Figure 1b), and a weak fluorescence was observed at about 485 nm and the band at 475 nm diminished. Emission spectra red shift mainly caused by the deprotonation of imidazole NH moiety, which lead to negative charge increased in sensor Q1-2, and electronic more beneficially transfer to fluorophore π*-system. Moreover, fluorescence quenching rate obtained according to fluorescence spectrum on the basis of (Fo-Fc)/Fo (Fo: original fluorescence of fluorescent material; Fc: fluorescence after added quenching agent) was 62.94%. The color change from blue-green to a quenched situation could be distinguished by the naked eyes under the UV-lamp. Thus, sensor Q1-2 could be considered as a good ON-OFF cyanide fluorescent switch. The favourable selectivity, preferable detection system and dual-channel detect method of Q1-2 was more remarkable than other systems reported in the literatures.
Inset: photograph showing the change in color of the solution of Q1-2 in DMSO/H2O (V:V=8:2, 20 μmol/L) after addition of cyanide and other anions at room temperature
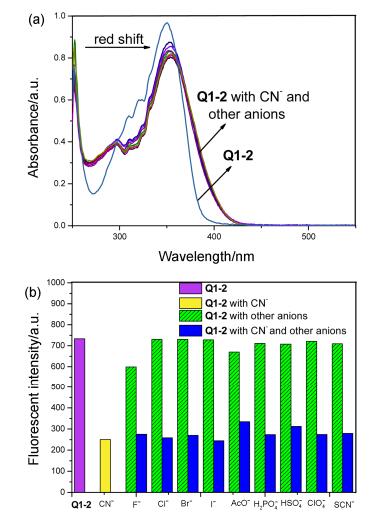
To further explore the utility of Q1-2 as an anion-selective sensor for cyanide, competitive experiments were performed with 50 equiv. of cyanide and 50 equiv. of various other anions (F-, Cl-, Br-, I-, AcO-, H2PO4-, HSO4-, ClO4-, SCN-) in a DMSO/H2O (V:V=8:2) HEPES solution of Q1-2. The absorption spectrum of Q1-2 with cyanide was not significantly influenced by the subsequent addition of competing anions (Figure 2a). Similarly, the obvious switching behavior was not affected even in the presence of all anions together (Figure 2b).
Furthermore, we also researched the sensing properties of Q1-2 toward various cations (including Fe3+, Hg2+, Ag+, Ca2+, Cu2+, Co2+, Ni2+, Cd2+, Pb2+, Zn2+, Cr3+, Mg2+) in DMSO/H2O (V:V=8:2) HEPES solution. Upon the addition of 20 equiv. of various cations, the absorption spectra and fluorescent spectra of Q1-2 did not show any significant selectivity among these cations.
In order to investigate the optimized condition about the sensing behavior of Q1-2 toward cyanide, the UV-vis absorption spectra and fluorescent spectra with different concentrations of cyanide were performed in DMSO/H2O (V:V=8:2) HEPES solution of Q1-2. The incremental addition of cyanide (0~8 equiv.) to a DMSO/H2O (V: V=8:2) HEPES solution of Q1-2 (2×10⁻⁵ mol/L) at room temperature reveals a gradual decrease of the broad absorbance at 350 nm with a significant red shift. At the same time, a new broad band at 390 nm is also noted. This should be attributed to the deprotonation of N—H on imidazole and amide groups, which broke the large π- conjugation system between aminobenzimidazole and naphthofuran fluorophore in sensor molecule. However, no further change is observed in the absorption profile beyond the addition of 8 equiv. of cyanide (Figure 3).
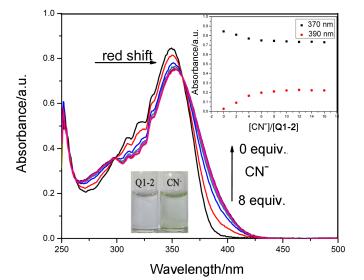
Inset: A plot of absorbance intensity depending on the concentration of cyanide at 370 and 390 nm
Similarly, there is also an obvious variation in fluorescence spectrum during titrations with different concentrations of cyanide in Q1-2 (2×10⁻⁵ mol/L) in DMSO/H2O (V:V=8:2) solution. Q1-2 exhibits a rather strong and broad emission profile with a maximum at 475 nm in DMSO/H2O (V:V=8:2) solution. Nevertheless, the fluorescence emission spectral gradually decreased during titrations with different concentrations of cyanide from 0 to 12 equiv. As a consequence, the emission color changed from blue-green to a quenched situation in the presence of cyanide (Figure 4).
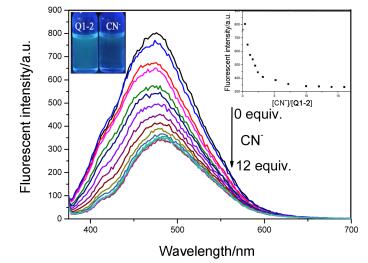
Inset: A plot of fluorescent intensity depending on the concentration of cyanide at 475 nm (λex=365 nm)
Furthermore, to determine the detection limit of Q1-2, the UV-Vis absorption spectral and the fluorescent spectrums of blank tests were measured 15 times and the standard deviation of the blank measurements was determined. The linear fitting were performed according to the titrations curves, and the mean intensity was calculated to determine the slope. The detection limit was calculated using the following equation:
Detection limit=3σ/S
Where σ is the standard deviation of the absorbance and emission intensity of Q1-2 in the presence of cyanide and m is the slope between the absorbance and emission intensity and concentration.
The detection limits of UV-vis absorption spectral and the fluorescent spectrum were 8.0769×10⁻⁷ and 1.0510× 10⁻⁹ mol/L for cyanide, respectively. This data can indicating that the probe can detect cyanide anion at very low concentrations in the environment.
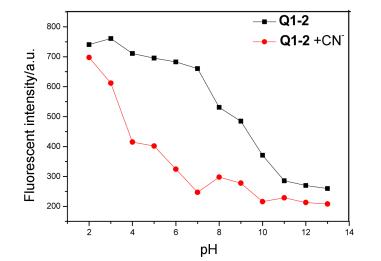
Since the pH value affects the charge distribution of receptor Q1-2 and may change its inherent fluorescence properties, the effect of various pH on the emission intensity of Q1-2 in DMSO/H2O (V:V=8:2) HEPES buffered solution was also studied. As shown in Figure 5, the Q1-2-CN- showed significant fluorescence response in the range of pH 4~9. Meanwhile, with the increasing of pH, the receptor's fluorescent gradually decreased. These results indicate that Q1-2 can detect CN- in a range of pH from 4 to 9.
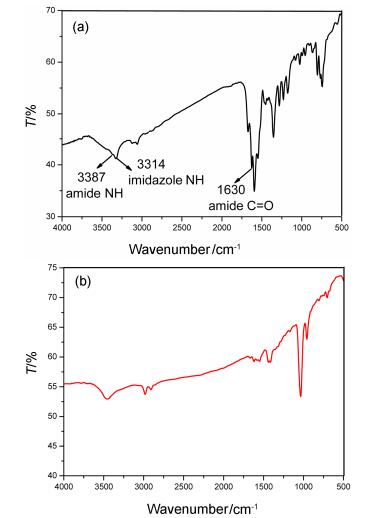
Subsequently, in detail, the recognition mechanism of the sensor Q1-2 with cyanide was investigated by IR spectra, ESI/MS and 1H NMR titration methods. The 1:2 stoichiometry for Q1-2 and NaCN was further confirmed by the appearance of a peak at m/z 372.01, assignable to [Q1-2+2Na+-2H+]+H+ in the ESI/MS. The ESI/MS displayed a peak explain that the deprotonated Q1-2 was coordinated with two sodium ions. IR spectrum of Q1-2 shows two vibration band at 3387 and 3314 cm-1, which can be assigned to stretching vibrational absorption peaks of amide NH and imidazole NH groups in the Q1-2 molecule, respectively. The vibration band at 1630 cm-1 was attributed to the vibration of amide C=O. However, when Q1-2 reacted with cyanide, the stretching vibration absorption peaks of amide NH and imidazole NH groups disappeared at 3387 and 3314 cm-1, which indicated that Q1-2 lost two H proton with the addition of cyanide (Figure 6).
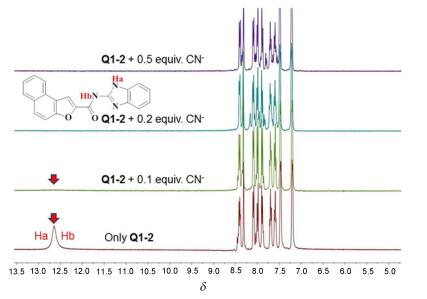
The mechanism of Q1-2 for cyanide sensing was further analyzed accordingly with 1H NMR spectroscopy. Figure 7 shows the 1H NMR of Q1-2 upon the addition of cyanide in a DMSO-d6 solution. Before addition of cyanide in Q1-2, the H proton signal peaks of amide NH and imidazole NH appeared at δ 12.64 at the same time. While after adding 0.1 equiv. of cyanide, the singles of amide NH and imidazole NH at δ 12.64 decreased and rapidly disappeared due to the deprotonation of sensor Q1-2. Also there were without any shift on the original aromatic protons, which was in accordance with previous studies that cyanide could taking the H proton away via deprotonating in the amide NH and imidazole NH moiety of Q1-2 which broke the large π-conjugation system between aminobenzimidazole and naphthofuran fluorophore in sensor molecule.
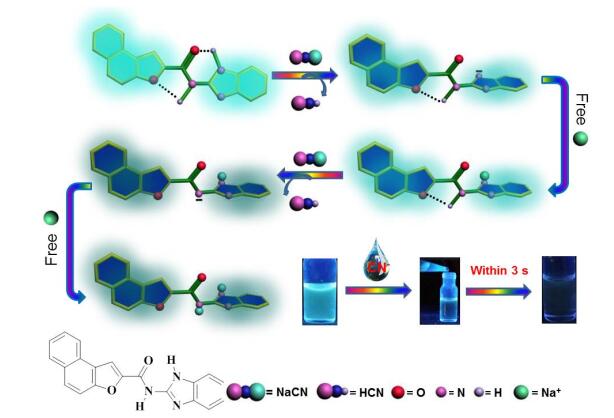
To further visually demonstrate the switching process of the fluorescence signal, a cartoon figure was drawn out in order to show the recognition mechanism. As shown in Figure 8, the strong fluorescence mainly due to the large intramolecular hydrogen bonding between imidazole and acyl group, together with that between amide and furan group in sensor molecule. On this account, this strong fluorescence is assigned to the large π-conjugation system caused by the aminobenzimidazole and naphthofuran fluorophore through intramolecular hydrogen bonding. Afterwards, with the addition of NaCN in the Q1-2 solution, cyanide firstly took the H protons away from imidazole NH moiety and, which broke the intramolecular hydrogen bonding. Thereafter, the free sodium ion coordinated to the negatively charged N atom. After that, another cyanide interaction with amide NH, which further damaged the intramolecular hydrogen bonding and caused the free rotation of the sensor molecular. Then the free sodium ion coordinated to the negatively charged N atom, which destroyed the coplanar molecule. As a result, the fluorescent intensity decreased with the addition of NaCN.
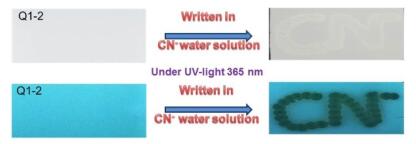
For convenient use in an on-site visual screening analysis, silica gel plates test kits were prepared by silica gel plates into DMSO/H2O (V:V=8:2) solutions of Q1-2 (0.1 mol/L) and then dried in air. For instance, as shown in Figure 9 when we wrote by a brush containing cyanide aqueous solution on the silica gel plate which dipped in Q1-2, a pale yellow mark can be observed in visible light and a brilliant blue-green fluorescent image disappeared under the 365 nm UV-lamp.
With the cyanide sensor in hand, we wondered if we can further use this sensor in daily life food samples. Bitter seed and cherry pit which usually contain cyanide anion in them were selected as the food samples. 100 g of bitter seeds was crushed and pulverized in mortar. Then, 300 mL of water and 0.5 g of NaOH were add into the sample and the obtained mixture was vigorously stirred for 15.0 min. The bitter seeds cyanide-containing solution (BSCS) was obtained by filtration. Furthermore, the cherry pit (100 g) was firstly mashed and soaked in 200 mL water and 100 mL NaOH (125 mmol/L) solution for 2 d. The mixture was then filtered to obtain the cherry pit cyanide-containing solution (SPCS). And then the sensor Q1-2 was used to detect the cyanide anions in the two cyanide containing solutions. As shown in Figure 10 (b), after the addition of the cyanide solution BSCS or BSCS into the solution of Q1-2 (20 μmol/L), the fluorescent emission intensity of the sensor Q1-2 increased rapidly, providing the direct evidence for the detection of cyanide anions in the two different food samples. Furthermore, as shown in Figure 10 (a), the color changes from dim blue to blue-green could be distinguished by the naked eyes under the UV lamp (365 nm), which made the sensor Q1-2 as a visual and convenient detection sensor for cyanide anions in food samples.

A new fluorescent and colorimetric sensor (Q1-2) toward cyanide was designed based on the interactions between cyanide to the amide NH and imidazole NH moiety. The sensor demonstrated some advantages such as good sensitivity and high selectivity for cyanide, low detection limits both in UV-vis absorption spectral and the fluorescent spectrum in DMSO/H2O (V:V=8:2) solution, relative good solubility in aqueous media, rapid naked-eyes response (within 3 s), as well as the successful application in silica gel plates and food samples. The design approach in this work provided some useful information for the development of optical sensors, and suggesting a potential high efficiency application in natural environment.
1H NMR and 13C NMR spectra were recorded on an Agilent DD2 at 600 MHz spectra. 1H chemical shifts are reported in ppm downfield from tetramethylsilane (TMS, δ scale) with the solvent resonances as internal standards). UV-visible spectra were recorded on a Shimadzu UV-2550 spectrometer. Photoluminescence spectra were performed on a Shimadzu RF-5301 fluorescence spectrophotometer. Melting points were measured on an X-4 digital melting-point apparatus. The infrared spectra were performed on a Digilab FTS-3000 FT-IR spectrophotometer.
Fresh double distilled water was used throughout the experiment. All other reagents and solvents were commercially available at analytical grade and were used without further purification.
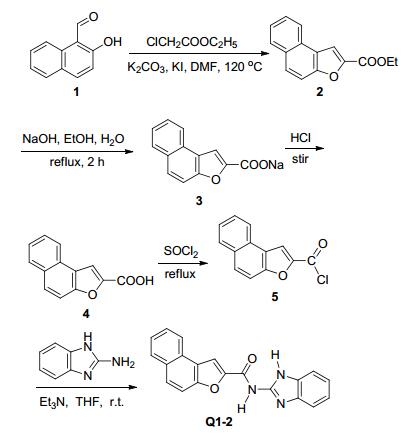
Compound Q1-2 can be readily prepared by a simple and low-cost amide reaction of naphtha[2, 1-b]furan-2- carbonyl chloride and 2-aminobenzimidazole (Scheme 2). The synthesis of naphtha[2, 1-b]furan-2-carbonyl chloride can be found in the reported literature.[32] naphtha[2, 1-b]furan-2-carbonyl chloride (0.462 g, 2 mmol), 2-amino- benzimidazole (0.333 g, 2.5 mmol) and 2.5 mL of triethylamine (Et3N) were combined in hot absolute tetrahydrofuran (THF, 30 mL). The solution was stirred under reflux for 6 h. After cooling to room temperature, the yellow precipitate was filtered, washed three times with hot absolute tetrahydrofuran, then recrystallized with THF to give a yellow powder product Q1-2 (1.53 mmol) in 76.5% yield. m.p. > 300 ℃; IR (KBr) v: 3387 (amide NH), 3314 (imidazole NH), 3120 (C=CH), 3060 (ArH), 1630 (C=O), 1596 (C=C) cm-1; 1H NMR (DMSO-d6, 600 MHz) δ: 12.64 (s, 2H, imidazole NH and amide NH), 7.20~8.42 (m, 11H, ArH); 13C NMR (DMSO-d6, 150 MHz) δ: 162.70, 160.45, 153.08, 151.48, 131.91, 130.39, 129.12, 128.22, 127.96, 127.70, 127.44, 125.84, 125.49, 123.95, 123.24, 122.56, 113.40, 113.05, 112.65, 110.12. ESI-MS m/z: 328.10 [M+H+]. Anal. calcd for C20H13N3O2: C 73.39, H 3.97, N 12.84; found C 73.32, H 3.99, N 12.85.
All the UV-vis experiments were carried out in DMSO/H2O (V:V=8:2) HEPES solution on a Shimadzu UV-2550 spectrometer. Any changes in the UV-vis spectra of the synthesized compound were recorded on addition of tetrabutylammonium salts while keeping the ligand concentration constant (2.0×10⁻⁵ mol/L) in all experiments. Tetrabutylammonium salt (1.0×10⁻³ mol/L) of anions (F-, Cl-, Br-, I-, AcO-, H2PO4-, HSO4-, and ClO4-) and sodium salt (1.0×10⁻³ mol/L) of anions (CN- and SCN-) were used for the UV-vis experiments.
All the fluorescence spectroscopy was carried out in DMSO/H2O (V:V=8:2) HEPES solution on a Shimadzu RF-5301 spectrometer. Any changes in the fluorescence spectra of the synthesized compound were recorded on addition of tetrabutylammonium salts while keeping the ligand concentration constant (2.0×10⁻⁵ mol/L) in all experiments. Tetrabutylammonium salt (1.0×10⁻³ mol/L) of anions (F-, Cl-, Br-, I-, AcO-, H2PO4-, HSO4- and ClO4-) and sodium salt (1.0×10 mol/L-3 mol/L) of anions (CN- and SCN-) were used for the fluorescence experiments
For 1H NMR titrations, the solution of Q1-2 was prepared in DMSO-d6 and the appropriate concentrated solution of guest was prepared in deuterium water. Aliquots of the two solutions were mixed directly in NMR tubes.
Supporting Information 1H NMR and 13C NMR spectra for Q1-2, ESI/MS of Q1-2 and Q1-2 with NaCN, and the determine of the UV-Vis and fluorescent detection limit for cyanide. The Supporting Information is available free of charge via the Internet at http://sioc-journal.cn/.
Yan, X. Z.; Wang, M.; Cook, T. R.; Zhang, M. M.; Saha, M. L.; Zhou, Z. X.; Li, X. P.; Huang, F. H.; Stang, P. J. J. Am. Chem. Soc. 2016, 138, 4580. doi: 10.1021/jacs.6b00846
Shi, B. B.; Jie, K. C.; Zhou, Y. J.; Zhou, J.; Xia, D. Y.; Huang, F. H. J. Am. Chem. Soc. 2016, 138, 80. doi: 10.1021/jacs.5b11676
Shi, B. B.; Jie, K. C.; Zhou, Y. J.; Xia, D. Y.; Yao, Y. Chem. Commun. 2015, 51, 4503. doi: 10.1039/C5CC00535C
Wang, S.; Fei, X.; Guo, J.; Yang, Q.; Li, Y.; Song, Y. Talanta 2016, 148, 229. doi: 10.1016/j.talanta.2015.10.058
Yao, Y.; Jie, K.; Zhou, Y.; Xue, M. Tetrahedron Lett. 2014, 55, 3195. doi: 10.1016/j.tetlet.2014.04.022
Sun, Y.; Hu, J. H.; Qi, J.; Li, J. B. Spectrochim. Acta Part A:Mol. Biomol. Spectrosc. 2016, 167, 101. doi: 10.1016/j.saa.2016.05.017
Yu, M.; Liu, Y.; Chen, Y.; Zhang, N.; Liu, Y. Chin. J. Chem. 2012, 30, 1948. doi: 10.1002/cjoc.201200543
Zhang, Z.; Wang, H.; Zhang, H.; Liu, Y. Chin. J. Chem. 2013, 31, 598. doi: 10.1002/cjoc.201300216
Wang, L.; Zhu, L.; Li, L.; Cao, D. RSC Adv. 2016, 6, 55182. doi: 10.1039/C6RA10073B
Wang, L.; Du, J.; Cao, D. Sens. Actuators, B 2014, 198, 455. doi: 10.1016/j.snb.2014.03.046
Chen, L. J.; Ren, Y. Y.; Wu, N. W.; Sun, B.; Ma, J. Q.; Zhang, L.; Tan, H. W.; Liu, M. H.; Li, X. P.; Yang, H. B. J. Am. Chem. Soc. 2015, 137, 11725. doi: 10.1021/jacs.5b06565
Liu, T.; Huo, F.; Li, J.; Cheng, F.; Yin, C. Sens. Actuators, B 2017, 239, 526. doi: 10.1016/j.snb.2016.08.051
王其, 程明, 曹逸涵, 强琚莉, 王乐勇, 化学学报, 2016, 74, 9.Wang, Q.; Cheng, M.; Cao, Y. H.; Qiang, J. L.; Wang, L. Y. Acta Chim. Sinica 2016, 74, 9 (in Chinese).
Gale, P. A. Chem. Soc. Rev. 2010, 39, 3746. doi: 10.1039/c001871f
Gale, P. A. Chem. Commun. 2011, 47, 82. doi: 10.1039/C0CC00656D
Erdemir, S.; Kocyigit, O.; Alici, O.; Malkondu, S. Tetrahedron Lett. 2013, 54, 613. doi: 10.1016/j.tetlet.2012.11.138
Singh, Y.; Ghosh, T. Talanta 2016, 148, 257. doi: 10.1016/j.talanta.2015.10.085
Fillaut, J. L.; Akdas-Kilig, H.; Dean, E.; Latouche, C.; Boucekkine, A. Inorg. Chem. 2013, 52, 4890. doi: 10.1021/ic302478e
黄青, 曲文娟, 陈洁, 林奇, 姚虹, 张有明, 魏太保, 有机化学, 2017, 37, 629. http://manu19.magtech.com.cn/Jwk_yjhx/CN/abstract/abstract346362.shtmlHuang, Q.; Qu, W. J.; Chen, J.; Lin, Q.; Yao, H.; Zhang, Y. M.; Wei, T. B. Chin. J. Org. Chem. 2017, 37, 629 (in Chinese). http://manu19.magtech.com.cn/Jwk_yjhx/CN/abstract/abstract346362.shtml
李文婷, 曲文娟, 张海丽, 李翔, 林奇, 姚虹, 张有明, 魏太保, 有机化学, 2017, 37, 2619. http://manu19.magtech.com.cn/Jwk_yjhx/CN/abstract/abstract346127.shtmlLi, W. T.; Qu, W. J.; Zhang, H. L.; Li, X.; Lin, Q.; Yao, H.; Zhang, Y. M.; Wei, T. B. Chin. J. Org. Chem. 2017, 37, 2619 (in Chinese). http://manu19.magtech.com.cn/Jwk_yjhx/CN/abstract/abstract346127.shtml
Kumari, N.; Jha, S.; Bhattacharya, S. J. Org. Chem. 2011, 76, 8215. doi: 10.1021/jo201290a
Lin, W. C.; Fang, S. K.; Hu, J. W.; Tsai, H. Y.; Chen, K. Y. Anal. Chem. 2014, 86, 4648. doi: 10.1021/ac501024d
Shiraishi, Y.; Nakamura, M.; Hayashi, N.; Hirai, T. Anal. Chem. 2016, 88, 6805. doi: 10.1021/acs.analchem.6b01279
Kim, H. J.; Ko, K. C.; Lee, J. H.; Lee, J. Y.; Kim, J. S. Chem. Commun. 2011, 47, 2886. doi: 10.1039/c0cc05018k
Wang, L.; Li, L.; Cao, D. Sens. Actuators, B 2016, 228, 347. doi: 10.1016/j.snb.2016.01.044
Chen, X.; Zhou, Y.; Peng, X.; Yoon, J. Chem. Soc. Rev. 2010, 39, 2120. doi: 10.1039/b925092a
Xu, Z.; Kim, S. K.; Yoon, J. Chem. Soc. Rev. 2010, 39, 1457. doi: 10.1039/b918937h
Cheng, X.; Tang, R.; Jia, H.; Feng, J.; Qin, J.; Li, Z. ACS Appl. Mater. Interfaces 2012, 4, 4387. doi: 10.1021/am3010412
Wu, X.; Xu, B.; Tong, H.; Wang, L. Macromolecules 2011, 44, 4241. doi: 10.1021/ma2005684
Li, J.; Qi, X.; Wei, W.; Liu, Y.; Xu, X.; Lin, Q.; Dong, W. Sens. Actuators, B 2015, 220, 986. doi: 10.1016/j.snb.2015.06.042
Li, J.; Qi, X.; Wei, W.; Zuo, G.; Dong, W. Sens. Actuators, B 2016, 232, 666. doi: 10.1016/j.snb.2016.04.021
Qu, W. J.; Guan, J.; Wei, T. B.; Yan, G. T.; Lin, Q.; Zhang, Y. M. RSC Adv. 2016, 6, 35804. doi: 10.1039/C6RA05381E

Scheme 1 Chemical structures and cartoon representations of Q1-2 and cyanide in dimethyl sulfoxide (DMSO)/H2O (V:V=8:2) solutions

Figure 1 Absorbance spectra (a) and fluorescent spectra (b) of target compound Q1-2 (20 μmol/L) in DMSO/H2O (V:V=8:2) in the presence of cyanide and other anions (50 equiv.)
Inset: photograph showing the change in color of the solution of Q1-2 in DMSO/H2O (V:V=8:2, 20 μmol/L) after addition of cyanide and other anions at room temperature

Figure 2 Absorbance data (a) and fluorescence emission data (b) for a 1:50 mixture of Q1-2 (20 μmol/L) and different tetrabutylammonium salts of anions in DMSO/H2O (V:V=8:2) solutions at room temperature (excitation wavelength=365 nm)

Figure 3 Absorption spectrum of Q1-2 (20 μmol/L) in the presence of different concentration of cyanide in DMSO/H2O (V:V=8:2) solutions at room temperature
Inset: A plot of absorbance intensity depending on the concentration of cyanide at 370 and 390 nm

Figure 4 Fluorescent spectrum of Q1-2(20 μmol/L) in the presence of different concentration of cyanide in DMSO/H2O (V:V=8:2) solutions at room temperature
Inset: A plot of fluorescent intensity depending on the concentration of cyanide at 475 nm (λex=365 nm)

Figure 5 Effect of pH on the fluorescence spectra for Q1-2 in response to CN- (20 mol/L) from 2 to 13 in DMSO/H2O (pH=7.0, V:V=8:2) solution (λex=365 nm, λem=475 nm)

Figure 6 IR spectra of sensor Q1-2 (a) and after adding cyanide anions (b) in KBr disks

Figure 7 Partial 1H NMR spectra of Q1-2 (DMSO-d6) and in the presence of varying amounts of cyanide anions (1 mol/L, D2O)

Figure 9 Photos of the silica gel plates utilized to sense cyanide in aqueous solution in visible light and under irradiation at 365 nm by a UV lamp

 扫一扫看文章

扫一扫关注我们
 下载:
下载:
 下载:
下载:


