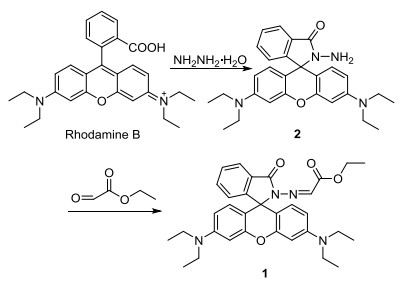
Scheme 1.
Synthesis of 1
A Hg2+-Selective Fluorescence Probe: Synthesis and Application in Aqueous Solution and Living Cell Imaging
Min Zhang , Huifeng Xiao , Zhixiang Han , Liuqing Yang , Xiangyang Wu

Mercury is highly toxic even at relatively low concentrations, and is widespread in air, water, and soil. What's worse, mercury can be accumulated through the food chain and atmospheric circulation.[1, 2] The exposure to mercury would cause a lot of severe environmental and health threats.[3] For example, Hg2+ could block thiol group (SH) in enzymes and proteins, leading to the dysfunction of cells, and consequently, it will produce fatal damage to brain, nervous and endocrine systems, and even the kidneys.[4, 5]
Considerable efforts have been devoted to detecting Hg2+ via different analytical methods. In contrast to other approaches, such as liquid chromatography, [6] capillary electrophoresis, [7] neutron activation analysis, [8] and anodic stripping voltammetry, [9] increasing attention has been paid to the development of colorimetric and fluorescent probes for the detection of Hg2+ owing to their high sensitivity and selectivity, easy operation, rapid measurement, low cost and real time monitoring.[10~13] In the past decades, a great many fluorescent probes for Hg2+ have been explored, [14~37] but many of them suffer the cross-sensitivity towards potential competitive metal ions, for example Cr3+, [21, 22, 32] Cu2+, [20, 25, 31, 33, 37] Fe3+[20, 33, 34] and Al3+.[23] Therefore, it is important to develop effective fluorescent probes, which could detect Hg2+ with excellent selectivity and sensitivity.
The rhodamine structure, which has excellent photophysical properties, such as long absorption and emission wave-length, high fluorescence quantum yield, large absorption coefficients, has been extensively used as a signaling moiety in the construction of turn-on fluorescent probes for the detection of important cations and anions.[14~17, 1~29, 31, 32, 34, 35, 38] The ester group in fluorescent probes can not only increase the chelating ability between the probes and metal ions[39], but also improve the ability of application in the biological system.[40] In view of the above-mentioned advantages of rhodamine and ester group, a new Schiff-base fluorescence probe 1 based rhodamine B and ethyl glyoxalate was designed and synthesized (Scheme 1). The probe shows a turn-on fluorescent response for Hg2+ in aqueous solution with remarkably high selectivity and sensitivity. Furthermore, it has been used for Hg2+ imaging in living cells with satisfying results.
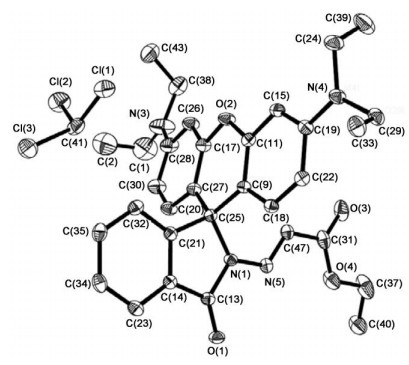
The synthetic route of probe 1 was shown in Scheme 1. Rhodamine B hydrazide 2 was prepared according to the method described in our previous work.[35] Condensation of 2 with ethyl glyoxalate yielded probe 1. The structural characterization of 1 was characterized by 1H NMR, 13C NMR, and MS. Furthermore, the structure of probe 1 was confirmed through its single crystal X-ray analysis. Light pink single crystals were obtained by slow evaporation of the mixed CHCl3-petroleum ether (60~90 ℃) solution at room temperature. A crystal (0.20 mm×0.20 mm×0.20 mm) was measured on a Rigaku Saturn 724 CCD area diffractometer equipped with a graphite-monochromatic Mo Kα radiation (λ=0.71073 ). The crystal structure has been deposited at the Cambridge Crystallographic Data Centre (deposition number CCDC 1410668). The results reveal that probe 1 crystallizes with 0.64 CHCl3 solvent molecule (Figure 1). The crystal belongs to monocline system with P21/c space group.
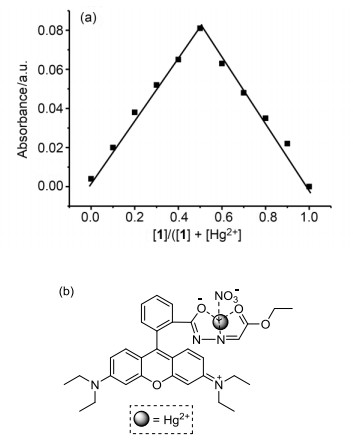
The UV-Vis absorption spectra of 1 with adding different concentrations of Hg2+ was carried out in ethanol-water (V/V=7/3) buffer (HEPES 10 mmol/L, pH=7.0), and the results were shown in Figure 2. The solution of 1 was colorless and exhibited no absorption peak in the visible wavelength range (450~600 nm). After addition of Hg2+, characteristic absorption peak at 560 nm appeared and gradually increased with addition of increasing concentration of Hg2+, which demonstrated the formation of the ring-opened form of 1 upon Hg2+ binding. Meanwhile, an obvious color change from colorless to pink occurred, suggesting that 1 can be used as a "naked-eye" probe for Hg2+ in test systems (Figure 2, inset). Job's method for the absorbance was used to define the stoichiometry of the 1-Hg2+ complex by keeping total concentration of Hg2+ and 1 at 10 μmol/L and changing the molar ratio of 1 from 0 to 1. As shown in Figure 3a, a maximum absorption occurred when the molar fraction of [1] vs. ([1]+[Hg2+]) was 0.50, which revealed that 1 and Hg2+formed a complex with the molar ratio of 1:1. Moreover, ESI-MS analysis also confirmed the 1:1 binding model. 1 has a peak at m/z 541.46 (M+H+), whereas a peak at m/z 803.91 shows up upon the addition of Hg2+, which corresponds to [M+ Hg2++NO3-] (calcd 804.23). Thus, the proposed binding model of 1 with Hg2+ was given in Figure 3b.
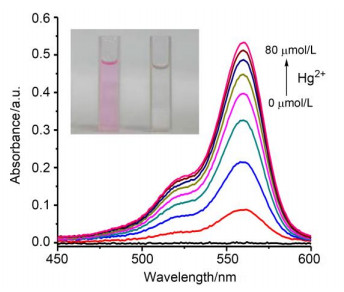
Inset: the photograph shows the color change from free 1 (right) to 1+Hg2+ (left) under normal light
Fluorescence titration of 1 with Hg2+ was investigated in ethanol-water (7/3=V/V) buffer (HEPES 10 mmol/L, pH 7.0) (Figure 4). The free 1 showed almost no fluorescent emission. Upon addition of Hg2+ to the solution of 1, an emission peak value at 583 nm was observed and fluorescence intensity gradually increased with the increase of Hg2+ concentration. The fluorescence intensity reached a peak after addition of 8.0 equiv. of Hg2+ with a 49-fold fluorescence intensity enhancement. The fluorescent response of probe 1 towards Hg2+ was calculated to cover a linear range from 0 to 50 μmol/L (R2=0.9955) (Figure 4 inset), which can be applied to the quantitative analysis of Hg2+ in this range.
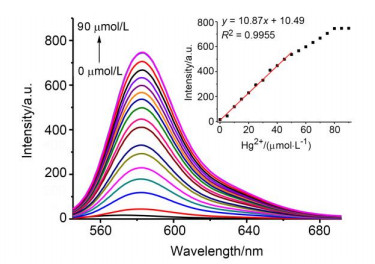
Inset: the linear relationship between [Hg2+] and fluorescence intensity of 1
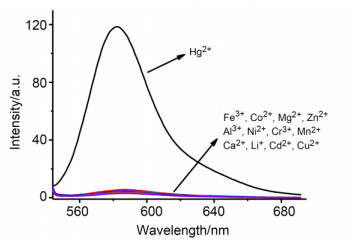
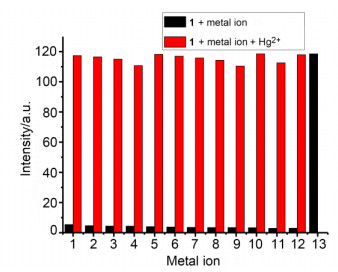
The selectivity of probe 1 to various competing ions was also performed in ethanol-water (V/V=7/3) buffer (HEPES 10 mmol/L, pH=7.0). The addition of 1.0 equiv. of other metal ions (Fe3+, Co2+, Mg2+, Zn2+, Al3+, Ni2+, Cr3+, Mn2+, Ca2+, Li+, Cd2+ and Cu2+) to the solution of 1 (10 μmol/L) showed no color change and no fluorescence. Upon the addition of Hg2+, a visible pink color appeared and orange fluorescence was observed. As shown in Figure 5, only Hg2+ could induce a fluorescence increase, whereas the other metal ions did not show this behavior, suggesting that probe 1 is highly selective for Hg2+ over the other metal ions. To investigate the practical applicability of 1 for Hg2+, the interference experiments were carried out with the excitation fixed at 530 nm and the emission at 583 nm (Figure 6). No obvious fluorescence intensity changes of probe 1 were observed upon addition of common interferences such as Fe3+, Al3+, Cr3+, Al3+, and so on. According to Figure 3b, the ester group of probe 1 may contribute to the high selectivity.
λex=530 nm, from left to right (1) Fe3+, (2) Co2+, (3) Mg2+, (4) Zn2+, (5) Al3+, (6) Ni2+, (7) Cr3+, (8) Mn2+, (9) Ca2+, (10) Li+, (11) Cd2+, (12) Cu2+, (13) Hg2+
Furthermore, the effect of pH on the fluorescence intensity of 1 in the absence and presence of Hg2+ was explored at a pH range from 3.0 to 9.0. The fluorescence intensity at 583 nm of free probe 1 was not affected by a pH range of 5.0~8.5, and that of 1-Hg2+ did not vary with pH in the range of 6.5~8.5. The results suggested that probe 1 can be employed to monitor Hg2+under physiological pH conditions.
The in vitro cytotoxicity of probe 1 was evaluated using a MTT [3-(4, 5-dimethyl-2-thiazolyl)-2, 5-diphenyl-2H-tetra-zolium bromide] assay by measuring anti-proliferation on MGC-803 cells. A cytotoxicity screen was conducted in the concentration of 0~100 μmol/L. The cellular viability estimated was ca. 97% and 54% in 24 h after treatment with 10 and 80 μmol/L 1, respectively, and the IC50 value was calculated as 83.44 μmol/L. Due to the above-mentioned characteristics of probe 1, bioimaging applications of 1 for detecting of Hg2+ in living cells were then explored. After MGC-803 cells were cultured with a solution of 10 μmol/L probe 1 for 15 min at 37 ℃ and then washed with phosphate-buffered saline (PBS) three times, no evidence of fluorescence appeared (Figure 7b). After further incubation with 80 μmol/L Hg(NO3)2 for another 15 min at 37 ℃, the red fluorescence was observed (Figure 7d). The bright field image of MGC-803 cells proved that probe 1 was practical on cell imaging experiments (Figures 7a and 7c). It was proven that probe 1 is cell-permeable and may be used for monitoring Hg2+ in living cells.
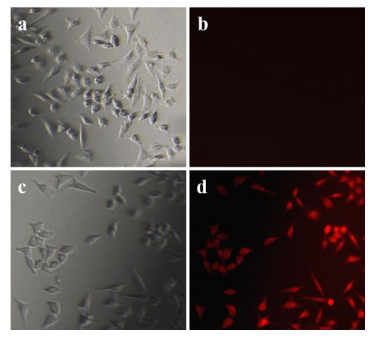
Bright-field transmission images (a and c) and fluorescence images (b and d) of MGC-803 cells incubated with 0, 80 μmol/L Hg2+ for 15 min, respectively
In summary, we have developed an effective rhodamine B-ethyl glyoxalate based turn-on fluorescent probe for Hg2+ in aqueous media and living cells with high sensitivity and selectivity. The 1:1 binding stoichiometry between probe 1 and Hg2+ was established by Job's plot and MS spectra. Furthermore, it can be applied to the quantitative analysis of Hg2+ in the range of 0~50 μmol/L. Most importantly, the probe was effectively used in cell imaging, indicating its promising value in the practical application in biological systems.
All analytical grade chemicals were used as received from commercial suppliers. 1H NMR and 13C NMR spectra were recorded on a Bruker AVANCEⅡ400 MHz instrument in CDCl3 with TMS as an internal standard. Mass spectra were obtained from a Thermo LXQ Liquid Chromatgraphy-Ion Trap Mass Spectrometry. The single-crystal structure was determined on a Rigaku Saturn 724 CCD area-detector diffractometer. The UV-vis absorption spectra were obtained on a Shimadzu UV-2450 scanning spectrophotometer. All fluorescence spectra were measured with a Varian Cary Eclipse spectrophotometer. Fluorescence images of MGC-803 cells were carried out with an inverted fluorescence microscope (Carl Zeiss, Axio Observer A1).
As showed in Scheme 1, rhodamine B hydrazide 2 was synthesized following the procedure described in our previous work.[35] m.p. 175~176 ℃ (Lit.[35] 175~176 ℃); 1H NMR (400 MHz, CDCl3) δ: 7.95~7.92 (m, 1H), 7.48~7.42 (m, 2H), 7.13~7.08 (m, 1H), 6.50~6.40 (m, 4H), 6.36~6.24 (m, 2H), 3.61 (s, 2H), 3.34 (q, J=7.2 Hz, 8H), 1.16 (t, J=7.2 Hz, 12H). ESI-MS m/z: 457.49 (20, [M+ H+]), 935.41 (100, [2M+Na+]).
The mixture of rhodamine B hydrazide 2 (0.46 g, 1.0 mmol), ethyl glyoxalate (ca. 50% solution in toluene, 2 mL), anhydrous sodium sulfate (1.0 g) and methanol (10 mL) was stirred overnight at room temperature. The solvent was removed under reduced pressure to obtain the crude product. After recrystallization from ethyl acetate, 0.33 g of 1 was collected as a pale pink solid (yield 61%), m.p. 142~143 ℃; 1H NMR (400 MHz, CDCl3) δ: 8.04 (d, J=7.2 Hz, 1H), 7.54~7.45 (m, 2H), 7.16 (s, 1H), 7.07 (d, J=7.2 Hz, 1H), 6.52~6.36 (m, 4H), 6.28~6.24 (m, 2H), 4.22 (q, J=7.2 Hz, 2H), 3.34 (q, J=7.2 Hz, 8H), 1.31 (t, J=7.2 Hz, 3H), 1.18 (t, J=7.2 Hz, 12H); 13C NMR (100 MHz, CDCl3) δ: 165.7, 163.7, 153.2, 152.5, 149.2, 134.6, 133.4, 128.4, 127.5, 126.4, 124.0, 123.8, 108.2, 104.0, 98.2, 65.5, 61.4, 44.3, 14.1, 12.6. ESI-MS m/z: 541.46 [M+H+].
Solutions of different metal salts were obtained by dissolving corresponding nitrate salts in deionized water. Deionized water was used throughout the work. HEPES buffer solutions (10 mmol/L, pH=7.0) were prepared in water. 1 mmol/L stock solution of 1 was performed by dissolving 1 in ethanol.
The MGC-803 cells were cultured in Dulbecco's modified Eagle's medium (DMEM) supplemented with 10% fetal bovine serum (FBS). 24 h before imaging, the cells were seeded into 24 well plates. The cells were incubated with 10 μmol/L 1 for 15 min at 37 ℃, washed three times with PBS and imaged. Then the cells were supplemented with 80 μmol/L Hg2+ for 15 min at 37 ℃, washed three times with PBS and imaged, which was observed by an inverted fluorescence microscope.
Cytotoxicity of 1 in cells was assessed by MTT assay. MGC-803 cells were seeded into 96-well cell culture plate, and cultured at 37 ℃ with 5% CO2 for 24 h. After removing DMEM with 10% FBS, new DMEM and different concentrations of 1 were added into plates. The cells were incubated at 37 ℃ with 5% CO2 for another 24 h. After that, 100 μL of MTT (5 mg/mL) was added to each well and incubated for additional 4 h at 37 ℃ with 5% CO2. Then cells were dissolved in 600 μL of dimethyl sulfoxide (DMSO) per well, and MTT formazan was recorded by a microplate reader. The cell viability was calculated as the equation: cell viability(%)=ODsample/ODcontrol×100%.
IC50 value of 1 against MGC-803 was calculated with SPSS 16.0 version (SPSS Inc., Chicago, USA).
Supporting Information 1H NMR and MS spectra of 2, 1H NMR, 13C NMR and MS spectra of probe 1, MS spectra of 1-Hg2+, the colorimetric and fluorometric changes of 1, effect of pH on the fluorescence intensity of 1 and cell viability of 1. The Supporting Information is available free of charge via the Internet at http://sioc-journal.cn/.
Renzoni, A.; Zino, F.; Franchi, E. Environ. Res. 1998, 77, 68. doi: 10.1006/enrs.1998.3832
Tchounwou, P. B.; Ayensu, W. K.; Nnasvili, N.; Sutton, D. Environ. Toxicol. 2003, 18, 149. doi: 10.1002/(ISSN)1522-7278
Boening, D. W. Chemosphere 2000, 40, 1335. doi: 10.1016/S0045-6535(99)00283-0
Harris, H. H.; Pickering, I. J.; George, G. N. Science 2003, 301, 1203. doi: 10.1126/science.1085941
Onyido, I.; Norris, A. R.; Buncel, E. Chem. Rev. 2004, 104, 5911. doi: 10.1021/cr030443w
Liu, L.; Wong, W.-Y.; Lam, Y.-W.; Tam, W.-Y. Inorg. Chim. Acta 2007, 360, 109. doi: 10.1016/j.ica.2006.07.037
Saito, S.; Sasamura, S.; Hoshi, S. Analyst 2005, 130, 659. doi: 10.1039/B417394E
Devi, P. R.; Gangaiah, T.; Naidu, G. R. K. Anal. Chim. Acta 1991, 249, 533. doi: 10.1016/S0003-2670(00)83030-5
Khun, N. W.; Liu, E. Electrochim. Acta 2009, 54, 2890. doi: 10.1016/j.electacta.2008.11.014
Nolan, E. M.; Lippard, S. J. Chem. Rev. 2008, 108, 3443. doi: 10.1021/cr068000q
Jung, J. H.; Lee, J. H.; Shinkai, S. Chem. Soc. Rev. 2011, 40, 4464. doi: 10.1039/c1cs15051k
Yang, Y.; Zhao, Q.; Feng, W.; Li, F. Chem. Rev. 2013, 113, 192. doi: 10.1021/cr2004103
Guo, Z.; Park, S.; Yoon, J.; Shin, I. Chem. Soc. Rev. 2014, 43, 16. doi: 10.1039/C3CS60271K
Yang, Y.-K.; Yook, K.-J.; Tae, J. J. Am. Chem. Soc. 2005, 127, 16760. doi: 10.1021/ja054855t
Wu, D.; Huang, W.; Duan, C.; Lin, Z.; Meng, Q. Inorg. Chem. 2007, 46, 1538. doi: 10.1021/ic062274e
Zhang, X.; Xiao, Y.; Qian, X. Angew. Chem., Int. Ed. 2008, 47, 8025. doi: 10.1002/anie.v47:42
Wu, D.; Huang, W.; Lin, Z.; Duan, C.; He, C.; Wu, S.; Wang, D. Inorg. Chem. 2008, 47, 7190. doi: 10.1021/ic8004344
Zhu, M.; Yuan, M.; Liu, X.; Xu, J.; Lv, J.; Huang, C.; Liu, H.; Li, Y.; Wang, S.; Zhu, D. Org. Lett. 2008, 10, 1481. doi: 10.1021/ol800197t
Huang, J.; Xu, Y.; Qian, X. J. Org. Chem. 2009, 74, 2167. doi: 10.1021/jo802297x
Jiang, L.; Wang, L.; Zhang, B.; Yin, G.; Wang, R.-Y. Eur. J. Inorg. Chem. 2010, 28, 4438. https://www.sciencedirect.com/science/article/pii/S2210271X11001873
Saha, S.; Mahato, P.; Reddy, G. U.; Suresh, E.; Chakrabarty, A.; Baidya, M.; Ghosh, S. K.; Das, A. Inorg. Chem. 2012, 51, 336. doi: 10.1021/ic2017243
Mahato, P.; Saha, S.; Suresh, E.; Di Liddo, R.; Parnigotto, P. P.; Conconi, M. T.; Kesharwani, M. K.; Ganguly, B.; Das, A. Inorg. Chem. 2012, 51, 1769. doi: 10.1021/ic202073q
Yan, F.; Wang, M.; Cao, D.; Yang, N.; Fu, Y.; Chen, L.; Chen, L. Dyes Pigm. 2013, 98, 42. doi: 10.1016/j.dyepig.2013.02.002
Chu, K.-H.; Zhou, Y.; Fang, Y.; Wang, L.-H.; Li, J.-Y.; Yao, C. Dyes Pigm. 2013, 98, 339. doi: 10.1016/j.dyepig.2013.02.019
Dong, Z.; Tian, X.; Chen, Y.; Hou, J.; Guo, Y.; Sun, J.; Ma, J. Dyes Pigm. 2013, 97, 324. doi: 10.1016/j.dyepig.2013.01.002
Chen, X. L.; Meng, X. M.; Wang, S. X.; Cai, Y. L.; Wu, Y. F.; Feng, Y.; Zhu, M. Z.; Guo, Q. X. Dalton Trans. 2013, 42, 14819. doi: 10.1039/c3dt51279g
陈稼轩, 田怡, 向清祥, 熊俊如, 张丽群, 李艳, 有机化学, 2013, 33, 2210.Chen, J.; Tian, Y.; Xiang, Q.; Xiong, J.; Zhang, L.; Li, Y. Chin. J. Org. Chem. 2013, 33, 2210(in Chinese).
Han, Z.-X.; Zhu, B.-S.; Wu, T.-L.; Yang, Q.-Q.; Xue, Y.-L.; Zhang, Z.; Wu, X.-Y. Chin. Chem. Lett. 2014, 25, 73. doi: 10.1016/j.cclet.2013.10.027
周佳, 杨美盼, 孟文斐, 成昭, 杨秉勤, 有机化学, 2014, 34, 1646.Zhou, J.; Yang, M.; Meng, W.; Cheng, Z.; Yang, B. Chin. J. Org. Chem. 2014, 34, 1646(in Chinese).
Srivastava, P.; Razi, S. S.; Ali, R.; Gupta, R. C.; Yadav, S. S.; Narayan, G.; Misra, A. Anal. Chem. 2014, 86, 8693. doi: 10.1021/ac501780z
Wang, M.; Wen, J.; Qin, Z. H.; Wang, H. M. Dyes Pigm. 2015, 120, 208. doi: 10.1016/j.dyepig.2015.04.013
孙京府, 钱鹰, 有机化学, 2016, 36, 151. http://www.umiacs.umd.edu/~resnik/temp/ne_wikipedia/wikilex-20070908-en-zh.txtSun, J.; Qian, Y. Chin. J. Org. Chem. 2016, 36, 151(in Chinese). http://www.umiacs.umd.edu/~resnik/temp/ne_wikipedia/wikilex-20070908-en-zh.txt
Zhang, C.; Gao, B.; Zhang, Q.; Zhang, G.; Shuang, S.; Dong, C. Talanta 2016, 154, 278. doi: 10.1016/j.talanta.2016.03.067
Li, X.; Yin, Y.; Deng, J.; Zhong, H.; Tang, J.; Chen, Z.; Yang, L.; Ma, L.-J. Talanta 2016, 154, 329. doi: 10.1016/j.talanta.2016.03.090
肖慧丰, 张敏, 刘杰, 韩志湘, 仰榴青, 吴向阳, 有机化学, 2016, 36, 2413.Xiao, H.; Zhang, M.; Liu, J.; Han, Z.; Yang, L.; Wu, X. Chin. J. Org. Chem. 2016, 36, 2413(in Chinese).
Agarwalla, H.; Mahajan, P. S.; Sahu, D.; Taye, N.; Ganguly, B.; Mhaske, S. B.; Chattopadhyay, S.; Das, A. Inorg. Chem. 2016, 55, 12052. doi: 10.1021/acs.inorgchem.6b02233
Gu, B.; Huang, L.; Su, W.; Duan, X.; Li, H.; Yao, S. Anal. Chim. Acta 2017, 954, 97. doi: 10.1016/j.aca.2016.11.044
Kim, H. N.; Lee, M. H.; Kim, H. J.; Kim, J. S.; Yoon, J. Chem. Soc. Rev. 2008, 37, 1465. doi: 10.1039/b802497a
Qi, X.; Jun, E. J.; Xu, L.; Kim, S.-J.; Hong, J. S. J.; Yoon, Y. J.; Yoon, J. J. Org. Chem. 2006, 71, 2881. doi: 10.1021/jo052542a
Guzow, K.; Milewska, M.; Wiczk, W. Spectrochim. Acta, Part A 2005, 61, 1133. doi: 10.1016/j.saa.2004.06.035

Figure 2 UV-Vis absorption titration spectra of 1 (10 μmol/L) with Hg2+ (0~8.0 equiv.) in ethanol-water (V/V=7/3) buffer (HEPES 10 mmol/L, pH 7.0)
Inset: the photograph shows the color change from free 1 (right) to 1+Hg2+ (left) under normal light

Figure 3 (a) Job's plot of 1 and Hg2+ and (b) the proposed binding model of 1 with Hg2+

Figure 4 Fluorescence emission spectra of 1 (10 μmol/L) upon titration of Hg2+ (0~9.0 equiv.) in ethanol-water (V/V=7/3) buffer (HEPES 10 mmol/L, pH 7.0) (λex=530 nm, λem=583 nm)
Inset: the linear relationship between [Hg2+] and fluorescence intensity of 1

Figure 5 Fluorescence spectrum of probe 1 (10 μmol/L) upon addition of 1.0 equiv. Fe3+, Co2+, Mg2+, Zn2+, Al3+, Ni2+, Cr3+, Mn2+, Ca2+, Li+, Cd2+, Cu2+, Hg2+ in ethanol-water (V/V=7/3) buffer (HEPES 10 mmol/L, pH 7.0) (λex=530 nm)

Figure 6 Fluorescence intensity of 1 (10 μmol/L) after addition of Hg2+ (10 μmol/L) in the presence of other metal ions (10 μmol/L) in ethanol-water (V/V=7/3, HEPES 10 mmol/L, pH 7.0)
λex=530 nm, from left to right (1) Fe3+, (2) Co2+, (3) Mg2+, (4) Zn2+, (5) Al3+, (6) Ni2+, (7) Cr3+, (8) Mn2+, (9) Ca2+, (10) Li+, (11) Cd2+, (12) Cu2+, (13) Hg2+

 扫一扫看文章

扫一扫关注我们
 下载:
下载:

 下载:
下载:

