Table 1.
Crystal Data and Structure Refinement for Complexes 1~4
Citation:
Hui-Chao GUAN, Xiao-Tong SONG, Gui-Bao LIU, Shu-Mei YUE. Syntheses, Crystal Structures and DNA-Binding Properties of Zn(II) and Mn(II) Complexes Based on Imidazole Derivatives and Carboxylic Acid[J]. Chinese Journal of Structural Chemistry,
2022, 41(3): 220326.
doi:
10.14102/j.cnki.0254-5861.2011-3363

Syntheses, Crystal Structures and DNA-Binding Properties of Zn(II) and Mn(II) Complexes Based on Imidazole Derivatives and Carboxylic Acid
English
Syntheses, Crystal Structures and DNA-Binding Properties of Zn(II) and Mn(II) Complexes Based on Imidazole Derivatives and Carboxylic Acid
Abstract:
Complexes [Zn(pbm)(5-hip)3] (1), [Zn(pbm)(5-nip)3] (2), [Mn(pbm)(H3btc)2(H2O)] (3) and [Mn(pbm)(5-nip)3] (4), where H2HIPA = 5-hydroxyisophthalic acid, H2nip = 5-nitroisophthalic acid, H3btc = trimesic acid and pbm (pyridine benzene chelate material) = 2-(2-pyridyl)benzimidazole, were identified via single-crystal XRD analyses. 1, 2 and 4 pertain to the monoclinic space group C2/c, while 3 belongs to the triclinic space group P$ \overline 1 $. The interplay of CT-DNA with those complexes was delineated using ultraviolet, fluorescence, and circular dichroism (CD) spectroscopy and viscosity measurements. Complexes 1, 2, 3 and 4 interact with CT-DNA in an electrostatic or grooving mode. We wish to offer a theory-wise foundation for developing anti-tumor medicines.
-
Key words:
- single-crystal structures
- / spectroscopy
- / CT-DNA binding
- / 2-(2-pyridyl)benzimidazole
-
1. INTRODUCTION
The researches on the designing and synthesis of metallic complexes have aroused extensive academic interest, which focus on the studies on worldwide coordination chemistry. Those derivatives of imidazole heterocyclic N-donor ligands have attracted substantial attention due to their frameworks and reactivity in the complex synthesis process as well as their magnetic and luminescent properties[1-6]. Nitrogen-containing heterocyclic metal complexes with special chemical structures and unique physicochemical features have been applied in functional materials, medicines and other fields[7-13]. At present, the antitumor activity of transition metal complexes is studied from the interaction modes between transition metal complexes and DNA. Researches on the DNA binding of metallic complexes, which is a vital and major challenge in life science, are particularly important for the exploration of DNA molecular probe and new therapeutic reagents. The interactions of metal complexes with DNA mainly include noncovalent interactions, covalent interactions and cutting action intercalation. Among them, the possible binding modes of the complexes to DNA include noncovalent interactions[14-18]. At present, substantial research about the interplay process of metallic ion metal complexes and DNA has been finished[19-22]. Sama has reported that mononuclear Cu complexes have the apparent binding ability towards CT-DNA[23]. Bian Lin adopted agarose gel electrophoresis for researching PBR322 DNA cleavage with complexes[24]. The interplay of metal compounds with DNA has been broadly researched. Zhou Qing-Hua et al. reported imidazole metal complexes. Meanwhile, the interplay of compounds and calf thymus DNA was explored[25-27]. Thus, the binding modes of metal complexes and DNA have become an academic hotspot.
Our research team has committed to exploring the synthetic method of metallic complexes and their DNA-binding properties[28]. Qi Shuang et al. reported the success in synthesizing transition metal compounds with 2-(2-pyridyl)benzothiazole as ligands in 2018. Besides, a study revealed the binding properties exhibited by these complexes with DNA[29].
In this research, our team reported the synthetic process and structural characterization of Zn(II) and Mn(II) complexes having 2-(2-pyridinyl)benzimidazole as a ligand. Interactions between four complexes and calf thymus DNA were investigated by means of spectroscopy (ultraviolet spectrum, fluorescence spectrum and circular dichroism spectrum) and viscometric analysis.
2. EXPERIMENTAL
2.1 Materials
All chemicals and solvents were applied without purification unless noted. Aladdin provided 5-hydroxyisophthalic acid, 5-nitroisophthalic acid, 2-(2-pyridyl)benzimidazole, trimesic acid, tris-HCl and CT-DNA. The CT-DNA was refrigerated at 2~8 ℃ and a TU-1901 spectrophotometer was used to measure visible and ultraviolet photoelectron absorption spectra. Besides, fluorescence was measured by a RF-5301PC spectrometer.
2.2 Synthetic processes of complexes 1~4
2.2.1 Synthetic process of [Zn(pbm)(5-hip)3] (1)
The mixture with ZnCl2·2H2O (0.1 mmol, 0.0197 g), DMF (4 mL), 2-(2-pyridyl)benzimidazole (0.2 mmol, 0.3900 g), H2O (2 mL), and 5-hydroxyisophthalic acid (0.1 mmol, 0.0182 g) was placed into a stainless-steel autoclave which was heated under 80 ℃ for seventy-two hours. When the reactor was cooled towards room temperature, the pale yellow crystals of complex 1 were obtained with 61% productivity on the basis of pbm. Anal. Calcd. (%) in C22H13N4O5Zn: H, 2.72; C, 55.23; N, 11.72. Found (%): H, 2.70; C, 55.14; N, 11.43.
2.2.2 Synthesis process of [Zn(pbm)(5-nip)3] (2)
A mixture of 2-(2-pyridyl)benzimidazole (0.3900 g, 0.2 mmol) and 5-nitroisophthalic acid (0.0211 g, 0.1 mmol) was added into 5 mL water solution of ZnCl2·2H2O (0.1 mmol, 0.01757 g). The mixture was put into the aforesaid reactor and heated under 160 ℃ for three days. The reactor was cooled towards room temperature to produce yellow crystals of complex 2 with 62% yield on the foundation of pbm. Anal. Calcd. (%) for C21H12N3O6Zn: H, 2.57; C, 53.88; N, 8.98. Found (%): H, 2.46; C, 53.54; N, 8.63.
2.2.3 Synthetic process of [Mn(pbm)(H3btc)2(H2O)] (3)
2-(2-Pyridyl)benzimidazole (0.3900 g, 0.2 mmol) and trimesic acid (0.0214 g, 0.1 mmol) were supplemented into 5 mL water of MnCl2·2H2O (0.1 mmol, 0.0197 g). The mixture was put into the aforesaid reactor and heated under 160 ℃ for 72 hours. The reactor was cooled to room temperature, and the colorless crystals of complex 3 were acquired with 60% yield based on pbm. Anal. Calcd. (%) for C21H14N3O7Mn: H, 2.95; C, 53.02; N, 8.84. Found (%): H, 2.46; C, 52.14; N, 8.23.
2.2.4 Synthetic process of [Mn(pbm)(5-nip)3] (4)
Complex 4 was obtained in roughly the same way as complex 2. ZnCl2·2H2O (0.01757 g, 0.1 mmol) was utilized by taking the place of MnCl2·2H2O (0.0197 g, 0.1 mmol). It gained light yellow crystals of complex 4 with 62% yield on the foundation of pbm. Anal. Calcd. (%) for C20H12N4O6Mn: H, 2.61; C, 52.26; N, 12.19. Found (%): H, 2.46; C, 52.14; N, 12.09.
2.3 X-ray crystallographic analysis
Single-crystal XRD data for complexes 1~4 were documented via the Bruker Apex CCD diffractometer apparatus, and the graph item is monochromatism radiation with 296(2) K. Multistage technology was used for absorption correction. All structures were settled by Direct Method of SHELXS-97, and specified with the full-matrix least-squares method using the SHELXL-97 program in wings[30]. Table 1 shows the summary of experimental details, crystal data as well as refinement findings. Tables 2~5 list the selected bond lengths together with the bond angles.
Table 1

 DownLoad:
CSV
DownLoad:
CSV
1 2 3 4 Empirical formula C22H13N4O5Zn C21H12N3O6Zn C21H14N3O7Mn C20H12N4O6Mn Formula weight 478.73 467.71 475.29 459.28 Temperature/K 296.15 296.15 293(2) 296.15 Crystal system Monoclinic Monoclinic Triclinic Monoclinic Space group C2/c C2/c P $ \overline 1 $ C2/c a/Å 14.9711(9) 20.214(2) 10.156(9) 20.1574(9) b/Å 22.2205(13) 14.0472(17) 12.088(11) 14.2043(6) c/Å 14.3508(14) 13.9552(16) 12.765(11) 14.1446(6) α/° 90 90 112.668(15) 90 β/° 105.0120(10) 113.863(2) 102.560(17) 114.0330(10) γ/° 90 90 96.464(17) 90 Volume/Å3 4611.1(6) 3623.8(7) 1377(2) 3698.8(3) Z 8 8 2 8 ρcalc (g/cm3) 1.379 1.715 1.146 1.649 μ/mm‑1 1.104 1.405 0.516 0.764 F(000) 1944.0 1896.0 484.0 1864.0 Crystal size/mm3 0.25 × 0.2 × 0.2 0.12 × 0.11 × 0.1 0.14 × 0.13 × 0.1 0.13 × 0.11 × 0.1 Radiation MoKα (λ = 0.71073) MoKα (λ = 0.71073) MoKα (λ = 0.71073) MoKα (λ = 0.71073) 2θ range for data collection/° 3.666 to 52.744 3.642 to 62.534 3.742 to 55.59 3.622 to 56.54 Reflections collected 14728 15504 7023 13478 Independent reflections 4714 (Rint = 0.0397,
Rsigma = 0.0440)5730 (Rint = 0.0456,
Rsigma = 0.0626)5991 (Rint = 0.0719,
Rsigma = 0.1668)4580 (Rint = 0.0178, Rsigma = 0.0195) 2524 Data/restraints/parameters 4714/42/318 5730/4/292 5991/394/305 4580/0/328 Goodness-of-fit on F2 1.085 1.064 1.119 1.105 Final R indexes (I > 2σ(I)) R = 0.0534 R = 0.0562 R = 0.1353, R = 0.0347 Final R indexes (all data) R = 0.0718 R = 0.1042 R = 0.2209 R = 0.0461 wR (all data) 0.1721 0.1771 0.3940 0.1131 Largest diff. peak/hole / e·Å-3 1.29/–0.39 0.87/–0.87 1.42/–1.11 0.40/–0.38 Table 2
Table 2. Selected Bond Lengths (Å) and Bond Angles (°) of Complex 1DownLoad:
CSV
Bond Dist. Bond Dist. Zn(1)–O(1) 1.981(3) Zn(1)–N(2) 2.071(4) Zn(1)–O(4)1 2.019(3) Zn(1)–N(1) 2.275(4) Zn(1)–O(5)2 2.007(3) Angle (°) Angle (°) O(1)–Zn(1)–O(4)1 103.06(13) O(5)2–Zn(1)–Zn(1) 84.88(14) O(1)–Zn(1)–O(5)2 93.38(12) N(2)–Zn(1)–N(1) 75.40(15) O(1)–Zn(1)–N(2) 115.85(13) O(4)–1Zn(1)–N(2) 94.78(14) O(1)–Zn(1)–N(1) 95.19(14) O(4)1–Zn(1)–N(1) 161.67(14) O(5)2–Zn(1)–O(4)1 95.65(13) O(5)2–Zn(1)–N(2) 145.68(14) 11/2+x, 1/2–y, 1/2+z; 2 1/2–x, 1/2–y, 1–z; 3 –1/2+x, 1/2–y, –1/2+z Table 3
Table 3. Selected Bond Lengths (Å) and Bond Angles (°) of Complex 2DownLoad:
CSV
Bond Dist. Bond Dist. Zn(1)–O(1) 1.9477(19) Zn(1)–N(2) 2.141(2) Zn(1)–O(6)1 2.023(2) O(6)–Zn(1)1 2.023(2) Zn(1)–O(5)2 2.093(2) O(5)–Zn(1)3 2.093(2 Zn(1)–N(1) 2.069(2) Angle (°) Angle (°) O(1)–Zn(1)–O(5)2 97.75(9) O(6)1–Zn(1)–N(1) 96.73(9) O(1)–Zn(1)–N(1) 116.63(9) O(6)1–Zn(1)–N(2) 161.92(8) O(1)–Zn(1)–N(2) 101.16(8) O(5)2–Zn(1)–N(2) 88.09(8) O(6)1–Zn(1)–O(5)2 86.54(9) 1 1–x, 1–y, 1–z; 2 x, 1–y, –1/2+z; 3 x, 1–y, 1/2+z Table 4
Table 4. Selected Bond Lengths (Å) and Bond Angles (°) of Complex 3DownLoad:
CSV
Bond Dist. Bond Dist. Mn(1)–O(2)1 2.237(7) Mn(1)–O(5) 2.216(6) Mn(1)–O(7) 2.180(8) Mn(1)–N(11) 2.351(8) Mn(1)–N(13) 2.209(8) Angle (°) Angle (°) O(2)1–Mn(1)–N(11) 136.4(3) O(5)–Mn(1)–O(2)1 84.4(2) O(5)–Mn(1)–N(11) 137.0(3) O(7)–Mn(1)–O(2)1 96.2(3) O(7)–Mn(1)–O(5) 97.4(3) O(7)–Mn(1)–N(11) 91.6(3) O(7)–Mn(1)–N(13) 163.7(3) N(13)–Mn(1)–O(2)1 98.1(3) N(13)–Mn(1)–O(5) 91.8(3) N(13)–Mn(1)–N(11) 72.6(3) 1 –1+x, y, z; 2 1+x, y, z Table 5
Table 5. Selected Bond Lengths (Å) and Bond Angles (°) of Complex 4DownLoad:
CSV
Bond Dist. Bond Dist. Mn(1)–O(1) 2.0291(14) Mn(1)–O(5)1 2.1415(15) Mn(1)–O(6)2 2.0828(14) Mn(1)–N(2) 2.1853(14) Mn(1)–N(3) 2.2446(15) Angle (°) Angle (°) O(1)–Mn(1)–O(5)1 99.36(7) O(1)–Mn(1)–O(6)2 101.88(6) O(1)–Mn(1)–N(2) 114.63(6) O(1)–Mn(1)–N(3) 100.29(6) O(5)1–Mn(1)–N(2) 144.00(6) O(5)1–Mn(1)–N(3) 88.63(6) O(6)2–Mn(1)–O(5)1 87.58(6) O(6)2–Mn(1)–N(2) 96.28(6) O(6)2–Mn(1)–N(3) 157.83(6) N(2)–Mn(1)–N(3) 74.50(6) 1 x, 1–y, –1/2+z; 2 1–x, 1–y, 1–z; 3 x, 1–y, 1/2+z 2.4 DNA binding studies
DNA binding experiments included ultraviolet, fluorescent, and CD spectroscopic analyses and viscometric analyses. The level of CT-DNA should be continuously increased and was added into the mixed solution when measuring the ultraviolet spectroscopy and fluorescence spectrum. The measuring of viscosity was completed via an Ubbelohde viscometric device in the water bath sustained at 20 ℃ to increase the concentration of the metal complex.
3. RESULTS AND DISCUSSION
3.1 Crystal structure description
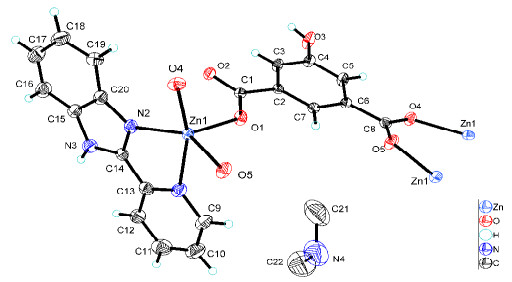
Single-crystal X-ray diffraction analyses reveal that complex 1 crystallizes in space group C2/c. The asymmetric unit of 1 contains one central metal atom Zn, three HIPA2- anions, and one pbm ligand, as shown in Fig. 1. The Zn2+ center is regarded as a typical five-coordinate environment coordinated with three oxygen atoms from three HIPA2- anions and two nitrogen atoms from a pbm ligand. The Zn–O and Zn–N bonds are various from 1.981(3) to 2.019(3) Å and from 2.071(4) to 2.275(4) Å, which can be compared to the reported complexes. The asymmetric units are linked together through bridging acid ligand with two different coordination modes from two carboxylic groups, i.e., μ1-ƞ1 and μ2-ƞ2 bidentate bridging respectively, creating an infinite chain running along with the [101] orientation, as depicted in Fig. 2. Besides, the chelating pbm ligand with a dihedral angle of 2.016(92)° is nearly parallel to each other.
Figure 1
 Figure 1. Molecular structure of complex 1 showing 50% displacement ellipsoids
Figure 2
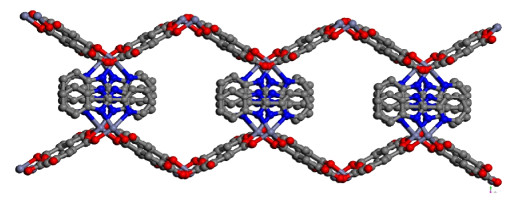
 Figure 2. Packing diagram of complex 1 in a unit cell viewed along the a axis
The geometry of the Zn center is between the ideal square pyramidal (SP) and trigonal bipyramidal (TBP) configuration with τ index of 26.65% (τ = 0% for perfect SP and τ = 100% for ideal TBP geometry). Thus, the Zn center could be regarded as SP coordination geometry with some distortion, in which the O(1) atom acts as the apical axis, and N(1), N(2), O(4) and O(5) atoms as the low plane. The adjacent angles in the equatorial plane atoms are 82.2(2)°~93.45(19)°.
Similar to 1, the crystal of complex 2 crystallizes in monoclinic space group C2/c. The asymmetric unit of 2 contains one Zn ion, three nip2- anions, and one pbm ligand (Fig. 3). The Zn2+ center is also five-coordinated with Zn–O and Zn–N bonds to be 1.9477(19), 2.023(2), 2.093(2) Å and 2.069(2) and 2.141(2) Å, respectively. Zn atoms are linked with each other by carboxylic acid ligand to produce a 1D chain structure infinitely propagating along the direction (Fig. 4).
Figure 3
 Figure 3. Molecular structure of complex 2 showing 50% displacement ellipsoids
Figure 4
 Figure 4. Packing diagram of complex 2 in a unit cell viewed along the a axis
Complexes 3 and 4 crystallize in monoclinic space group P
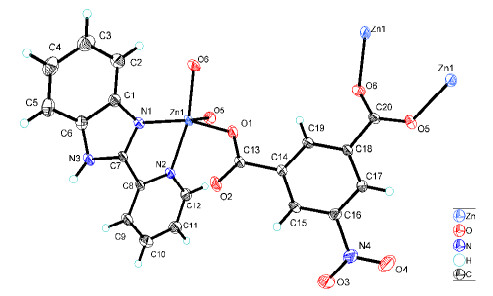
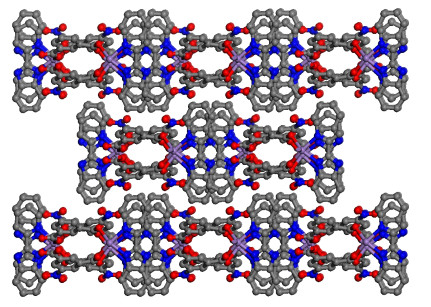
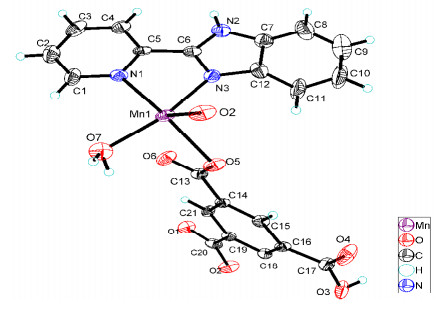
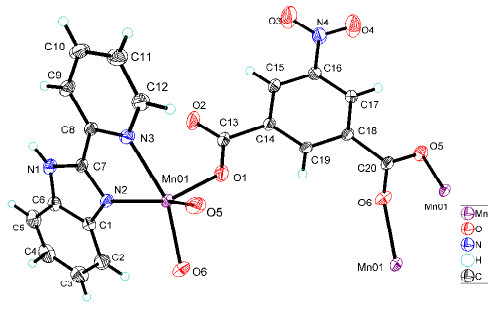
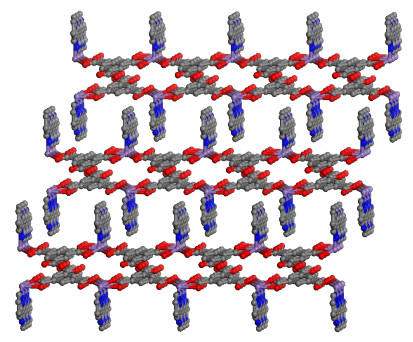
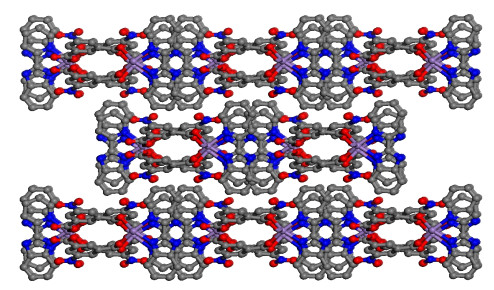
$ \overline 1 $ and C2/c, respectively. The asymmetric units of them contain one pbm ligand. Besides, complex 3 consists of one crystallographically unique Mn(II) atom, one pbm ligand, two carboxylic acid ligands and one coordinated water molecule. Complex 4 contains one center metal atom Mn, three nip2- anions and one pbm ligand, as shown in Figs. 5 and 6. As a typical five-coordinate environment, Mn2+ coordinates with three nip2- anions, two nitrogen atoms, and three oxygen atoms in a pbm ligand. For 3, the Mn–O bonds are various from 2.180(8) to 2.237(7) Å, and the Mn–N bonds from 2.209(8) to 2.351(8) Å. For complex 4, the Mn–O bonds change from 2.0291(14) to 2.1415(15) Å and the Mn–N bonds fall in the 2.1853(14)~2.2446(15) Å. In fact, the oxygen atoms on two carboxyl groups connect two Mn(II) ions in order to form the 1D chain. In addition, neighboring one-dimensional chains are linked with a nitrogen atom to generate a two-dimensional plane (Figs. 7 and 8).Figure 5
 Figure 5. Molecular structure of complex 3 showing 50% displacement ellipsoids
Figure 6
 Figure 6. Molecular structure of complex 4 showing 50% displacement ellipsoids
Figure 7
 Figure 7. Packing diagram of complex 3 in a unit cell viewed along the a axis
Figure 8
 Figure 8. Packing diagram of complex 4 in a unit cell viewed along the a axis
3.2 Characterization of the complex
3.2.1 Thermal analysis
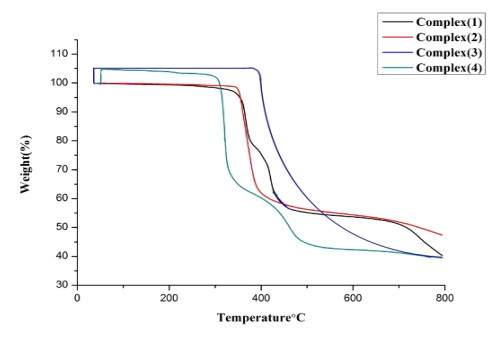
The thermostability of complexes 1~4 was investigated by TGA measurement (Fig. 9), finished using specimens comprising substantial single crystals of complexes 1~4 in N2 environment at a heating rate of 10 ℃·h-1. For 1, no apparent weight loss was observed before the decomposition of the framework occurring at ca. 325 ℃, with the remaining weight corresponding to the formation of ZnO. Complex 1 shows a weight loss of 83.08%. For 2, the framework decomposes at ca. 340 ℃. The remaining weight corresponds to the formation of ZnO. For 3, the organic composition is decomposed completely at ca. 380 ℃, and the remaining weight comes from the formation of MnO. Complex 3 shows a weight loss of 84.5%. Complex 4 experienced a two-step weight loss. The first one at about 296 ℃ with a weight loss from 296 to 416 ℃ is due to the decomposition of carboxylic acid ligand with a weight loss of 46.44% (theoretical value: 46.83%). The second one between 416 and 513 ℃ is 35.61%, corresponding to the decomposition of nitrogen-containing ligand (theoretical value: 37.78%).
Figure 9
 Figure 9. TG curves of complexes 1~4
3.2.2 XRD analysis
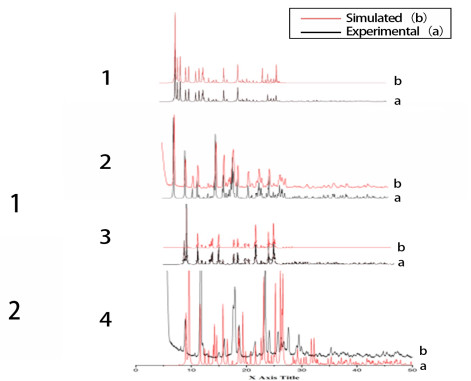
The experimental and simulated powder XRD patterns of complexes 1~4 are shown in Fig. 10, indicating the practical powder of XRD patterns is consistent with the powder XRD patterns simulated according to the structural data, and the pure phase of the synthesized product is determined.
Figure 10
 Figure 10. Simulated and experimental XRPD patterns of complexes 1~4
3.3 Absorption spectral studies of DNA binding
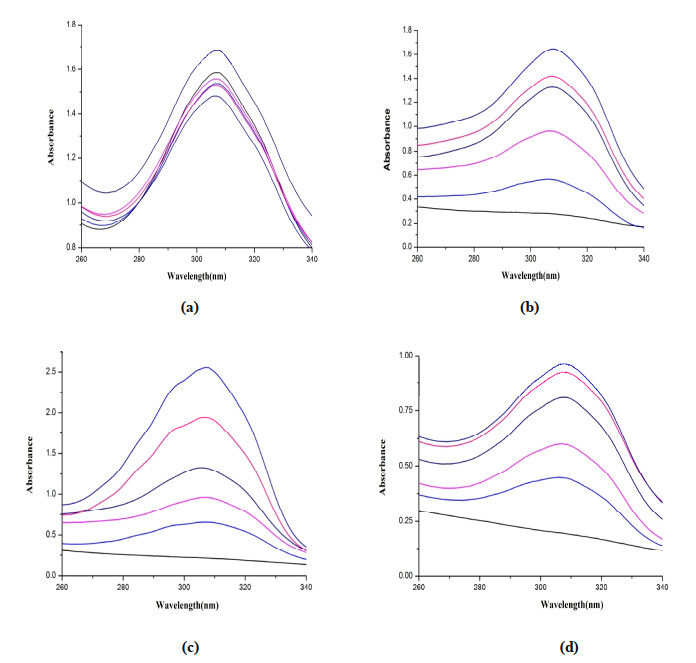
Ultraviolet spectroscopy plays an essential role in detecting the interaction mode between complexes with DNA[31]. Under normal circumstances, the absorption peak of the complex will show a decreased intensity, and the wavelength will exhibit an obvious red shift phenomenon after adding the DNA[32]. In the meantime, the energy level decreased after coupling leads to the weakening of π-π* transition and the red shift phenomenon. In addition, when molecules react with DNA in the groove mode, the wavelength is red-shifted, and the color decrease role is not distinct[33, 34]. Meanwhile, with the increase of DNA concentration, the DNA helical structure is destroyed due to the combination of the complex, and its absorption spectrum is increased artificially with the rise of DNA concentration[35]. The UV-visible spectra were measured after the interaction of complexes 1~4 of DNA, as shown in Fig. 11. The picture shows that the maximum absorption peak of the complex increases with increasing the amount of DNA. The complexes have an excellent absorption band at 310 nm, but there is no blue or red shift. Hence, these complexes may have electrostatic effects on DNA.
Figure 11
 Figure 11. Absorption spectra of complexes 1~4, corresponding to (a) to (d) in turn, in tris-HCl buffer (pH 7.0) in the absence and presence of increasing amount of DNA at room temperature
3.4 Fluorescent fluorescence measurements of DNA binding
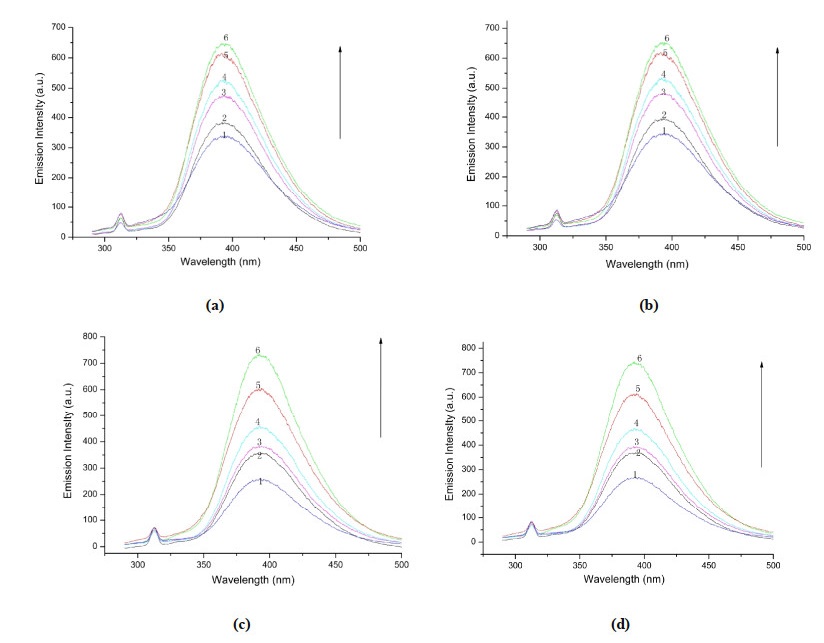
The interplay between the complex and CT-DNA was studied through emission titration. In complex solution with a specific concentration, the emission spectra of complexes 1~4 are shown in Fig. 12. With increasing the concentration of CT-DNA, the complex shows strong fluorescence at 395 nm when excited at 285 nm at room temperature. In addition, when the concentration of CT-DNA is increased to a certain amount, the fluorescence emission intensity increases continuously due to the environment of the metal complex changes and the different degree of the internal hydrophobic environment when the compound interacts with DNA, but the location of the emission band does not change significantly. It avoids the quenching effect of solvent water molecules and limits the fluidity of compounds at the binding site, thus reducing the relaxation vibration mode and increasing the emission intensity.
Figure 12
 Figure 12. Emission spectra of complexes 1~4, corresponding to (a) to (d) in turn, in tris-HCl buffer (pH 7.0) in the absence and presence of increasing amount of DNA at room temperature
3.5 Viscosity studies of DNA binding
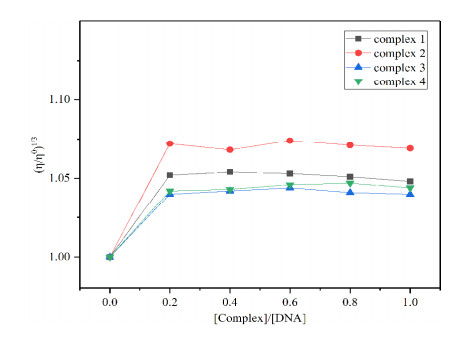
To study the interplay of the complexes with CT-DNA, viscosity tests were carried out. This method is more convincing than the spectroscopic method, which can better indicate whether the interaction model between the complexes and DNA is in an intercalated manner[36]. If the complex is inserted into DNA and interacted with it, the distance between the base pairs will increase to allow the ligand to enter, therefore resulting in an increase in the solution viscosity. When the complex binds to DNA in a non-insertion mode, the DNA spirals away, which shortens the length and results in little change in the viscosity of DNA at different concentrations[37, 38]. The viscometer was placed in a constant temperature water bath at 30.0 ± 0.1 ℃. The blank solution was 15 mL tris and the flow time (t0) was determined. Then measure the flow time (t) of 15 mL CT-DNA and metal complex mixture solution through the capillary tube in different proportions ([complex]/[DNA] = 0.0~1.0). The relative viscosity was calculated according to the following formula: Ƞ = (t – t0)/t0.
The viscosity curve of the interplay between complexes 1~4 and DNA is depicted in Fig. 13. It fluctuates up and down in a straight line, indicating that the interplay mode between the complex and DNA is electrostatic interaction or groove binding and it is very similar to the results obtained by spectral analysis.
Figure 13
 Figure 13. Relative viscosity of CT-DNA upon the addition of increasing amounts of complexes 1~4 (r = 0.0~1.0). η is the viscosity of DNA in the presence of complex, and η0 is the viscosity of DNA alone
Figure 14
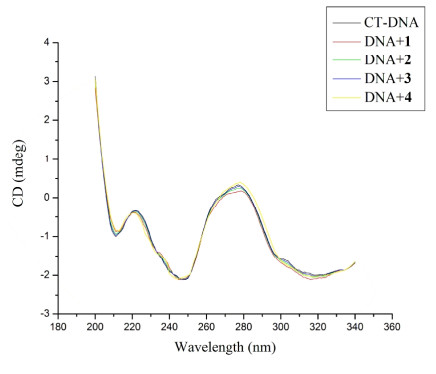
 Figure 14. Circular dichromatic spectra of interactions between complexes 1~4 and DNA
3.6 Circular dichromatic (CD) spectroscopy
CD spectroscopy is one of the methods to study the conformational change of DNA[39]. The CT-DNA has two apparent peaks in the CD spectrum. The negative peak at 246 nm is mainly caused by the right-handed helicity of DNA, and a positive peak at 272 nm is due to base stacking[40]. The interaction model of DNA and metal complex is determined by the change of peak position of the CD spectrum. If the binding model of the complex and DNA displays an insertion manner, the parts of the two peaks will change obviously. In case of electrostatic interaction or groove binding, the parts of the two peaks will not change significantly[41]. The concentration of CT-DNA is fixed at 100 μmol·L-1, and the concentration of the complex gradually increases. The reaction system is placed at room temperature for 1 h, and the circular dichroism spectrum of DNA is determined. With or without complexes 1~4, the CD spectra are shown in Fig. 14, where the negative and positive peaks at 246 and 272 nm respectively do not change significantly after interacting with DNA. The results show that complexes 1~4 only have a weak effect on the helicity and base pair stacking of DNA, and the interaction between these complexes and DNA can be determined as groove binding or electrostatic interaction.
4. CONCLUSION
In this study, four new complexes with 2-(2-pyridyl)benzimidazole as the main ligand were synthesized and their crystal structures were studied. The interaction between CT-DNA and the complex was studied by absorption spectrum, fluorescence spectrum, circular dichromatic spectroscopy and viscosity measurement. The results showed that the interaction mode between CT-DNA and the complex is electrostatic interaction or groove bonding. As these findings harbor certain potential implications for researches on anticancer drugs, we wish to offer some meaningful enlightenment for the exploration of anti-tumor medicines.
-
-
[1]
Gao, J.; Wei, K. J.; Ni, J.; Zhang, J. Z. Anion effect on construction of two Cd(II) coordination polymers with phenylformic acid-imidazole ditopic ligand: hydrothermal synthesis, crystal structure and antimicrobial activity. J. Coord. Chem. 2009, 62, 257–265. doi: 10.1080/00958970802206777
-
[2]
Xu, D. J.; Zhang, C. G.; Liu, J. G. A small Jahn-teller distortion around a Cu(II) atom crystal structure of bis(N, N′-dimethyl-formamide)bis (1, 1, 1, 5, 5, 5-hexafluoro-2, 4-pentanedionato) Co(II). J. Coord. Chem. 2000, 50, 73–78. doi: 10.1080/00958970008054926
-
[3]
Marichev, K. O.; Patil, S. A.; Bugarin, A. Recent advances in the synthesis, structural diversity, and applications of mesoionic 1, 2, 3-triazol-5-ylidene metal complexes. Tetrahedron 2018, 74, 2523–2546. doi: 10.1016/j.tet.2018.04.013
-
[4]
Hong, J. C.; Xiao, M. C. Crystal structures of two- and three-dimensional polymeric complexes assembled by metal pseudohalides and 4-aminobenzoic acid via hydrogen bonds and covalent bonds. Inorg. Chim. Acta 2000, 329, 13–21. https://www.sciencedirect.com/science/article/pii/S0020169301007915
-
[5]
Chand, B. G.; Ray, U. S.; Mostafa. G.; Cheng, J.; Lu, T. H.; Sinha, C. Difference in bonding behaviour of azide and thiocyanate to Hg(II)-azoimidazoles. Inorg. Chim. Acta 2005, 358, 1927–1933. doi: 10.1016/j.ica.2004.12.046
-
[6]
Mansour, A. M.; Abdel, N. T. Molecular structures of antitumor active Pd(II) and Pt(II) complexes of N, N-donor benzimidazole methyl ester. J. Coord. Chem. 2021, 65, 763–779. doi: 10.1080/00958972.2012.661048
-
[7]
Pedro, M. T.; Lidervan, P. M.; Regina, C. G. F.; Adelino, V. G. N.; Antonio, E. M.; Regina, H. A. S.; Janaina, G. F. Self-assembly of metallosupramolecules directed by (N–H)2SCN-M (M = Co, Ni), C–H···π and π-π synthons. J. Mol. Struct. 2006, 783, 161–167. doi: 10.1016/j.molstruc.2005.08.031
-
[8]
Nematollah, A.; Adile, A.; Eskandar, A.; Arsalan, P.; Alireza, F.; Saeed, E. 1-[(2-Arylthiazol-4-yl)methyl] azoles as a new class of anticonvulsants: design, synthesis, in vivo, screening, and in silico, drug-like properties. Chem. Biol. Drug Des. 2011, 78, 844–852. doi: 10.1111/j.1747-0285.2011.01211.x
-
[9]
Katarzyna, G.; Henryk, F.; Krzysztof, B. Synthesis of novel 3-cyclohexylpropanoic acid-derived nitrogen heterocyclic compounds and their evaluation for tuberculostatic activity. Bioorg. Med. Chem. 2012, 20, 137–144. doi: 10.1016/j.bmc.2011.11.020
-
[10]
Wu, R. F.; Shi, H. P.; Zhang, J. R.; Chang, F. F. A novel 3D energetic coordination polymer containing Co(II) atoms in a pentanuclear cluster. J. Struct. Chem. 2015, 56, 1136–1142. doi: 10.1134/S0022476615060177
-
[11]
Li, F. W.; Hor, T. S. A. Benzimidazolium-pyrazole-palladium(II) complexes: new and efficient catalysts for suzuki, heck and sonogashira reactions. Adv. Synth. Catal. 2008, 350, 2391–2400. doi: 10.1002/adsc.200800356
-
[12]
Chen, J. M.; Li, S.; Lu, T. B. Pharmaceutical cocrystals of ribavirin with reduced release rates. Cryst. Growth Des. 2014, 14, 6399–6408. doi: 10.1021/cg501247x
-
[13]
Xiao, G. Y.; Chi, H. J.; Lu, Y. H.; Dong, Y.; Hu, Z. Z.; Yu, J. L.; Kimura, M. Synthesis and photophysical characterization of orange-emitting iridium(III) complexes containing benzothiazole ligand. Synth. Met. 2012, 162, 497–502. doi: 10.1016/j.synthmet.2012.01.014
-
[14]
Alfaif, M. Y.; Elbehairi, S. E. I.; Hafez, H. S. Spectroscopic exploration of binding of new imidazolium-based palladium(II) saldach complexes with CT-DNA as anticancer agents against HER2/neu overexpression. J. Mol. Struct. 2019, 1191, 118–128. doi: 10.1016/j.molstruc.2019.04.119
-
[15]
Facchinetti, V.; Reis, R. R.; Gomes, C. R. B.; Vasconcelos, T. R. A. Chemistry and biological activities of 1, 3-benzothiazoles. Mini-Rev. Org. Chem. 2012, 9, 44–53. doi: 10.2174/157019312799079929
-
[16]
Weekes, A. A.; Westwell, A. D. 2-Arylbenzothiazole as a privileged scaffold in drug discovery. Curr. Med. Chem. 2009, 16, 2430–2440. doi: 10.2174/092986709788682137
-
[17]
Gamov, G. A.; Zavalishin, M. N.; Sharnin, V. A. Comment on the frequently used method of the metal complex-DNA binding constant determination from UV-Vis data. Goergens. Chem. Abstr. 2019, 206, 160–164. https://www.sciencedirect.com/science/article/pii/S1386142518307790
-
[18]
Somnath, D.; Alexander, E.; Chandan, G.; Kari, R.; Helge, L. Electronic structure manipulation of (benzothiazole)zinc complexes: synthesis, optical and electrochemical studies of 5-substituted derivatives. Eur. J. Org. Chem. 2011, 6226–6232. doi: 10.1002/ejoc.201100186
-
[19]
Hegde, D.; Naik, G. N.; Vadavi, R. S.; Kumar, V. S.; Barretto, D. A.; Gudasi, K. B. Transition metal complexes of N΄-(2-(hydroxyimino) propanoyl) sonicotinohydrazide: synthesis, characterization, DNA interaction and anticancer evaluation. Inorg. Chim. Acta 2017, 461, 301–315. doi: 10.1016/j.ica.2017.02.034
-
[20]
Li, S.; Miao, T. F.; Fu, X. L.; Ma, F.; Gao, H.; Zhang, G. P. Theoretical study on the DNA interaction properties of copper(II) complexes. Comput. Biol. Chem. 2019, 80, 244–248. doi: 10.1016/j.compbiolchem.2019.03.021
-
[21]
Marzieh, A.; Masoud, T. M. In vitro DNA and BSA-binding, cell imaging and anticancer activity against human carcinoma cell lines of mixed ligand copper(II) complexes. Spectrochimi. Acta, Part A 2015, 150, 390–402. doi: 10.1016/j.saa.2015.05.076
-
[22]
Pyle, A. M.; Morii, T.; Barton, J. K. Probing microstructures in double-helical DNA with chiral metal complexes: recognition of changes in base-pair propeller twisting in solution. J. Am. Chem. Soc. 1990, 25, 9432–9434.
-
[23]
Sama, F.; Raizada, M.; Ashafaq, M.; Ahamad, M. N.; Shahid, M.; Arif, R.; Shah, N. A.; Saleh, H. A. M. Synthesis, structure and DNA binding properties of a homodinuclear Cu(II) complex: an experimental and theoretical approach. J. Mol. Struct. 2019, 1176, 2283–2289. https://www.sciencedirect.com/science/article/pii/S0022286018310305
-
[24]
Shana, O. K.; Jacqueline, K. B. Electron transfer between bases in double helical DNA. Science 1999, 283, 375–381. doi: 10.1126/science.283.5400.375
-
[25]
Hou, T. T.; Bian, J. Y.; Yue, X. R.; Yue, S. M.; Ma, J. F. Synthesis, crystal structure, photoluminescence and theoretical studies of a series of copper compounds based on imidazole derivatives. Inorg. Chim. Acta 2013, 394, 15–20. doi: 10.1016/j.ica.2012.07.020
-
[26]
Metcalfe, C.; Thomas, J. A. Kinetically inert transition metal complexes that reversibly bind to DNA chemical society reviews. Chem. Soc. Rev. 2003, 4, 215–224. https://pubs.rsc.org/en/content/articlelanding/2003/cs/b201945k#!
-
[27]
Dewan, J. C. Binding of the antitumor drug cis-diamminedichloroplatinum to crystalline tRNAPhe at 6-. ANG. Resolution. J. Am. Chem. Soc. 1984, 106, 7239–7244. doi: 10.1021/ja00335a063
-
[28]
Hou, T. T.; Yue, S. M.; Yue, X. R.; Ma, J. F. Syntheses, crystal structures, and properties of nickel and cadmium complexes containing imidazole derivatives. J. Coord. Chem. 2012, 65, 22, 3895–3902.
-
[29]
Yue, S. M.; Qi, S.; Li, Y. H.; Yang, Y. Syntheses, crystal structures and DNA-binding properties of Zn(II), Ni(II) and Co(II) compounds containing thiazole derivatives. J. Struct. Chem. 2018, 37, 1945–1959.
-
[30]
Sharma, S.; Sharma, P. K.; Kumar, N.; Dudhe, R. A review on various heterocyclic moieties and their antitubercular activity. Biomed. Pharmacother. 2011, 65, 244–251. doi: 10.1016/j.biopha.2011.04.005
-
[31]
Pyle, A. M.; Rehmann, J. P.; Meshoyrer, R.; Kumar, C. V.; Turro, N. J. Mixed-ligand complexes of ruthenium(II): factors governing binding to DNA. Am. Chem. Soc. 1989, 111, 3051–3058. doi: 10.1021/ja00190a046
-
[32]
Zhang, Y. Y.; Jia, L. M.; Zhou, C. H.; Zhou, X. D. Synthesis of novel fluconazoliums and their evaluation for antibacterial and antifungal activities. J. Eur. Med. Chem. 2011, 46, 4391–4402. doi: 10.1016/j.ejmech.2011.07.010
-
[33]
Tysoe, S. A.; Morgan, R. J.; Baker, A. D.; Strekas, T. S. Spectroscopic investigation of differential binding modes of △- and Ru(bpy)2(ppz)2+ with calf thymus DNA. J. Phys. Chem. 1993, 97, 1707–171. doi: 10.1021/j100110a038
-
[34]
Ding, P. P.; Wang, Y.; Kou, H. Z.; Li, J. F.; Shi, B. X. Synthesis of heterobinuclear Cu(Ⅱ)-Ni(Ⅱ) complex: structure, CT-DNA interaction, hydrolytic function and antibacterial studies. J. Mol. Struct. 2019, 1196, 836–843. doi: 10.1016/j.molstruc.2019.06.081
-
[35]
Satyanarayana, S.; Dabrowiak, J. C.; Chaires, J. B. Tris(phenanthroline)ruthenium(II) enantiomer interactions with DNA: mode and specificity of binding. Biochemistry 1993, 32, 2573–2584. doi: 10.1021/bi00061a015
-
[36]
Saeidifar, M.; Mirzaei, H.; Nasab, N. A.; Torshizi, H. M. Mononuclear Pd(II) complex as a new therapeutic agent: synthesis, characterization, biological activity, spectral and DNA binding approaches. J. Mol. Struct. 2017, 1148, 339–346. doi: 10.1016/j.molstruc.2017.06.139
-
[37]
Shankaraiah, N.; Jadala, C.; Nekkanti, S.; Senwar, K. R.; Nagesh, N.; Shrivastava, S. Design and synthesis of C3-tethered 1, 2, 3-triazolo-β-carboline derivatives: anticancer activity, DNA-binding ability, viscosity and molecular modeling studies. Bioorg. Chem. 2016, 64, 42–50. https://www.sciencedirect.com/science/article/pii/S0045206815300365
-
[38]
Kumar, C. V.; Asuncion, E. H. DNA binding studies and site selective fluorescence sensitization of an anthryl probe J. Am. Chem. Soc. 1993, 115, 8547–8553. doi: 10.1021/ja00072a004
-
[39]
Wang, Z. X.; Liu, D. J.; Dong, S. J. Voltammetric and spectroscopic studies on methyl green and cationic lipid bound to calf thymus DNA. Biophys Chem. 2000, 87, 179–184. doi: 10.1016/S0301-4622(00)00191-5
-
[40]
Röcker, C.; Pötzl, M.; Zhang F. A quantitative fluorescence study of protein monolayer formation on colloidal nanoparticles. Nature Nanotech. 2009, 4, 577–580. doi: 10.1038/nnano.2009.195
-
[41]
Wang, Y. G.; Zhang, Z.; Wang, H.; Liu, H. Y. Phosphorus(V) corrole: DNA binding, photonuclease activity and cytotoxicity toward tumor cells. Bioorg. Chem. 2016, 67, 57–63. https://www.sciencedirect.com/science/article/pii/S0045206816300505
-
[1]
-
Figure 11 Absorption spectra of complexes 1~4, corresponding to (a) to (d) in turn, in tris-HCl buffer (pH 7.0) in the absence and presence of increasing amount of DNA at room temperature
Figure 12 Emission spectra of complexes 1~4, corresponding to (a) to (d) in turn, in tris-HCl buffer (pH 7.0) in the absence and presence of increasing amount of DNA at room temperature
Figure 13 Relative viscosity of CT-DNA upon the addition of increasing amounts of complexes 1~4 (r = 0.0~1.0). η is the viscosity of DNA in the presence of complex, and η0 is the viscosity of DNA alone
Table 1. Crystal Data and Structure Refinement for Complexes 1~4
1 2 3 4 Empirical formula C22H13N4O5Zn C21H12N3O6Zn C21H14N3O7Mn C20H12N4O6Mn Formula weight 478.73 467.71 475.29 459.28 Temperature/K 296.15 296.15 293(2) 296.15 Crystal system Monoclinic Monoclinic Triclinic Monoclinic Space group C2/c C2/c P $ \overline 1 $ C2/c a/Å 14.9711(9) 20.214(2) 10.156(9) 20.1574(9) b/Å 22.2205(13) 14.0472(17) 12.088(11) 14.2043(6) c/Å 14.3508(14) 13.9552(16) 12.765(11) 14.1446(6) α/° 90 90 112.668(15) 90 β/° 105.0120(10) 113.863(2) 102.560(17) 114.0330(10) γ/° 90 90 96.464(17) 90 Volume/Å3 4611.1(6) 3623.8(7) 1377(2) 3698.8(3) Z 8 8 2 8 ρcalc (g/cm3) 1.379 1.715 1.146 1.649 μ/mm‑1 1.104 1.405 0.516 0.764 F(000) 1944.0 1896.0 484.0 1864.0 Crystal size/mm3 0.25 × 0.2 × 0.2 0.12 × 0.11 × 0.1 0.14 × 0.13 × 0.1 0.13 × 0.11 × 0.1 Radiation MoKα (λ = 0.71073) MoKα (λ = 0.71073) MoKα (λ = 0.71073) MoKα (λ = 0.71073) 2θ range for data collection/° 3.666 to 52.744 3.642 to 62.534 3.742 to 55.59 3.622 to 56.54 Reflections collected 14728 15504 7023 13478 Independent reflections 4714 (Rint = 0.0397,
Rsigma = 0.0440)5730 (Rint = 0.0456,
Rsigma = 0.0626)5991 (Rint = 0.0719,
Rsigma = 0.1668)4580 (Rint = 0.0178, Rsigma = 0.0195) 2524 Data/restraints/parameters 4714/42/318 5730/4/292 5991/394/305 4580/0/328 Goodness-of-fit on F2 1.085 1.064 1.119 1.105 Final R indexes (I > 2σ(I)) R = 0.0534 R = 0.0562 R = 0.1353, R = 0.0347 Final R indexes (all data) R = 0.0718 R = 0.1042 R = 0.2209 R = 0.0461 wR (all data) 0.1721 0.1771 0.3940 0.1131 Largest diff. peak/hole / e·Å-3 1.29/–0.39 0.87/–0.87 1.42/–1.11 0.40/–0.38  下载: 导出CSV
Table 2. Selected Bond Lengths (Å) and Bond Angles (°) of Complex 1
Bond Dist. Bond Dist. Zn(1)–O(1) 1.981(3) Zn(1)–N(2) 2.071(4) Zn(1)–O(4)1 2.019(3) Zn(1)–N(1) 2.275(4) Zn(1)–O(5)2 2.007(3) Angle (°) Angle (°) O(1)–Zn(1)–O(4)1 103.06(13) O(5)2–Zn(1)–Zn(1) 84.88(14) O(1)–Zn(1)–O(5)2 93.38(12) N(2)–Zn(1)–N(1) 75.40(15) O(1)–Zn(1)–N(2) 115.85(13) O(4)–1Zn(1)–N(2) 94.78(14) O(1)–Zn(1)–N(1) 95.19(14) O(4)1–Zn(1)–N(1) 161.67(14) O(5)2–Zn(1)–O(4)1 95.65(13) O(5)2–Zn(1)–N(2) 145.68(14) 11/2+x, 1/2–y, 1/2+z; 2 1/2–x, 1/2–y, 1–z; 3 –1/2+x, 1/2–y, –1/2+z
下载: 导出CSV
Table 3. Selected Bond Lengths (Å) and Bond Angles (°) of Complex 2
Bond Dist. Bond Dist. Zn(1)–O(1) 1.9477(19) Zn(1)–N(2) 2.141(2) Zn(1)–O(6)1 2.023(2) O(6)–Zn(1)1 2.023(2) Zn(1)–O(5)2 2.093(2) O(5)–Zn(1)3 2.093(2 Zn(1)–N(1) 2.069(2) Angle (°) Angle (°) O(1)–Zn(1)–O(5)2 97.75(9) O(6)1–Zn(1)–N(1) 96.73(9) O(1)–Zn(1)–N(1) 116.63(9) O(6)1–Zn(1)–N(2) 161.92(8) O(1)–Zn(1)–N(2) 101.16(8) O(5)2–Zn(1)–N(2) 88.09(8) O(6)1–Zn(1)–O(5)2 86.54(9) 1 1–x, 1–y, 1–z; 2 x, 1–y, –1/2+z; 3 x, 1–y, 1/2+z
下载: 导出CSV
Table 4. Selected Bond Lengths (Å) and Bond Angles (°) of Complex 3
Bond Dist. Bond Dist. Mn(1)–O(2)1 2.237(7) Mn(1)–O(5) 2.216(6) Mn(1)–O(7) 2.180(8) Mn(1)–N(11) 2.351(8) Mn(1)–N(13) 2.209(8) Angle (°) Angle (°) O(2)1–Mn(1)–N(11) 136.4(3) O(5)–Mn(1)–O(2)1 84.4(2) O(5)–Mn(1)–N(11) 137.0(3) O(7)–Mn(1)–O(2)1 96.2(3) O(7)–Mn(1)–O(5) 97.4(3) O(7)–Mn(1)–N(11) 91.6(3) O(7)–Mn(1)–N(13) 163.7(3) N(13)–Mn(1)–O(2)1 98.1(3) N(13)–Mn(1)–O(5) 91.8(3) N(13)–Mn(1)–N(11) 72.6(3) 1 –1+x, y, z; 2 1+x, y, z
下载: 导出CSV
Table 5. Selected Bond Lengths (Å) and Bond Angles (°) of Complex 4
Bond Dist. Bond Dist. Mn(1)–O(1) 2.0291(14) Mn(1)–O(5)1 2.1415(15) Mn(1)–O(6)2 2.0828(14) Mn(1)–N(2) 2.1853(14) Mn(1)–N(3) 2.2446(15) Angle (°) Angle (°) O(1)–Mn(1)–O(5)1 99.36(7) O(1)–Mn(1)–O(6)2 101.88(6) O(1)–Mn(1)–N(2) 114.63(6) O(1)–Mn(1)–N(3) 100.29(6) O(5)1–Mn(1)–N(2) 144.00(6) O(5)1–Mn(1)–N(3) 88.63(6) O(6)2–Mn(1)–O(5)1 87.58(6) O(6)2–Mn(1)–N(2) 96.28(6) O(6)2–Mn(1)–N(3) 157.83(6) N(2)–Mn(1)–N(3) 74.50(6) 1 x, 1–y, –1/2+z; 2 1–x, 1–y, 1–z; 3 x, 1–y, 1/2+z
下载: 导出CSV
-


 扫一扫看文章
计量
- PDF下载量: 9
- 文章访问数: 1591
- HTML全文浏览量: 111
