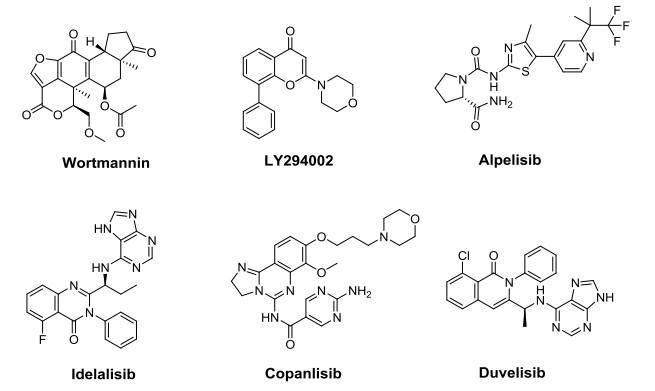
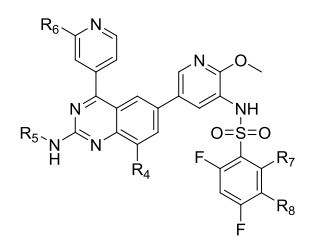
Figure 1.
Chemical structures of representative PI3Ks inhibitors
3D-QSAR, Molecular Docking and Molecular Dynamics Simulations of 3-Phenylsulfonylaminopyridine Derivatives as Novel PI3Kα Inhibitors
Xiang-Cong WANG , Mao-Cheng YANG , Mo-Xuan ZHANG , Yin-Jie HU , Zhong-Hua WANG , Fan-Hong WU

Phosphoinositide 3-kinases (PI3Ks), discovered in early 1980s[1], phosphorylated the 3-hydroxyl group of the inositol ring presented in membrane-bound phosphatidylinositol (PtdIns) lipids[2]. PI3Ks signaling pathways were involved in cell proliferation, growth, motility, metabolism and survival[3, 4].
PI3Ks were divided into 3 classes (classes Ⅰ, Ⅱ, and Ⅲ) based on their structure and substrate specificity[2, 5, 6]. The class Ⅰ PI3Ks, including PI3Kα, PI3Kβ, PI3Kδ and PI3Kγ, were composed of one regulatory subunit and one of the four catalytic (p110) subunits such as p110α, p110β, p110δ and p110γ isoforms[7-9]. In vivo, class Ⅰ PI3Ks primarily generated phosphatidylinositol-3, 4, 5-trisphosphate (PIP3), a critical second messenger that recruits AKT for activation of growth, proliferation and survival signaling, from phosphatidylinositol-4, 5-bisphosphate (PIP2) as a high-affinity substrate of p110α[3, 4, 10]. It was worth mentioning that p110α had a high correlation with the survival and resistance treatment of human cancer[11]. Class Ⅱ PI3Ks consisted of three monomers of PI3K-C2α, PI3K-C2β, and PI3K-C2γ, with high molecular weight due to the extension at both N-terminal and C-terminal[12]. Class Ⅲ PI3Ks also had a heterodimeric structure, composed of a regulatory subunit, Vps15 or p150, and a catalytic subunit Vps34[13].
Many potent PI3K inhibitors, including several p110 α-specific inhibitors, had been disclosed since the discovery of the first generation inhibitors, Wortmannin and LY294002[14]. Four of them had been approved by the FDA, and the corresponding structures are depicted in Fig. 1. Idelalisib (Gilead science)[15] approved in 2014 indicated for the treatment of patients with Chronic Lymphocytic Leukemia (CLL), Small Lymphocytic Lymphoma (SLL) or Follicular Lymphoma (FL). Three years later, Copanlisib (Bayer Healthcare Pharmaceuticals)[16] was approved for the treatment of patients with Non-Hodgkin Lymphoma (NHL). In the next year, Duvelisib (Verastem)[17] received FDA approval for previously treated Chronic Lymphocytic Leukemia (CLL), Small Lymphocytic Lymphoma (SLL) or Follicular Lymphoma (FL). After a year, Alpelisib (Novartis)[18] was initially approved to treat HR+/HER2- advanced breast cancer patients. Additionally, there were many other PI3Ks inhibitors being currently in clinical trials[17].
In this study, we developed 3D-QSAR models using CoMFA[19] and CoMSIA[20] technology on 65 3-phenylsulfonylaminopyridine derivatives[21-25]. The structural and pharmacodynamic information obtained from 3D-QSAR model and its influence on the biological activity would be helpful for further drug design[26-31]. Molecular docking and molecular dynamics simulation were carried out to analyze the binding mode between PI3Kα and molecules. Molecular dynamics simulation studies on compounds with different selectivity would provide detailed information to explain and elucidate the mechanisms for improving selectivity[32-35]. Finally, five new PI3Kα inhibitors were designed, and this research aimed to provide a theoretical basis for the discovery of novel PI3Kα inhibitors.
The 3D-QSAR research was based on a database of 65 3-phenylsulfonylaminopyridine derivatives as potent inhibitors against PI3Kα, which were collected from literatures[21-25]. Their molecular structures and corresponding biological activities in IC50 values are listed in Table 1. All molecules were divided into the training and test sets. 45 molecules were selected as the training set to generate the 3D-QSAR model. 20 molecules were selected as the test set to validate the quality of the models. Energies of all molecules were minimized by using Powell conjugate gradient methods at the Tripos force field[36] under the conditions of a gradient convergence of 0.005 kcal/mol⋅Å in Gasteiger-Huckel charge[37] and the maximum number of iterations was set to 10000.
 DownLoad:
CSV
DownLoad:
CSV
 | ||||
| Compd. | Substituent | IC50 (nM) | ||
| R1 | R2 | R3 | ||
| 1 |  |
 |
 |
0.100 |
| 2 |  |
 |
 |
34.700 |
| 3TS |  |
 |
 |
1.020 |
| 4 |  |
 |
 |
0.095 |
| 5 |  |
 |
 |
51.700 |
| 6TS |  |
 |
 |
0.270 |
| 7 |  |
 |
 |
35.600 |
| 8 |  |
 |
 |
0.070 |
| 9 |  |
 |
 |
72.300 |
| 10 |  |
 |
 |
17.000 |
| 11 |  |
 |
 |
2.070 |
| 12TS |  |
 |
 |
3.600 |
| 13TS |  |
 |
 |
1.700 |
| 14 |  |
 |
 |
0.230 |
| 15 |  |
 |
 |
0.300 |
| 16 |  |
 |
 |
0.800 |
| 17 |  |
 |
 |
1.000 |
| 18 |  |
 |
 |
1.000 |
| 19 |  |
 |
 |
1.500 |
| 20 |  |
 |
 |
0.870 |
| 21 |  |
 |
 |
0.880 |
| 22 |  |
 |
 |
0.950 |
| 23 |  |
 |
 |
0.600 |
| 24 |  |
 |
 |
0.920 |
| 25 |  |
 |
 |
0.890 |
| 26 |  |
 |
 |
2.100 |
| 27 |  |
 |
 |
1.600 |
| 28TS |  |
 |
 |
2.300 |
| 29 |  |
 |
 |
6.800 |
| 30 |  |
 |
 |
5.300 |
| 31 |  |
 |
 |
1.500 |
| 32TS |  |
 |
 |
2.000 |
| 33 |  |
 |
 |
1.700 |
| 34 |  |
 |
 |
1.200 |
| 35 |  |
 |
 |
2.000 |
| 36 |  |
 |
 |
6.100 |
| 37TS |  |
 |
 |
2.400 |
| 38TS |  |
 |
 |
1.300 |
| 39 |  |
 |
 |
1.300 |
| 40TS |  |
 |
 |
2.200 |
| 41 |  |
 |
 |
2.200 |
| 42 |  |
 |
 |
9.300 |
| 43 |  |
 |
 |
3.000 |
| 44TS |  |
 |
 |
1.100 |
| 45TS |  |
 |
 |
2.200 |
| 46TS |  |
 |
 |
1.600 |
| 47TS |  |
 |
 |
2.300 |
| 48 |  |
 |
 |
1.600 |
| 49 |  |
 |
 |
12.030 |
| 50TS |  |
 |
 |
2.420 |
| 51 |  |
 |
 |
174.280 |
| 52 |  |
 |
 |
14.270 |
| 53 |  |
 |
 |
174.880 |
| 54 |  |
 |
 |
72.590 |
| 55TS |  |
 |
 |
60.510 |
| 56 |  |
 |
 |
37.330 |
| 57 |  |
 |
 |
9.900 |
| 58 |  |
 |
 |
8.600 |
| 59TS |  |
 |
 |
39.650 |
| 60TS |  |
 |
 |
42.840 |
| 61TS |  |
 |
 |
3.430 |
| 62 |  |
 |
 |
63.100 |
| 63 |  |
 |
 |
2.820 |
| 64TS |  |
 |
 |
8.410 |
| 65TS |  |
 |
 |
67.000 |
| TS = test set. | ||||
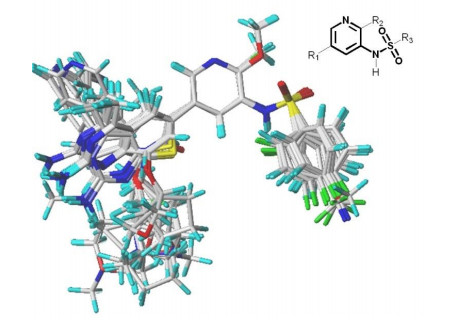
The prediction accuracy and statistical quality of the 3D-QSAR model depended heavily on alignment. Molecules of the training sets were aligned onto the template molecule (compound 8) which had the highest activity against PI3Kα. The alignments were used for further 3D-QSAR study. The results are shown in Fig. 2.
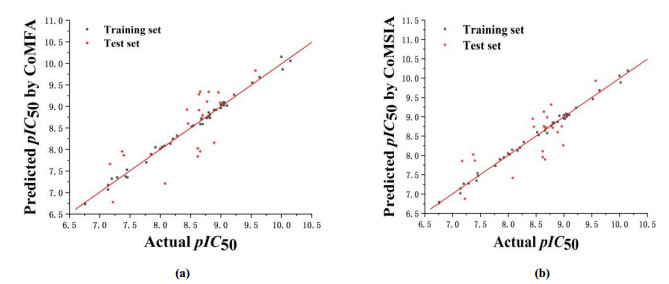
The reliability and predictive ability of the 3D-QSAR models were evaluated through internal and external validation. In the Partial least squares (PLS) analysis, the Leave-one-out (LOO) method was used to determine the optimum number of components (NOC). In the 3D-QSAR models validation, non-cross-validated correlation coefficient (rncv2), standard error estimate (SEE) and F-statistic values (F) were obtained. Each molecule's predicted value and their actual value are in linear relationship and respectively shown in Fig. 3. The predicted pIC50 values via CoMFA and CoMSIA models are listed in Table 2.
 DownLoad:
CSV
DownLoad:
CSV
| Compd. | Actual | CoMFA | CoMSIA | |||
| Predicted | Residues | Predicted | Residues | |||
| 1 | 10.000 | 10.152 | 0.152 | 10.057 | 0.057 | |
| 2 | 7.460 | 7.349 | 0.111 | 7.467 | 0.007 | |
| 3 | 8.990 | 9.087 | 0.097 | 8.256 | 0.734 | |
| 4 | 10.020 | 9.858 | 0.162 | 9.883 | 0.137 | |
| 5 | 7.290 | 7.348 | 0.058 | 7.274 | 0.016 | |
| 6 | 9.570 | 9.831 | 0.261 | 9.927 | 0.357 | |
| 7 | 7.450 | 7.527 | 0.077 | 7.535 | 0.085 | |
| 8 | 10.150 | 10.054 | 0.096 | 10.190 | 0.040 | |
| 9 | 7.140 | 7.172 | 0.032 | 7.140 | 0.000 | |
| 10 | 7.770 | 7.699 | 0.071 | 7.723 | 0.047 | |
| 11 | 8.680 | 8.723 | 0.043 | 8.705 | 0.025 | |
| 12 | 8.440 | 8.924 | 0.484 | 8.944 | 0.504 | |
| 13 | 8.770 | 9.112 | 0.342 | 9.311 | 0.541 | |
| 14 | 9.640 | 9.677 | 0.037 | 9.679 | 0.039 | |
| 15 | 9.520 | 9.550 | 0.030 | 9.455 | 0.065 | |
| 16 | 9.100 | 9.018 | 0.082 | 9.040 | 0.060 | |
| 17 | 9.000 | 8.961 | 0.039 | 8.953 | 0.047 | |
| 18 | 9.000 | 9.035 | 0.035 | 9.039 | 0.039 | |
| 19 | 8.820 | 8.730 | 0.090 | 8.829 | 0.009 | |
| 20 | 9.060 | 9.080 | 0.020 | 9.061 | 0.001 | |
| 21 | 9.060 | 9.092 | 0.032 | 9.051 | 0.009 | |
| 22 | 9.020 | 9.044 | 0.024 | 8.946 | 0.074 | |
| 23 | 9.220 | 9.270 | 0.050 | 9.228 | 0.008 | |
| 24 | 9.040 | 9.093 | 0.053 | 9.074 | 0.034 | |
| 25 | 9.050 | 9.024 | 0.026 | 8.994 | 0.056 | |
| 26 | 8.680 | 8.698 | 0.018 | 8.716 | 0.036 | |
| 27 | 8.800 | 8.856 | 0.056 | 8.842 | 0.042 | |
| 28 | 8.640 | 8.911 | 0.271 | 9.129 | 0.489 | |
| 29 | 8.170 | 8.133 | 0.037 | 8.122 | 0.048 | |
| 30 | 8.280 | 8.319 | 0.039 | 8.340 | 0.060 | |
| 31 | 8.820 | 8.809 | 0.011 | 8.844 | 0.024 | |
| 32 | 8.700 | 8.791 | 0.091 | 8.984 | 0.284 | |
| 33 | 8.770 | 8.727 | 0.043 | 8.761 | 0.009 | |
| 34 | 8.920 | 8.919 | 0.001 | 9.022 | 0.102 | |
| 35 | 8.700 | 8.589 | 0.111 | 8.574 | 0.126 | |
| 36 | 8.210 | 8.248 | 0.038 | 8.195 | 0.015 | |
| 37 | 8.620 | 7.837 | 0.783 | 8.108 | 0.512 | |
| 38 | 8.890 | 8.156 | 0.734 | 8.600 | 0.290 | |
| 39 | 8.890 | 8.919 | 0.029 | 8.864 | 0.026 | |
| 40 | 8.660 | 7.957 | 0.703 | 7.896 | 0.764 | |
| 41 | 8.660 | 8.586 | 0.074 | 8.644 | 0.016 | |
| 42 | 8.030 | 8.058 | 0.028 | 8.026 | 0.004 | |
| 43 | 8.520 | 8.530 | 0.010 | 8.594 | 0.074 | |
| 44 | 8.960 | 9.325 | 0.365 | 8.750 | 0.210 | |
| 45 | 8.660 | 9.342 | 0.682 | 8.723 | 0.063 | |
| 46 | 8.800 | 9.338 | 0.538 | 8.715 | 0.085 | |
| 47 | 8.640 | 9.280 | 0.640 | 8.751 | 0.111 | |
| 48 | 8.800 | 8.755 | 0.045 | 8.822 | 0.022 | |
| 49 | 7.920 | 8.050 | 0.130 | 7.946 | 0.026 | |
| 50 | 8.620 | 8.024 | 0.596 | 7.954 | 0.666 | |
| 51 | 6.760 | 6.743 | 0.017 | 6.792 | 0.032 | |
| 52 | 7.850 | 7.889 | 0.039 | 7.900 | 0.050 | |
| 53 | 6.760 | 6.731 | 0.029 | 6.762 | 0.002 | |
| 54 | 7.140 | 7.066 | 0.074 | 7.017 | 0.123 | |
| 55 | 7.220 | 6.776 | 0.444 | 6.872 | 0.348 | |
| 56 | 7.430 | 7.371 | 0.059 | 7.340 | 0.090 | |
| 57 | 8.000 | 8.015 | 0.015 | 8.045 | 0.045 | |
| 58 | 8.070 | 8.083 | 0.013 | 8.142 | 0.072 | |
| 59 | 7.400 | 7.864 | 0.464 | 7.864 | 0.464 | |
| 60 | 7.370 | 7.953 | 0.583 | 8.018 | 0.648 | |
| 61 | 8.460 | 8.601 | 0.141 | 8.738 | 0.278 | |
| 62 | 7.200 | 7.320 | 0.120 | 7.265 | 0.065 | |
| 63 | 8.550 | 8.553 | 0.003 | 8.522 | 0.028 | |
| 64 | 8.080 | 7.211 | 0.869 | 7.414 | 0.666 | |
| 65 | 7.170 | 7.661 | 0.491 | 7.854 | 0.684 | |
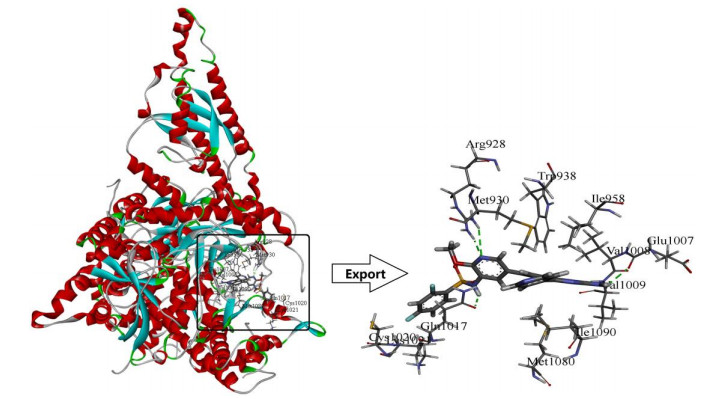
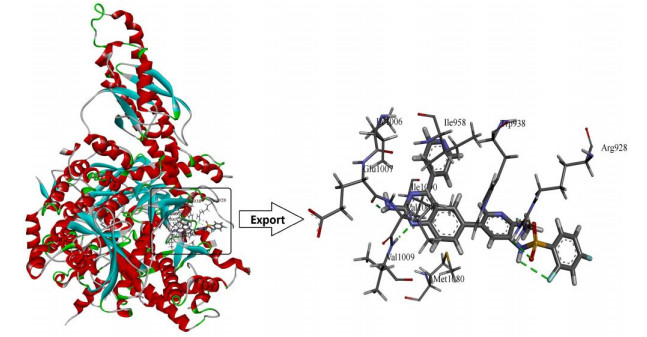
Molecular docking studies were carried out using the Surflex-Dock module in Sybyl-x 2.0, which aimed to analyze the detailed binding mode of small molecules and PI3Kα, and to validate the 3D-QSAR models. The 3D structures of PI3Kα (PDB code: 4ykn) were downloaded from RCSB protein database. The protein ligands and water were removed and the pocket which was used to combine with molecules was exposed before docking (Fig. 4).
Molecular dynamics simulation was carried out with 8-4ykn complex as the initial structure by using amber 12.0 software[38]. The general AMBER force field (GAFF) was employed on the ligands and the Amber ff99SB was used for the proteins[39]. Na+ was added to achieve the system charge balance within a cubic water box. The entire simulation followed the procedures for minimization, heating, density balance, and production. The initial configurations of the receptor and ligand were obtained from docking studies. The energy of the whole system was minimized by the steepest descent and conjugate gradient method. Then, the minimized system was heated from 0 to 300 K over 10000 ps under the NVT ensemble, followed by density equilibration in the NPT ensemble at 300 K over 10000 ps. All hydrogen atoms were constrained by SHAKE method[40]. After MD simulation, the root-mean-square deviation (RMSD) was calculated to evaluate the stability of the complex system. The image display softwares of VMD[41] were used to extract and analyze the trajectories.
Table 3 shows the statistics obtained by the CoMFA and CoMSIA models. In the CoMFA model study, the cross-validation correlation coefficient (q2) and non-cross-validation correlation coefficient (rncv2) are 0.704 and 0.994, respectively. The ONC is 10 in the training set. The SEE is 0.075 and the F value is 564.104. The Steric field contribution is 47.4%. Meanwhile, the electrostatic field contribution is 52.6%. Analogously, in the CoMSIA model study, q2, rncv2, ONC, SEE and F-value are 0.804, 0.996, 10, 0.064 and 768.981, respectively. The Steric field contribution, electrostatic field contribution, donor field contribution, acceptor field contribution and hydrophobic field contribution are 9.4%, 30.7%, 31.0%, 19.5% and 9.4%, respectively.
DownLoad:
CSV
| Statistical parameters | CoMFA | CoMSIA |
| q2 | 0.704 | 0.804 |
| rncv2 | 0.994 | 0.996 |
| ONC | 10 | 10 |
| SEE | 0.075 | 0.064 |
| F | 564.106 | 768.981 |
| Field contribution (%) | ||
| Steric (S) | 47.4 | 9.4 |
| Electrostatic (E) | 52.6 | 30.7 |
| Hydrophobic (H) | 31.0 | |
| Acceptor (A) | 19.5 | |
| Donor (D) | 9.4 |
The contour maps of CoMFA and CoMSIA models provided information that explained the relationship between structural features and biological activity. Figs. 5 and 6 showed the contour maps around compound 8 with the highest biological activity.
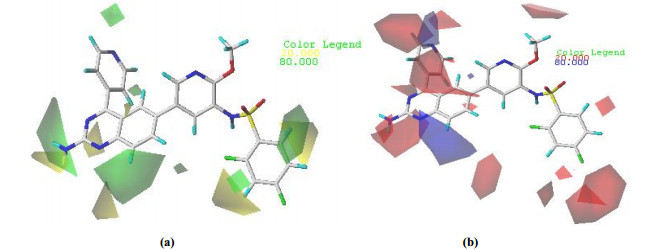
The steric and electrostatic fields from the best CoMFA model are shown in Fig. 5.
Areas where steric bulk substituents increased the potency were represented by green polyhedrons, while those in which steric bulk substituents decreased the potency were represented by yellow polyhedra (Fig. 5a). As shown in the steric map (Fig. 5a), a small yellow contour occurring around the 2΄-site of quinazoline ring at R1 of compound 8 indicated that compounds with small substituents at this site would have better biological activity. This could explain why the biological activity of compound 39 (pIC50 = 8.89) with -NH2 group was slightly better than that of compound 48 (pIC50 = 8.80) with -NCH3 group. A large green contour around the 8'-site of quinazoline ring at R1 of compound 8 indicated that bulk substituents were beneficial to the biological activity. The biological activity of compound 37 (pIC50 = 8.62) with -NCH3 group was higher than that of compound 36 (pIC50 = 8.21) with -NH group.
As shown in the electrostatic map (Fig. 5b), the blue area indicated that the electropositive group was beneficial to the biological activity, and the red area indicated that the electronegative group was beneficial to the biological activity. The blue contours were distributed around the 8'-site of quinazoline ring at R1 of compound 8, indicating that the biological activity of compounds 1 (pIC50 = 10.00) and 8 (pIC50 = 10.15) with the carbon atom at the 8'-site of quinazoline ring was better than that of compound 2 (pIC50 = 7.46) with nitrogen atom. A medium red contour map was located near R2, suggesting that the electronegative groups at this position would be favorable to increase the biological activity. The biological activity of compound 14 (pIC50 = 9.64) with chlorine atom at R2 was better than that of compound 12 (pIC50 = 8.44) with a methyl group and compound 13 (pIC50 = 8.77) with a methoxy group.
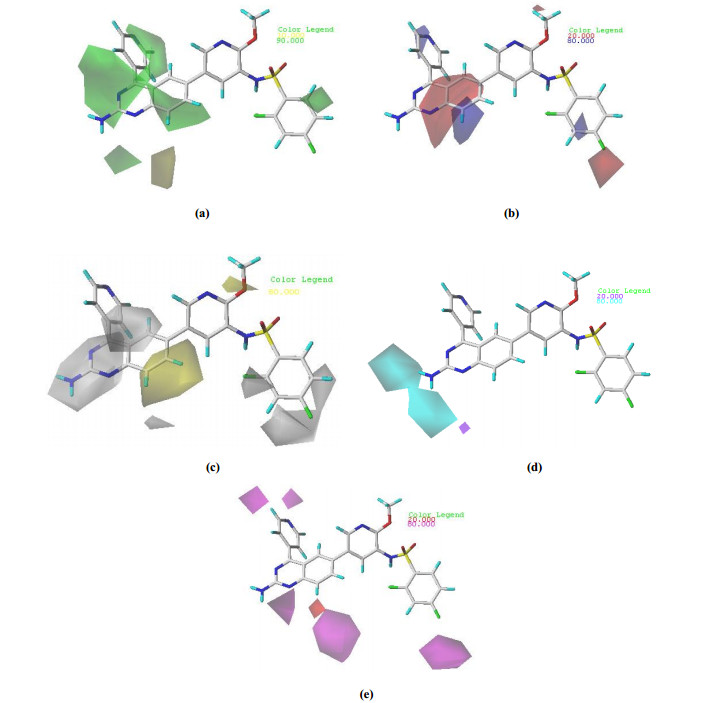
Fig. 6a depicted the CoMSIA steric contour map of the optimal model with compound 8 overlaid. A small area of green contour was located around the 8′-site of quinazoline ring at R1 of compound 8, indicating that the bulk substituents which were beneficial to the biological activity. It could be interpreted by the fact that compound 37 (pIC50 = 8.62) with -NCH3 group had higher activity than compound 36 (pIC50 = 8.21) with -NH group. A small yellow contour covered behind quinazoline ring at R1 of compound 8, indicating the presence of a small substituent was good for the biological activity. Compound 18 (pIC50 = 9.00) with the cyclopentyloxy group was more active than compound 19 (pIC50 = 8.82) with a slightly smaller substituent, cyclohexyloxy group.
The electrostatic contour map of the CoMSIA model was displayed in Fig. 6b. A small area of red contour was located around the R2, indicating that the electronegative group was beneficial to the biological activity. It could be interpreted by the fact that compound 41 (pIC50 = 8.66) with chlorine atom had higher activity than compound 42 (pIC50 = 8.03) with the methyl group. A medium blue contour occurring around the 8'-site of quinazoline ring at R1 of compound 8 indicated that compounds with electropositive groups at this site would have better biological activity. The biological activity of compound 4 (pIC50 = 10.02) with the quinazoline ring was higher than that of compound 5 (pIC50 = 7.29) with the pyrido[2, 3-d]pyrimidine ring.
The CoMSIA contour map of hydrophobic contribution is described in Fig. 6c. In this figure, the yellow (hydrophobic favorable) and white (hydrophobic unfavorable) contours represented 80% and 20% level contributions, respectively. A large white contour covered around the -NH2 group at R1 of compound 8, indicating the presence of a hydrophilic group was good for the biological activity. Compound 7 (pIC50 = 7.45) with -NH2 group was more active than compound 5 (pIC50 = 7.29) without such group.
In Fig. 6d, the cyan and purple contour maps indicated favorable and unfavorable H-bond donor groups, representing 80% and 20% level contributions, respectively. A medium cyan contour occurring near the -NH2 group at R1 of compound 8 indicated that compounds with H-bond donor substituent at this site preferred to produce higher PI3Kα inhibitory activity. Compound 8 (pIC50 = 10.15) with -NH2 group was more active than compound 4 (pIC50 = 10.02) without this group.
As shown in Fig. 6e, the hydrogen bond acceptor field of the CoMSIA model was represented by magenta (hydrogen bond acceptor favorable) and red (hydrogen bond acceptor unfavorable), representing 80% and 20% level contributions, respectively. The small red contours near the 8'-site of quinazoline ring at R1 of compound 8 suggested that the introduction of hydrogen bond acceptor substituents to these regions would decrease activity. Compound 1 (pIC50 = 10.00) with -C at the 8'-site of the quinoline ring was more active than compound 2 (pIC50 = 7.46) with -N at the same site of the same ring.
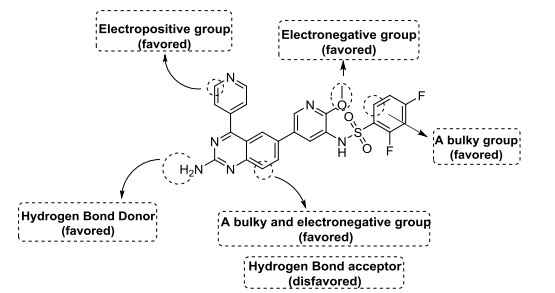
In conclusion, the above mentioned contour analysis of CoMFA and CoMSIA are summarized in Fig. 7, which provided effective help for the future design of new PI3Kα inhibitors.
Docking studies revealed the interaction of selected ligands with target proteins, allowing us to understand the 3D-QSAR models. In this study, in order to explore the binding environment in which the ligand interacts within the 4ykn, docking studies were performed on compound 8 as the template.
As shown in Fig. 4, template compound 8 was docked in the binding cavity of the 4ykn with five H-bonds. The hydrogen bond distances observed are 2.27 Å (Glu1007 –C=O···H–HN-). The 1′-site nitrogen atom of quinazoline ring also acted as a hydrogen bond acceptor to form a hydrogen bond with the Val1009 (-N···H-, 2.24 Å). The nitrogen atom of the public skeleton's pyridine ring formed two hydrogen bonds with -NH2 group of Arg928 (-N···H-, 2.12 Å, -N···H-, 2.97 Å). The hydrogen atom of the sulfonylamino group interacted through H-bonding with -C=O group of Gln1017 (-C=O···H-, 2.24 Å). All the above results indicated that the binding pocket was appropriate for the study of PI3Kα inhibitors.
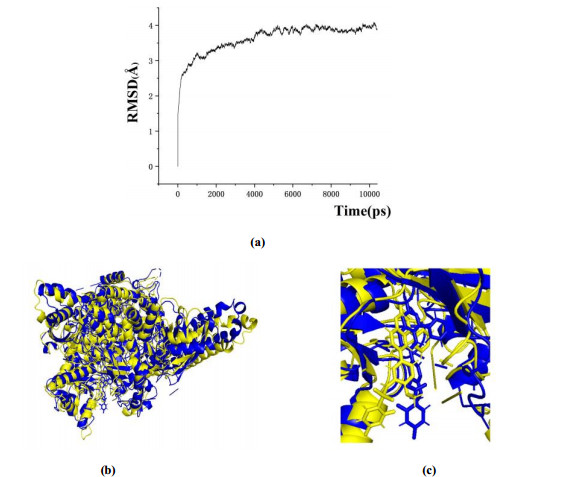
In this study, a 10 ns MD simulation was performed on a complex of compound 8 docked to the PI3Kα protein. As shown in Fig. 8a, the root mean square deviation (RMSD) of the skeleton atom of protein PI3Kα changed with time. The RMSD of PI3Kα and compound 8 kept stable at about 3.6 and 4.0 Å. The superposition of the stable structure in all MD simulations (following 10 ns) and the initial docked structure is shown in Figs. 8b and 8c. After MD simulation, the interaction between compound 8 and the receptor was analyzed to explore the similarity and difference between molecular docking and MD simulation. From the most stable structure extracted from the MD simulation, the model also revealed five hydrogen bonds formed between compound 8 and PI3Kα (Fig. 9). An intramolecular H-bond (-F···HN-, 2.24 Å) was built between the fluorine atom and -NH group. The sulfonyl group had formed two H-bonds with Arg928 (-S=O···H-, 2.15 Å, -S=O···H-, 2.85 Å). The 1'-site nitrogen atom of quinazoline ring interacted through H-bonding with -NH group of Val1009 (-N···H-, 2.07 Å). The hydrogen atom of amino group interacted through H-bonding with -C=O group of Glu1007 (-C=O···H-, 1.80 Å). In general, the length of each hydrogen bond in this result was shorter than that in the docking model. Therefore, the conformation obtained after MD simulation was more stable than the docked conformation. MD simulation was performed in a more realistic environment, and much closer to physiological conditions.
On the basis of the above mentioned analysis, five novel structures (compounds 66~70) with -CH3/-CH2CH3/-CH2CH2CH3 for R4, -CH3 for R5, -OCH3 for R6, and -CH3 for R7/R8 were designed based on the template compound 8 (Fig. 10). In addition to the 3D-QSAR of 66~70, five molecules 71~75 with potent PI3Kα inhibitory activity, synthesized by Song and his colleagues[42], were employed to validate the reliability of this 3D-QSAR model. The experimental activities and predicted values are shown in Table 4.
 DownLoad:
CSV
DownLoad:
CSV
| Compd. | Structure | Actual | CoMFA | CoMSIA | ||
| Pred. | Res. | Pred. | Res. | |||
| 66 |  |
- | 10.686 | - | 10.335 | - |
| 67 |  |
- | 10.633 | - | 10.209 | - |
| 68 |  |
- | 10.541 | - | 10.167 | - |
| 69 |  |
- | 10.318 | - | 10.361 | - |
| 70 |  |
- | 10.281 | - | 10.245 | - |
| 71 |  |
8.850 | 8.975 | 0.125 | 9.374 | 0.524 |
| 72 |  |
8.800 | 9.237 | 0.437 | 9.701 | 0.901 |
| 73 |  |
9.040 | 9.303 | 0.263 | 9.413 | 0.373 |
| 74 |  |
9.200 | 9.980 | 0.780 | 9.474 | 0.274 |
| 75 |  |
8.890 | 8.885 | 0.005 | 9.697 | 0.807 |
The results of CoMFA and CoMSIA models showed that the pIC50 values of these compounds were close to the experimental activities, which further verify the superiority of the models. Compounds 66~70 had higher predicted activities than the template compound 8 in the 3D-QSAR models; it was indicated that these designed compounds might become potential candidates as PI3Kα inhibitors.
In this work, the binding modes between 3-phenylsulfonylaminopyridine derivatives and PI3Kα were studied by the integration of 3D-QSAR, molecular docking, and molecular dynamics simulations. The contour maps explained the relationship between chemical structures and bioactivities. The molecular docking and molecular dynamics results implied that relevant hydrogen bonds were very important for ligand-receptor binding. The results from 3D-QSAR models, molecular docking, and MD simulation illustrated the chemical structure characteristics of 3-phenylsulfonylaminopyridine derivatives, which provided important guidance for further development of potent PI3Kα inhibitors with improved biological activity.
Fry, M. J. Structure, regulation and function of phosphoinositide 3-kinases. Biochim. Biophys. Acta 1994, 1226, 237−268. doi: 10.1016/0925-4439(94)90036-1
Soler, A.; Angulo-Urarte, A.; Graupera, M. PI3K at the crossroads of tumor angiogenesis signaling pathways. Mol. Cell Oncol. 2015, 2, e975624−10. doi: 10.4161/23723556.2014.975624
Bader, A. G.; Kang, S.; Zhao, L.; Vogt, P. K. Oncogenic PI3K deregulates transcription and translation. Nat. Rev. Cancer 2005, 5, 921−929. doi: 10.1038/nrc1753
Engelman, J. A.; Luo, J.; Cantley, L. C. The evolution of phosphatidylinositol 3-kinases as regulators of growth and metabolism. Nat. Rev. Genet. 2006, 7, 606−619.
Rewcastle, G. W.; Gamage, S. A.; Flanagan, J. U.; Kendall, J. D.; Denny, W. A.; Baguley, B. C.; Buchanan, C. M.; Chao, M.; Kestell, P.; Kolekar, S.; Lee, W. J.; Lill, C. L.; Malik, A.; Singh, R.; Jamieson, S. M.; Shepherd, P. R. Synthesis and biological evaluation of novel phosphatidylinositol 3-kinase inhibitors: solubilized 4-substituted benzimidazole analogs of 2-(difluoromethyl)-1-[4, 6-di(4-morpholinyl)-1, 3, 5-triazin-2-yl]-1H-benzimidazole (ZSTK474). Eur. J. Med. Chem. 2013, 64, 137−147. doi: 10.1016/j.ejmech.2013.03.038
Vanhaesebroeck, B.; Guillermet-Guibert, J.; Graupera, M.; Bilanges, B. The emerging mechanisms of isoform-specific PI3K signalling. Nat. Rev. Mol. Cell Biol. 2010, 11, 329−341.
Paddock, M. N.; Field, S. J.; Cantley, L. C. Treating cancer with phosphatidylinositol-3-kinase inhibitors: increasing efficacy and overcoming resistance. J. Lipid Res. 2019, 60, 747−752. doi: 10.1194/jlr.S092130
Thorpe, L. M.; Yuzugullu, H.; Zhao, J. J. PI3K in cancer: divergent roles of isoforms, modes of activation and therapeutic targeting. Nat. Rev. Cancer 2015, 15, 7−24. doi: 10.1038/nrc3860
Swat, W.; Montgrain, V.; Doggett, T. A.; Douangpanya, J.; Puri, K.; Vermi, W.; Diacovo, T. G. Essential role of PI3Kdelta and PI3Kgamma in thymocyte survival. Blood 2006, 107, 2415−2422. doi: 10.1182/blood-2005-08-3300
Yuan, T. L.; Cantley, L. C. PI3K pathway alterations in cancer: variations on a theme. Oncogen. 2008, 27, 5497−5510. doi: 10.1038/onc.2008.245
Rewcastle, G. W.; Gamage, S. A.; Flanagan, J. U.; Frederick, R.; Denny, W. A.; Baguley, B. C.; Kestell, P.; Singh, R.; Kendall, J. D.; Marshall, E. S.; Lill, C. L.; Lee, W. J.; Kolekar, S.; Buchanan, C. M.; Jamieson, S. M.; Shepherd, P. R. Synthesis and biological evaluation of novel analogues of the pan class Ⅰ phosphatidylinositol 3-kinase (PI3K) inhibitor 2-(difluoromethyl)-1-[4, 6-di(4-morpholinyl)-1, 3, 5-triazin-2-yl]-1H-benzimidazole (ZSTK474). J. Med. Chem. 2011, 54, 7105−7126. doi: 10.1021/jm200688y
Falasca, M.; Hughes, W. E.; Dominguez, V.; Sala, G.; Fostira, F.; Fang, M. Q.; Cazzolli, R.; Shepherd, P. R.; James, D. E.; Maffucci, T. The role of phosphoinositide 3-kinase C2alpha in insulin signaling. J. Biol. Chem. 2007, 282, 28226−28236. doi: 10.1074/jbc.M704357200
Liu, X.; Xu, Y.; Zhou, Q.; Chen, M.; Zhang, Y.; Liang, H.; Zhao, J.; Zhong, W.; Wang, M. PI3K in cancer: its structure, activation modes and role in shaping tumor microenvironment. Future Oncology 2018, 14, 665−674. doi: 10.2217/fon-2017-0588
Singh, P.; Dar, M. S.; Dar, M. J. p110alpha and p110beta isoforms of PI3K signaling: are they two sides of the same coin? FEBS Lett. 2016, 590, 3071−3082. doi: 10.1002/1873-3468.12377
Zhu, J.; Jia, L.; Jiang, Y.; Yu, Q.; Xu, L.; Cai, Y.; Chen, Y.; Li, H.; Gang, H.; Liang, W.; Jin, J. Integrated molecular modeling techniques to reveal selective mechanisms of inhibitors to PI3Kδ with marketed Idelalisib. Chem. Biol. Drug Des. 2021, 97, 1158−1169. doi: 10.1111/cbdd.13838
Scott, W. J.; Hentemann, M. F.; Rowley, R. B.; Bull, C. O.; Jenkins, S.; Bullion, A. M.; Johnson, J.; Redman, A.; Robbins, A. H.; Esler, W.; Fracasso, R. P.; Garrison, T.; Hamilton, M.; Michels, M.; Wood, J. E.; Wilkie, D. P.; Xiao, H.; Levy, J.; Stasik, E.; Liu, N.; Schaefer, M.; Brands, M.; Lefranc, J. Discovery and SAR of novel 2, 3-dihydroimidazo[1, 2-c]quinazoline PI3K inhibitors: identification of copanlisib (BAY 80-6946). ChemMedChem. 2016, 11, 1517−1530. doi: 10.1002/cmdc.201600148
Garces, A. E.; Stocks, M. J. ClassⅠPI3K clinical candidates and recent inhibitor design strategies: a medicinal chemistry perspective. J. Med. Chem. 2019, 62, 4815−4850. doi: 10.1021/acs.jmedchem.8b01492
Furet, P.; Guagnano, V.; Fairhurst, R. A.; Imbach-Weese, P.; Bruce, I.; Knapp, M.; Fritsch, C.; Blasco, F.; Blanz, J.; Aichholz, R.; Hamon, J.; Fabbro, D.; Caravatti, G. Discovery of NVP-BYL719 a potent and selective phosphatidylinositol-3 kinase alpha inhibitor selected for clinical evaluation. Bioorg. Med. Chem. Lett. 2013, 23, 3741−3748. doi: 10.1016/j.bmcl.2013.05.007
Cramer, R. D.; Patterson, D. E.; Bunce, J. D. Comparative molecular field analysis (CoMFA). 1. Effect of shape on binding of steroids to carrier proteins. J. Am. Chem. Soc. 1988, 110, 5959−5967. doi: 10.1021/ja00226a005
Klebe, G.; Abraham, U.; Mietzner, T. Molecular similarity indices in a comparative analysis (CoMSIA) of drug molecules to correlate and predict their biological activity. J. Med. Chem. 1994, 37, 4130−46. doi: 10.1021/jm00050a010
Han, F.; Lin, S.; Liu, P.; Liu, X.; Tao, J.; Deng, X.; Yi, C.; Xu, H. Discovery of a novel series of thienopyrimidine as highly potent and selective PI3K inhibitors. ACS Med. Chem. Lett. 2015, 6, 434−438. doi: 10.1021/ml5005014
Lin, S.; Jin, J.; Liu, Y.; Tian, H.; Zhang, Y.; Fu, R.; Zhang, J.; Wang, M.; Du, T.; Ji, M.; Wu, D.; Zhang, K.; Sheng, L.; Li, Y.; Chen, X.; Xu, H. Discovery of 4-methylquinazoline based PI3K inhibitors for the potential treatment of idiopathic pulmonary fibrosis. J. Med. Chem. 2019, 62, 8873−8879. doi: 10.1021/acs.jmedchem.9b00969
Lin, S.; Wang, C.; Ji, M.; Wu, D.; Lv, Y.; Sheng, L.; Han, F.; Dong, Y.; Zhang, K.; Yang, Y.; Li, Y.; Chen, X.; Xu, H. Discovery of new thienopyrimidine derivatives as potent and orally efficacious phosphoinositide 3-kinase inhibitors. Bioorg. Med. Chem. 2018, 26, 637−646. doi: 10.1016/j.bmc.2017.12.025
Lin, S.; Han, F.; Liu, P.; Tao, J.; Zhong, X.; Liu, X.; Yi, C.; Xu, H. Identification of novel 7-amino-5-methyl-1, 6-naphthyridin-2(1H)-one derivatives as potent PI3K/mTOR dual inhibitors. Bioorg. Med. Chem. Lett. 2014, 24, 790−793. doi: 10.1016/j.bmcl.2013.12.112
Han, F.; Lin, S.; Liu, P.; Tao, J.; Yi, C.; Xu, H. Synthesis and structure-activity relationships of PI3K/mTOR dual inhibitors from a series of 2-amino-4-methylpyrido[2, 3-d]pyrimidine derivatives. Bioorg. Med. Chem. Lett. 2014, 24, 4538−4541. doi: 10.1016/j.bmcl.2014.07.073
Ran, T.; Lu, T.; Yuan, H. L.; Liu, H. C.; Wang, J.; Zhang, W. W.; Leng, Y.; Lin, G. W.; Zhuang, S. L.; Chen, Y. D. A selectivity study on mTOR/PI3K alpha inhibitors by homology modeling and 3D-QSAR. J. Mol. Model. 2012, 18, 171−86. doi: 10.1007/s00894-011-1034-3
Yuan, H. L.; Tai, W. T.; Hu, S. H.; Liu, H. C.; Zhang, Y. M.; Yao, S. H.; Ran, T.; Lu, S.; Ke, Z. P.; Xiong, X.; Xu, J. X.; Chen, Y. D.; Lu, T. Fragment-based strategy for structural optimization in combination with 3D-QSAR. J. Comput. Aided Mol. Des. 2013, 27, 897−15. doi: 10.1007/s10822-013-9687-x
Yuan, H.; Liu, H.; Liu, C. W.; Wang, F.; Zhang, Y.; Yao, S.; Ran, T.; Lu, S.; Ke, Z.; Xiong, X.; Xu, J.; Chen, Y.; Lu, T. Molecular modelling on small molecular CDK2 inhibitors: an integrated approach using a combination of molecular docking, 3D-QSAR and pharmacophore modelling. SAR QSAR Environ. Res. 2013, 24, 795−17. doi: 10.1080/1062936X.2013.815655
Leng, Y.; Lu, T.; Yuan, H. L.; Liu, H. C.; Lu, S.; Zhang, W. W.; Jiang, Y. L.; Chen, Y. D. QSAR studies on imidazopyrazine derivatives as aurora a kinase inhibitors. SAR QSAR Environ. Res. 2012, 23, 705−30. doi: 10.1080/1062936X.2012.719541
Lu, S.; Liu, H. C.; Chen, Y. D.; Yuan, H. L.; Sun, S. L.; Gao, Y. P.; Yang, P.; Zhang, L.; Lu, T. Combined pharmacophore modeling, docking, and 3D-QSAR studies of PLK1 inhibitors. Int. J. Mol. Sci. 2011, 12, 8713−8739. doi: 10.3390/ijms12128713
Zhang, Y. M.; Liu, H. C.; Jiao, Y.; Yuan, H. L.; Wang, F. G.; Lu, S.; Yao, S. H.; Ke, Z. P.; Tai, W. T.; Jiang, Y. L.; Chen, Y. D.; Lu, T. De novo design of N-(pyridin-4-ylmethyl)aniline derivatives as KDR inhibitors: 3D-QSAR, molecular fragment replacement, protein-ligand interaction fingerprint, and ADMET prediction. Mol. Diver. 2012, 16, 787−02. doi: 10.1007/s11030-012-9405-y
Roy, K. K.; Saxena, A. K. Structural basis for the β-adrenergic receptor subtype selectivity of the representative agonists and antagonists. J. Chem. Inf. Model. 2011, 51, 1405−22. doi: 10.1021/ci2000874
Huang, Y. Y.; Li, Z.; Cai, Y. H.; Feng, L. J.; Wu, Y.; Li, X. S.; Luo, H. B. The molecular basis for the selectivity of tadalafil toward phosphodiesterase 5 and 6: a modeling study. J. Chem. Inf. Model. 2013, 53, 3044−53. doi: 10.1021/ci400458z
Sabbah, D. A.; Vennerstrom, J. L.; Zhong, H. Z. Binding selectivity studies of phosphoinositide 3-kin-ases using free energy calculations. J. Chem. Inf. Model. 2012, 52, 3213−24. doi: 10.1021/ci3003057
Chang, H. W.; Chung, F. S.; Yang, C. N. Molecular modeling of p38alpha mitogen-activated protein kinase inhibitors through 3D-QSAR and molecular dynamics simulations. J. Chem. Inf. Model. 2013, 53, 1775−86. doi: 10.1021/ci4000085
Clark, M.; Cramer Ⅲ, R. D.; Van Opdenbosch, N. Validation of the general purpose tripos 5.2 force field. J. Comput. Chem. 1989, 10, 982−1012. doi: 10.1002/jcc.540100804
Gasteiger, J.; Marsili, M. Iterative partial equalization of orbital electronegativity – a rapid access to atomic charges. Tetrahedron 1980, 36, 3219−3228. doi: 10.1016/0040-4020(80)80168-2
Pearlman, D. A.; Case, D. A.; Caldwell, J. W.; Ross, W. S.; Cheatham, T. E.; DeBolt, S.; Ferguson, D.; Seibel, G.; Kollman, P. AMBER, a package of computer programs for applying molecular mechanics, normal mode analysis, molecular dynamics and free energy calculations to simulate the structural and energetic properties of molecules. Comp. Phys. Commun. 1995, 91, 1−41. doi: 10.1016/0010-4655(95)00041-D
Maier, J. A.; Martinez, C.; Kasavajhala, K.; Wickstrom, L.; Hauser, K. E.; Simmerling, C. ff14SB: improving the accuracy of protein side chain and backbone parameters from ff99SB. Theor. Comput. 2015, 11, 3696−3713. doi: 10.1021/acs.jctc.5b00255
Miyamoto, S.; Kollman, P. A. Settle: an analytical version of the SHAKE and RATTLE algorithm for rigid water models. J. Comput. Chem. 1992, 13, 952−962. doi: 10.1002/jcc.540130805
Humphrey, W.; Dalke, A.; Schulten, K. VMD-visual molecular dynamics. J. Molec. Graphics 1996, 14, 33−38. doi: 10.1016/0263-7855(96)00018-5
Han, J.; Chen, Y.; Yang, C.; Liu, T.; Wang, M.; Xu, H.; Zhang, L.; Zheng, C.; Song, Y.; Zhu, J. Structure-based optimization leads to the discovery of NSC765844, a highly potent, less toxic and orally efficacious dual PI3K/mTOR inhibitor. Eur. J. Med. Chem. 2016, 122, 684−701. doi: 10.1016/j.ejmech.2016.06.030

Figure 2 Molecular alignments of all compounds in the data set. Compound 8 was employed as the template for alignment, and the common substructure was shown in bold

Figure 3 Correlation plots of the predicted pIC50 values versus the actual pIC50 values using the training and test sets based on the CoMFA (a) and CoMSIA (b) models, respectively

Figure 4 Docking of the representative ligand compound 8 into the binding site of PI3Kα. Ligands and the important residues for binding interaction were depicted by stick and line models

Figure 5 Contour maps of compound 8. (a) Steric contour maps of CoMFA: favored (green) and disfavored (yellow); (b) Electrostatic contour maps of CoMFA: electrostatic (blue) and electronegative (red)

Figure 6 (a) Steric contour maps of CoMSIA; (b) Electrostatic contour maps of CoMSIA; (c) Hydrophobic contour maps of CoMSIA: favored (yellow) and disfavored (grey); (d) Hydrogen bond donor contour maps of CoMSIA: favored (cyan) and disfavored (purple); (e) Hydrogen bond acceptor contour maps of CoMSIA: favored (magenta) and disfavored (red)

Figure 8 MD simulation results. (a) Plot of the RMSD of docked complex versus MD simulation time in the MD-simulated structures; (b) and (c) View of superimposed backbone atoms of the lowest energy structure of the MD simulation (blue) and the initial structure (yellow) for compound 8-PI3Kα complex. Compound 8 was represented as carbon-chain in yellow for the initial complex and carbon-chain in blue for the lowest energy complex

Figure 9 Plot of the MD-simulated structure of the binding site with ligand. Compound 8 was in the active site of PI3Kα. H-bonds were shown as dotted green lines; Active site amino acid residues were represented as sticks; The inhibitors were shown as stick and ball model
Table 1. Molecular Structures and Activity Values of Compounds
| ||||
| Compd. | Substituent | IC50 (nM) | ||
| R1 | R2 | R3 | ||
| 1 | |
|
|
0.100 |
| 2 | |
|
|
34.700 |
| 3TS | |
|
|
1.020 |
| 4 | |
|
|
0.095 |
| 5 | |
|
|
51.700 |
| 6TS | |
|
|
0.270 |
| 7 | |
|
|
35.600 |
| 8 | |
|
|
0.070 |
| 9 | |
|
|
72.300 |
| 10 | |
|
|
17.000 |
| 11 | |
|
|
2.070 |
| 12TS | |
|
|
3.600 |
| 13TS | |
|
|
1.700 |
| 14 | |
|
|
0.230 |
| 15 | |
|
|
0.300 |
| 16 | |
|
|
0.800 |
| 17 | |
|
|
1.000 |
| 18 | |
|
|
1.000 |
| 19 | |
|
|
1.500 |
| 20 | |
|
|
0.870 |
| 21 | |
|
|
0.880 |
| 22 | |
|
|
0.950 |
| 23 | |
|
|
0.600 |
| 24 | |
|
|
0.920 |
| 25 | |
|
|
0.890 |
| 26 | |
|
|
2.100 |
| 27 | |
|
|
1.600 |
| 28TS | |
|
|
2.300 |
| 29 | |
|
|
6.800 |
| 30 | |
|
|
5.300 |
| 31 | |
|
|
1.500 |
| 32TS | |
|
|
2.000 |
| 33 | |
|
|
1.700 |
| 34 | |
|
|
1.200 |
| 35 | |
|
|
2.000 |
| 36 | |
|
|
6.100 |
| 37TS | |
|
|
2.400 |
| 38TS | |
|
|
1.300 |
| 39 | |
|
|
1.300 |
| 40TS | |
|
|
2.200 |
| 41 | |
|
|
2.200 |
| 42 | |
|
|
9.300 |
| 43 | |
|
|
3.000 |
| 44TS | |
|
|
1.100 |
| 45TS | |
|
|
2.200 |
| 46TS | |
|
|
1.600 |
| 47TS | |
|
|
2.300 |
| 48 | |
|
|
1.600 |
| 49 | |
|
|
12.030 |
| 50TS | |
|
|
2.420 |
| 51 | |
|
|
174.280 |
| 52 | |
|
|
14.270 |
| 53 | |
|
|
174.880 |
| 54 | |
|
|
72.590 |
| 55TS | |
|
|
60.510 |
| 56 | |
|
|
37.330 |
| 57 | |
|
|
9.900 |
| 58 | |
|
|
8.600 |
| 59TS | |
|
|
39.650 |
| 60TS | |
|
|
42.840 |
| 61TS | |
|
|
3.430 |
| 62 | |
|
|
63.100 |
| 63 | |
|
|
2.820 |
| 64TS | |
|
|
8.410 |
| 65TS | |
|
|
67.000 |
| TS = test set. | ||||
 下载: 导出CSV
Table 2. Actual and Predicted pIC50 Values of All Compounds
| Compd. | Actual | CoMFA | CoMSIA | |||
| Predicted | Residues | Predicted | Residues | |||
| 1 | 10.000 | 10.152 | 0.152 | 10.057 | 0.057 | |
| 2 | 7.460 | 7.349 | 0.111 | 7.467 | 0.007 | |
| 3 | 8.990 | 9.087 | 0.097 | 8.256 | 0.734 | |
| 4 | 10.020 | 9.858 | 0.162 | 9.883 | 0.137 | |
| 5 | 7.290 | 7.348 | 0.058 | 7.274 | 0.016 | |
| 6 | 9.570 | 9.831 | 0.261 | 9.927 | 0.357 | |
| 7 | 7.450 | 7.527 | 0.077 | 7.535 | 0.085 | |
| 8 | 10.150 | 10.054 | 0.096 | 10.190 | 0.040 | |
| 9 | 7.140 | 7.172 | 0.032 | 7.140 | 0.000 | |
| 10 | 7.770 | 7.699 | 0.071 | 7.723 | 0.047 | |
| 11 | 8.680 | 8.723 | 0.043 | 8.705 | 0.025 | |
| 12 | 8.440 | 8.924 | 0.484 | 8.944 | 0.504 | |
| 13 | 8.770 | 9.112 | 0.342 | 9.311 | 0.541 | |
| 14 | 9.640 | 9.677 | 0.037 | 9.679 | 0.039 | |
| 15 | 9.520 | 9.550 | 0.030 | 9.455 | 0.065 | |
| 16 | 9.100 | 9.018 | 0.082 | 9.040 | 0.060 | |
| 17 | 9.000 | 8.961 | 0.039 | 8.953 | 0.047 | |
| 18 | 9.000 | 9.035 | 0.035 | 9.039 | 0.039 | |
| 19 | 8.820 | 8.730 | 0.090 | 8.829 | 0.009 | |
| 20 | 9.060 | 9.080 | 0.020 | 9.061 | 0.001 | |
| 21 | 9.060 | 9.092 | 0.032 | 9.051 | 0.009 | |
| 22 | 9.020 | 9.044 | 0.024 | 8.946 | 0.074 | |
| 23 | 9.220 | 9.270 | 0.050 | 9.228 | 0.008 | |
| 24 | 9.040 | 9.093 | 0.053 | 9.074 | 0.034 | |
| 25 | 9.050 | 9.024 | 0.026 | 8.994 | 0.056 | |
| 26 | 8.680 | 8.698 | 0.018 | 8.716 | 0.036 | |
| 27 | 8.800 | 8.856 | 0.056 | 8.842 | 0.042 | |
| 28 | 8.640 | 8.911 | 0.271 | 9.129 | 0.489 | |
| 29 | 8.170 | 8.133 | 0.037 | 8.122 | 0.048 | |
| 30 | 8.280 | 8.319 | 0.039 | 8.340 | 0.060 | |
| 31 | 8.820 | 8.809 | 0.011 | 8.844 | 0.024 | |
| 32 | 8.700 | 8.791 | 0.091 | 8.984 | 0.284 | |
| 33 | 8.770 | 8.727 | 0.043 | 8.761 | 0.009 | |
| 34 | 8.920 | 8.919 | 0.001 | 9.022 | 0.102 | |
| 35 | 8.700 | 8.589 | 0.111 | 8.574 | 0.126 | |
| 36 | 8.210 | 8.248 | 0.038 | 8.195 | 0.015 | |
| 37 | 8.620 | 7.837 | 0.783 | 8.108 | 0.512 | |
| 38 | 8.890 | 8.156 | 0.734 | 8.600 | 0.290 | |
| 39 | 8.890 | 8.919 | 0.029 | 8.864 | 0.026 | |
| 40 | 8.660 | 7.957 | 0.703 | 7.896 | 0.764 | |
| 41 | 8.660 | 8.586 | 0.074 | 8.644 | 0.016 | |
| 42 | 8.030 | 8.058 | 0.028 | 8.026 | 0.004 | |
| 43 | 8.520 | 8.530 | 0.010 | 8.594 | 0.074 | |
| 44 | 8.960 | 9.325 | 0.365 | 8.750 | 0.210 | |
| 45 | 8.660 | 9.342 | 0.682 | 8.723 | 0.063 | |
| 46 | 8.800 | 9.338 | 0.538 | 8.715 | 0.085 | |
| 47 | 8.640 | 9.280 | 0.640 | 8.751 | 0.111 | |
| 48 | 8.800 | 8.755 | 0.045 | 8.822 | 0.022 | |
| 49 | 7.920 | 8.050 | 0.130 | 7.946 | 0.026 | |
| 50 | 8.620 | 8.024 | 0.596 | 7.954 | 0.666 | |
| 51 | 6.760 | 6.743 | 0.017 | 6.792 | 0.032 | |
| 52 | 7.850 | 7.889 | 0.039 | 7.900 | 0.050 | |
| 53 | 6.760 | 6.731 | 0.029 | 6.762 | 0.002 | |
| 54 | 7.140 | 7.066 | 0.074 | 7.017 | 0.123 | |
| 55 | 7.220 | 6.776 | 0.444 | 6.872 | 0.348 | |
| 56 | 7.430 | 7.371 | 0.059 | 7.340 | 0.090 | |
| 57 | 8.000 | 8.015 | 0.015 | 8.045 | 0.045 | |
| 58 | 8.070 | 8.083 | 0.013 | 8.142 | 0.072 | |
| 59 | 7.400 | 7.864 | 0.464 | 7.864 | 0.464 | |
| 60 | 7.370 | 7.953 | 0.583 | 8.018 | 0.648 | |
| 61 | 8.460 | 8.601 | 0.141 | 8.738 | 0.278 | |
| 62 | 7.200 | 7.320 | 0.120 | 7.265 | 0.065 | |
| 63 | 8.550 | 8.553 | 0.003 | 8.522 | 0.028 | |
| 64 | 8.080 | 7.211 | 0.869 | 7.414 | 0.666 | |
| 65 | 7.170 | 7.661 | 0.491 | 7.854 | 0.684 | |
下载: 导出CSV
Table 3. Best Results of the CoMFA and CoMSIA PLS Statistical Results
| Statistical parameters | CoMFA | CoMSIA |
| q2 | 0.704 | 0.804 |
| rncv2 | 0.994 | 0.996 |
| ONC | 10 | 10 |
| SEE | 0.075 | 0.064 |
| F | 564.106 | 768.981 |
| Field contribution (%) | ||
| Steric (S) | 47.4 | 9.4 |
| Electrostatic (E) | 52.6 | 30.7 |
| Hydrophobic (H) | 31.0 | |
| Acceptor (A) | 19.5 | |
| Donor (D) | 9.4 |
下载: 导出CSV
Table 4. Structures of the Compounds with Experimental and Predicted Activity
| Compd. | Structure | Actual | CoMFA | CoMSIA | ||
| Pred. | Res. | Pred. | Res. | |||
| 66 | |
- | 10.686 | - | 10.335 | - |
| 67 | |
- | 10.633 | - | 10.209 | - |
| 68 | |
- | 10.541 | - | 10.167 | - |
| 69 | |
- | 10.318 | - | 10.361 | - |
| 70 | |
- | 10.281 | - | 10.245 | - |
| 71 | |
8.850 | 8.975 | 0.125 | 9.374 | 0.524 |
| 72 | |
8.800 | 9.237 | 0.437 | 9.701 | 0.901 |
| 73 | |
9.040 | 9.303 | 0.263 | 9.413 | 0.373 |
| 74 | |
9.200 | 9.980 | 0.780 | 9.474 | 0.274 |
| 75 | |
8.890 | 8.885 | 0.005 | 9.697 | 0.807 |
下载: 导出CSV

 扫一扫看文章

扫一扫关注我们


