
Table 1.
Crystal Data and Structure Refinement for 1~4

Syntheses, Crystal Structures and DNA-binding Properties of Cd(Ⅱ), Co(Ⅱ), Cu(Ⅱ) and Zn(Ⅱ) Complexes Containing Imidazolium Derivatives
Yu-Han LI , Yu YANG , Hui-Chao GUAN , Min ZHANG , Lin-Lin XU , Shu-Mei YUE


In recent years, metal complexes exhibited advantages in light, electricity, magnetism, biology, etc. They have become a kind of functional complexes that have been paid extensive attention to and studied[1-7]. Imidazole derivatives with good biological activity can be used as insecticides and bactericides in organisms[8-11]. Imidazolium can coordinate with many metal ions, which is the focus of researches on imidazolium complexes in recent years[12, 13]. Mohammad Y. Alfaif et al reported that the new imidazolyl palladium(Ⅱ) Saldach complex has obvious binding ability to CT-DNA[14]. Zhou Qing-Hua et al reported imidazole Cu(Ⅱ) and Mn(Ⅱ) complexes in 2005, and the interaction between complexes and calf thymus DNA was investigated[15, 16]. For it can provide valuable information in the development of drugs, phosphate bond can be hydrolyzed quickly under the action of imidazolium complexes of manganese(Ⅱ). It is expected to be applied as an effective reagent for hydrolyzing and cutting DNA[15]. Although many such researches have been studied, some controversy in studying the interaction between metal complexes and DNA still exists[17-19]. The special structure of DNA has large and small grooves, negatively charged phosphate skeleton and stacked base pairs. The bonding sites and interaction modes between metal complexes and DNA are determined. There are three main modes of interaction between metal complexes and DNA: non-covalent combination, covalent combination and cutting[20]. Now the non-covalent interactions between drug molecules and DNA reported contained electrostatic binding, grooving binding and intercalation interaction. If complexes that can target DNA destruction are found, anti-cancer drugs and cancer treatment will be further developed[21-24].
In the most recent years, our research group has been working hardly on the synthesis of benzothiazole and benzimidazole metal complexes, in addition to their properties[25-27]. Qi Shuang et al. reported a success in synthesizing the metal complexes of Zn(Ⅱ), Co(Ⅱ) and Ni(Ⅱ) with 2-(2-pyridyl) benzothiazole as ligands in 2018. Besides, a study was performed of the binding properties exhibited by the complexes with DNA[28].
In this paper, four metal complexes based on 2-(2-pyridyl)benzimidazolium were synthesized and their interaction with DNA was studied. We hope this study can provide potential strategy for the research of anti-cancer.
All chemicals of reagent grade were obtained from commercial sources and used without further purification. 4, 4΄-Oxybisbenzoic acid was purchased from Aladdin, CT-DNA from Sigma and stored at 2~8 ℃, and tris-buffer from GENVIEW used for the preparation of all solutions for CT-DNA binding studies. UV-vis spectral measurements for the synthesized complexes were made using a TU-1901 double beam recording spectrophotometer. Fluorescence spectra were performed on a RF-5301PC fluorescence spectrofluorometer. Viscosity measurements were performed using an Ubbelohde viscometer, which was immersed in a thermostat water bath at 20 ℃.
A mixture of Cd(NO3)2·4H2O (0.0308 g, 0.1 mmol), H2odc (0.0258 g, 0.1 mmol) and pbm (0.0195 g, 0.1 mmol) was added to DMF (8 mL) and H2O (2 mL), and placed in a Teflon reactor (20 mL) and heated at 80 ℃ for 3 days. After gradually cooling down to room temperature at a rate of 10 ℃·h-1, colorless crystals of complex 1 were obtained with 41% yield based on pbm. Anal. Calcd. (%) for C26H17CdN3O5: C, 55.34; H, 2.70; N, 7.68. Found (%): C, 55.60; H, 2.69; N, 7.52.
Synthesis of [Co(pbm)(odc)2] (2)
Complex 2 was synthesized following the same synthetic procedure as that of complex 1 except that CoCl2·6H2O (0.0238 g, 0.1 mmol) was used instead of Cd(NO3)2·4H2O. Red crystals of complex 2 were obtained with 52% yield based on pbm. Anal. Calcd. (%) for C26H17CoN3O5: C, 55.42; H, 2.71; N, 7.73. Found (%): C, 55.53; H, 2.73; N, 7.76.
Synthesis of [Cu(pbm)(odc)2] (3)
Complex 3 was synthesized following the same synthetic procedure as that of complex 1 except that Cd(NO3)2·4H2O was substituted by CuCl2·2H2O (0.0171 g, 0.1 mmol). Green crystals of complex 3 were obtained with 43% yield based on pbm. Anal. Calcd. (%) for C26H17CuN3O5: C, 57.66; H, 3.61; N, 8.37. Found (%): C, 57.62; H, 3.57; N, 8.35.
Synthesis of [Zn(pbm)(odc)2] (4)
The ZnCl2·2H2O (0.0175 g, 0.1 mmol), H2odc (0.0258 g, 0.1 mmol), and pbm (0.0195 g, 0.1 mmol) were added to methanol (2 mL), DMF (5 mL) and H2O (2 mL), and then placed in a Teflon reactor (20 mL) and heated at 80 ℃ for 3 days. After gradually cooling down to room temperature at a rate of 10 ℃·h-1, colorless crystals of complex 4 were obtained with 41% yield based on pbm. Anal. Calcd. (%) for C26H17ZnN3O5: C, 55.21; H, 2.68; N, 7.74. Found (%): C, 55.14; H, 2.66; N, 7.71.
Single-crystal XRD data for complexes 1~4 were recorded on a Bruker Apex CCD diffractometer with graphite-monochromatized MoKα radiation (λ = 0.71073 Å). Absorption corrections were applied using the multi-scan technique. All the structures were solved by direct methods of SHELXS-97 and refined with ShelXL-97 refinement package using the least-squares minimization[29, 30]. The detailed crystallographic data and structure refinement parameters for 1~4 are summarized in Table 1.
 DownLoad:
CSV
DownLoad:
CSV
| Complexes | 1 | 2 | 3 | 4 |
| CCDC | 1924089 | 1938100 | 1938101 | 1924090 |
| Chemical formula | C26H17CdN3O5 | C26H17CoN3O5 | C26H17CuN3O5 | C26H17N3O5Zn |
| Temperature (K) | 296.15 | 173.0 | 187.49 | 293(2) |
| Mr | 563.82 | 510.35 | 514.96 | 516.79 |
| Crystal system | Monoclinic | Monoclinic | Monoclinic | Monoclinic |
| Space group | P21/n | P21/n | P21/c | P21/n |
| a (Å) | 7.4963(4) | 7.3081(9) | 13.1636(10) | 7.4336(8) |
| b (Å) | 18.3015(10) | 18.501(3) | 15.3767(10) | 18.470(2) |
| c (Å) | 16.5769(9) | 16.257(2) | 11.3600(8) | 16.2706(18) |
| α (º) | 90 | 90 | 90 | 90 |
| β (º) | 98.3510(10) | 99.310(5) | 100.141(4) | 99.863(2) |
| γ (º) | 90 | 90 | 90 | 90 |
| Volume (Å3) | 2250.1(2) | 2169.0(5) | 2263.5 | 2200.9(4) |
| Z | 4 | 4 | 4 | 4 |
| Dc (g·cm-3) | 1.664 | 1.563 | 1.511 | 1.560 |
| F(000) | 1128.0 | 1044.0 | 1052.0 | 1056.0 |
| 2θ range for data collection | 5.69 to 51.424 | 5.536 to 50.12 | 8.924 to 130.15 | 3.36 to 49.364 |
| Reflections collected/unique | 13616/4273(Rint = 0.0610) | 21572/3835(Rint = 0.0881) | 13027/3757(Rint = 0.0532) | 12201/3754(Rint = 0.1168) |
| Goodness-of-fit on F2 | 1.027 | 1.055 | 1.129 | 1.020 |
| Final R indexes (I > 2σ(I)) | R = 0.0518, wR = 0.1222 | R = 0.0624, wR = 0.1293 | R = 0.0851, wR = 0.1790 | R = 0.0667, wR = 0.1717 |
| Final R indexes (all data) | R = 0.0918, wR = 0.1417 | R = 0.0927, wR = 0.1428 | R = 0.1106, wR = 0.1942 | R = 0.1639, wR = 0.2547 |
DNA binding experiments which include Ultraviolet spectrum, fluorescence spectrum and viscosity measurements conformed to the standard methods and practices previously adopted by our laboratory[31]. While measuring the absorption and fluorescence spectra, an increasing amount of CT-DNA was added to the complex solution. Viscosity measurements were carried on an Ubbelohde viscometer in a thermostated water-bath maintained at 20 ℃ by varying the concentration of the added metal complexes. The concentration ratio of the sample is shown in Table 2.
DownLoad:
CSV
| Material number | Tris (μL) | DNA(μL) | Complex (μL) |
| 1 | 2700 | 0 | 300 |
| 2 | 2400 | 300 | 300 |
| 3 | 2100 | 600 | 300 |
| 4 | 1800 | 900 | 300 |
| 5 | 1500 | 1200 | 300 |
| 6 | 1200 | 1500 | 300 |
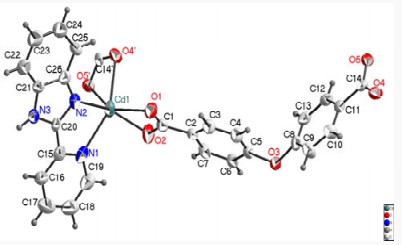
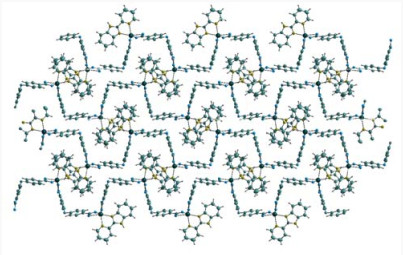
Single-crystal X-ray diffraction analyses indicate that complex 1 crystallizes in monoclinic space group P21/n. The asymmetric unit of 1 consists of one crystallographically unique Cd(Ⅱ) atom, one pbm ligand and two odc2− anions. As shown in Fig. 1, the Cd(Ⅱ) atom is six-coordinated by two nitrogen atoms from one pbm ligand and four oxygen atoms from two 4, 4΄-oxybisbenzoic acids. The twisted octahedral structure is formed through the geometry around the Cd(Ⅱ) center. The Cd–O bond lengths are in the range of 2.256(4) to 2.372(4) Å, with the average to be 2.314 Å (Table 3). The odc2− anion connects two Cd(Ⅱ) atoms through two chelate carboxylates. The pbm ligand acts as a linker to join one Cd(Ⅱ) atom. The Cd(Ⅱ) atoms are also bridged by the organic ligands into a 2D sql layer (Fig. 2).
 DownLoad:
CSV
DownLoad:
CSV
| Complex 1 | Complex 2 | Complex 3 | Complex 4 | |||||||
| Bond | Dist. | Bond | Dist. | Bond | Dist. | Bond | Dist. | |||
| Cd(1)–O(1) | 2.256(4) | Co(1)–O(1) | 2.142(3) | Cu(1)–O(1) | 1.856(5) | Zn(1)–O(1) | 2.132(6) | |||
| Cd(1)–O(2) | 2.286(4) | Co(1)–O(2) | 2.108(3) | Cu(1)–O(4)#1 | 2.092(6) | Zn(1)–O(2) | 2.158(7) | |||
| Cd(1)–O(4)#1 | 2.372(4) | Co(1)–O(4)#1 | 2.202(3) | O(1)–Cu(1A)#2 | 1.684(7) | Zn(1)–O(4)#1 | 2.145(6) | |||
| Cd(1)–O(5)#1 | 2.307(4) | Co(1)–O(5)#1 | 2.126(3) | O(5)–Cu(1A)#2 | 2.408(7) | Zn(1)–O(5)#1 | 2.247(7) | |||
| Cd(1)–N(1) | 2.369(6) | Co(1)–N(1) | 2.169(5) | Cu(1)–N(1) | 2.051(6) | Zn(1)–N(1) | 2.045(7) | |||
| Cd(1)–N(2) | 2.236(5) | Co(1)–N(2) | 2.046(4) | Cu(1)–N(2) | 1.966(7) | Zn(1)–N(3) | 2.216(9) | |||
| Angle | (°) | Angle | (°) | Angle | (°) | Angle | (°) | |||
| C(13)–O(1)–Cd(1) | 91.1(4) | C(13)–O(1)–Co(1) | 87.8(3) | C(13)–O(1)–Cu(1) | 102.9(4) | C(1)–O(1)–Zn(1) | 90.1(6) | |||
| C(13)–O(2)–Cd(1) | 89.8(4) | C(13)–O(2)–Co(1) | 89.4(3) | C(26)–O(4)–Cu(1)#2 | 99.3(5) | C(1)–O(2)–Zn(1) | 88.2(6) | |||
| C(1)–N(1)–Cd(1) | 126.4(5) | C(1)–N(1)–Co(1) | 129.0(4) | N(1)–Cu(1)–O(4)#1 | 163.7(3) | C(15)–N(1)–Zn(1) | 136.6(7) | |||
| C(5)–N(1)–Cd(1) | 114.7(4) | C(5)–N(1)–Co(1) | 113.7(3) | C(5)–N(1)–Cu(1) | 113.2(3) | C(21)–N(1)–Zn(1) | 114(6) | |||
| C(6)–N(2)–Cd(1) | 113.8(4) | C(6)–N(2)–Co(1) | 113.0(3) | C(1)–N(1)–Cu(1) | 126.8(3) | C(22)–N(3)–Zn(1) | 112.5(7) | |||
| C(7)–N(2)–Cd(1) | 137.5(4) | C(7)–N(2)–Co(1) | 138.8(3) | C(6)–N(2)–Cu(1) | 112.0(10) | C(26)–N(3)–Zn(1) | 128.7(7) | |||
| O(1)–Cd(1)–N(1) | 117.74(16) | O(1)–Co(1)–N(1) | 92.03(15) | C(7)–N(2)–Cu(1) | 142.3(6) | O(1)–Zn(1)–N(3) | 109.7(3) | |||
| O(2)–Cd(1)–N(1) | 93.88(17) | O(2)–Co(1)–N(1) | 105.96(14) | O(1)–Cu(1)–N(1) | 92.1(2) | O(2)–Zn(1)–N(3) | 91.9(3) | |||
| O(2)–Cd(1)–N(1) | 93.88(17) | N(2)–Co(1)–O(1) | 159.98(15) | O(1)–Cu(1)–N(2) | 153.5(2) | N(1)–Zn(1)–O(1) | 102.7(3) | |||
| N(2)–Cd(1)–O(2) | 155.42(18) | N(2)–Co(1)–O(2) | 103.22(15) | N(2)–Cu(1)–N(1) | 81.6(3) | N(1)–Zn(1)–O(2) | 156.7(3) | |||
| N(2)–Cd(1)–N(1) | 72.96(18) | N(2)–Co(1)–N(1) | 78.38(16) | C(6)–N(2)–C(7) | 105.6(10) | N(1)–Zn(1)–N(3) | 77.5(3) | |||
| O(1)–Cd(1)–O(2) | 57.63(15) | O(2)–Co(1)–O(1) | 62.24(12) | C(8)–N(3)–C(6) | 106.8(9) | O(1)–Zn(1)–O(2) | 61.1(3) | |||
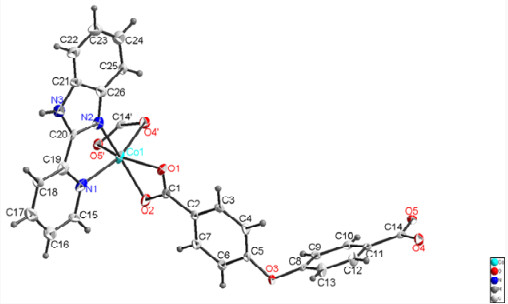
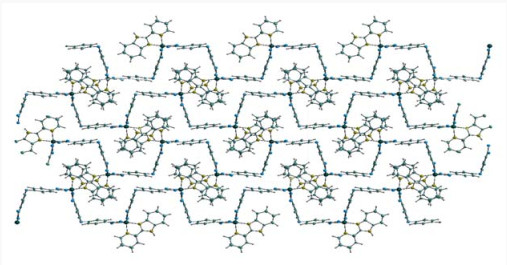
Single-crystal X-ray diffraction analyses indicate that complex 2 crystallizes in monoclinic space group P21/n. The asymmetric unit of 2 consists of one crystallographically unique Co(Ⅱ) atom, one pbm ligand and two odc2− anions. As shown in Fig. 3, the Co(Ⅱ) atom is six-coordinated by two nitrogen atoms from one pbm ligand and four oxygen atoms from two 4, 4΄-oxybisbenzoic acids. The twisted octahedral structure is formed through the geometry around the Co(Ⅱ) center. The Co–O bond lengths fall in the range of 2.108(3)~2.202(3) Å, with an average value of 2.155 Å (Table 3). The odc2− anion connects two Co(Ⅱ) atoms through two chelate carboxylates. The pbm ligand acts as a linker to join one Co(Ⅱ) atom. The Co(Ⅱ) atoms are also bridged by the organic ligands into a 2D sql layer (Fig. 4).
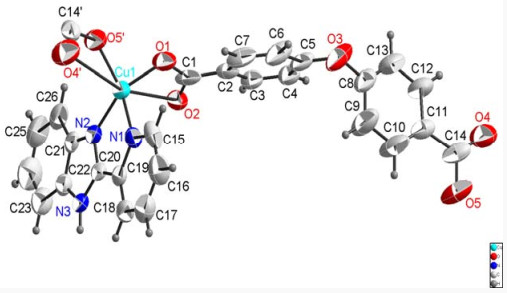
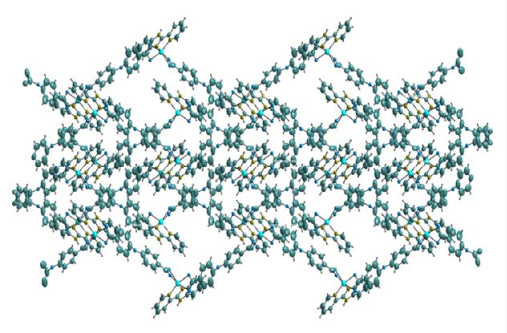
Single-crystal X-ray diffraction analyses indicate that complex 3 crystallizes in monoclinic space group P21/c. The asymmetric unit of 3 consists of one crystallographically unique Cu(Ⅱ) atom, one pbm ligand and two odc2− anions. As shown in Fig. 5, the Cu(Ⅱ) atom is six-coordinated by two nitrogen atoms from one pbm ligand and four oxygen atoms from two 4, 4΄-oxy bisbenzoic acids. The twisted octahedral structure is formed through the geometry around the Cu(Ⅱ) center. The Cu–O bond lengths change from 1.684(7) to 2.408(7) Å, with the average to be 2.046 Å (Table 3). The odc2− anion connects two Cu(Ⅱ) atoms through two chelate carboxylates. The pbm ligand acts as a linker to join one Cu(Ⅱ) atom. The Cu(Ⅱ) atoms are also bridged by the organic ligands into a 2D sql layer (Fig. 6).
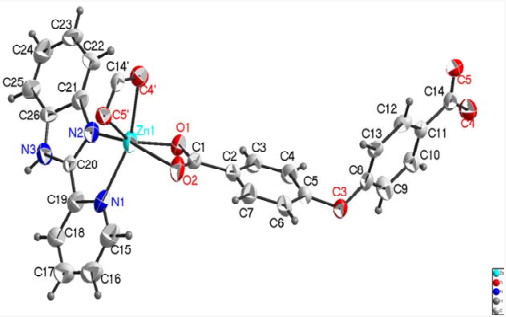
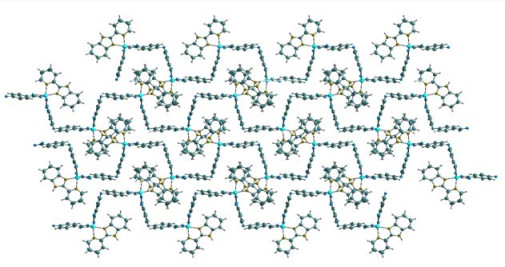
Single-crystal X-ray diffraction analyses indicate that complex 4 crystallizes in monoclinic space group P21/n. The asymmetric unit of 4 consists of one crystallographically unique Zn(Ⅱ) atom, one pbm ligand and two odc2− anions. As shown in Fig. 7, the Zn(Ⅱ) atom is six-coordinated by two nitrogen atoms from one pbm ligand and four oxygen atoms from two 4, 4΄-oxy bisbenzoic acids. The twisted octahedral structure is formed through the geometry around the Zn(Ⅱ) center. The Zn–O bond lengths are in the 2.132(6)~2.247(7) Å range, with the average being 2.189 Å (Table 3). The odc2− anion connects two Zn(Ⅱ) atoms through two chelate carboxylates. The pbm ligand acts as a linker to join one Zn(Ⅱ) atom. The Zn(Ⅱ) atoms are also bridged by the organic ligands into a 2D sql layer (Fig. 8).
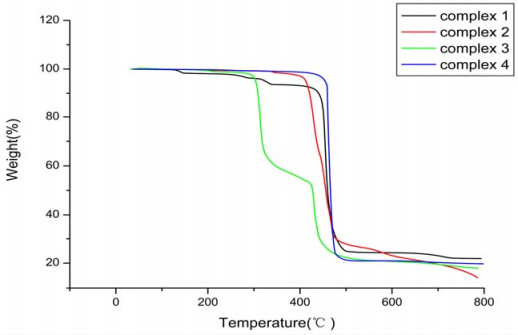
The thermal stabilities of complexes 1~4 were investigated by thermogravimetric analyses (TGA) measurement (Fig. 9). The experiments were performed on samples consisting of numerous single crystals of 1~4 under N2 atmosphere with a heating rate of 10 ℃/min. For complex 1, no obvious weight loss was observed before the decomposition of the framework which occurred at ca. 417 ℃, with the remaining weight corresponding to the formation of CdO (Calcd.: 22.8%; Found: ca. 24.2%). For 2, the framework decomposed at ca. 394 ℃. The remaining weight corresponds to the formation of CoO (Calcd.: 14.7%; Found: ca. 14.6%). For 3, two stages of weight loss happened. At about ca. 533 ℃, the organic composition in 3 was decomposed completely, and the remaining weight results from the formation of CuO (Calcd.: 15.4%; Found: ca. 18.2%). For 4, the destruction of the framework occurs at ca. 423 ℃, with the remaining weight corresponding to the formation of ZnO (Calcd.: 15.8%; Found: ca. 19.8%).
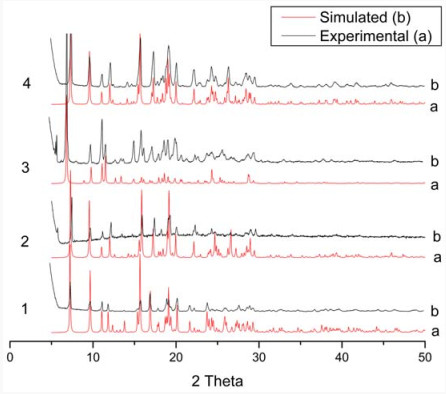
The experimental and simulated powder XRD spectra of complexes 1~4 are shown in Fig. 10. The experimental powder XRD pattern for each complex is in accordance with the simulated one generated on the basis of the structural data, confirming the pure phase for the as-synthesized product.
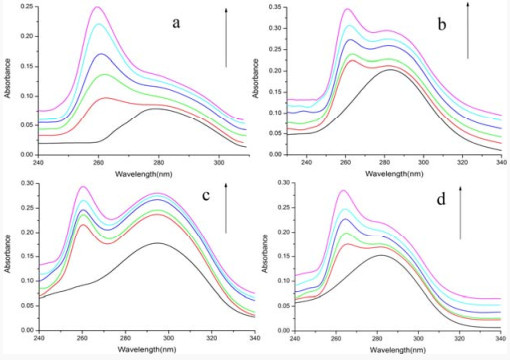
Ultraviolet absorption spectroscopy is one of the common and effective methods in studying the interaction between complexes and DNA. Usually covalent combination from the interaction between the complex and DNA existed if the absorption peak of the complex decreases and the wavelength red shifts after adding DNA to the solution of the complex[32-34]. If the interaction between the complex and DNA is electrostatic or grooved, the absorption peak of the complex will show a small red-shift, but the color reduction effect is not obvious[35]. When the interaction between the complex and DNA occurred, if the absorption peak is enhanced, the degree of color enhancement is proportional to the concentration of DNA. This may be due to the interaction between the complex and DNA, which leads to the destruction of double helix structure of DNA[36, 37]. Fig. 11 shows the absorption spectra of complexes 1~4 under different DNA concentrations. Strong absorption bands at 283 and 294 nm were observed in complexes 1, 2, 4 and complex 3 respectively. The maximum absorption peak of the complex enhanced as the increased DNA concentration addition, but no red- or blue-shift occurred obviously. Therefore, these changes indicated that the interaction between the complex and DNA is electrostatic or grooved, or probably induced by the destruction of the double helix structure of DNA.
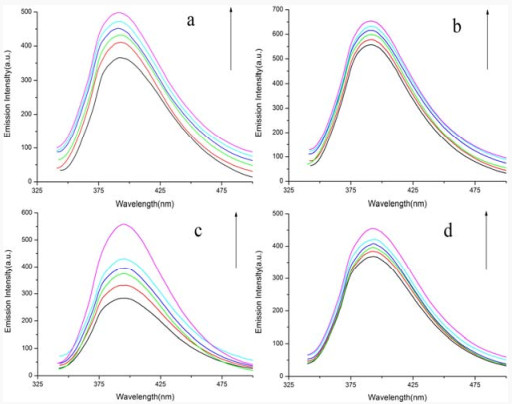
Fluorescence spectroscopy for the emission was conducted to study fluorescent targeting complexes in order to further explore the interaction mode between the complex and DNA. The interaction mode of the two complexes can be judged from the variation of fluorescence intensity before and after interaction[38, 39]. The fluorescence spectra of complexes 1~4 changed with the increase of DNA concentration, as shown in Fig. 12. The complexes exhibited strong fluorescence at 392 nm when excited at 240 nm at room temperature. When the concentration of DNA is gradually increased in the fixed concentration of complex solution, the fluorescence emission intensity increases, but no red- or blue-shift was observed in the emission band, which indicates that the complex has a strong interaction with DNA. The increase of emission intensity may be related to the change of environment and the degree of entry of the complex into the hydrophobic environment of DNA. This not only avoids the quenching effect of solvent water molecules, but also limits the fluidity of complexes at the binding site, thus reducing their vibration modes and enhancing their emission intensity[40].
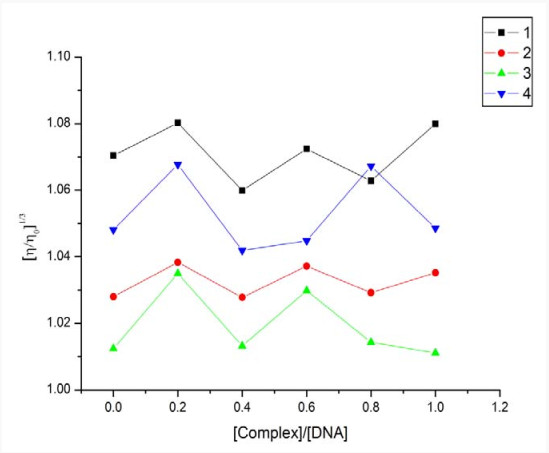
The viscosity method plays a unique role in determining the mode of action of metal complexes and DNA, which is the most effective approach to confirm whether complexes and DNA are inserted in an intercalated manner or not, and the results measured by this method are more convincing than that by spectrometry force[41]. When the complex interacts with DNA in the insertion mode, the distance between the base pairs will become larger to accommodate the incoming ligand, resulting in the elongation of DNA double helix and increase of solution viscosity when the complex is electrostatically charged. However, the combination of non-insertion modes, such as groove bonding and electrostatic interaction, bends the DNA helix, and shortens the length of DNA, resulting in negligible change in DNA viscosity at different concentrations[42, 43]. The viscosity curve of the interaction between complexes 1~4 and DNA is shown in Fig. 13. As shown in this figure, the four viscosity curves fluctuate up and down a straight line respectively. Therefore, the interaction mode between the four complexes and DNA is groove binding or electrostatic interaction, which is consistent with that of spectral analysis.
In this study, four new complexes were synthesized successfully under solvothermal conditions with 2-(2-pyridyl)benzimidazole as the main ligand and 4, 4΄-oxybisbenzoic acid as the auxiliary ligand, and their crystal structures were studied. The CT-DNA binding with four new complexes were investigated by absorption, fluorescence spectroscopy and viscosity measurements. The results of this study show that these complexes can probably bind to CT-DNA by electrostatic or grooved mode. These findings have potential value for the study of anticancer drug and DNA replication. We hope to provide valuable information for the study of anticancer research.
Zhao, F. H.; Jia, X. M.; He, Y. C.; Huang, L. W.; Yan, X. Q. Syntheses and magnetic properties of three transition metal complexes based on 4΄-p-tolyl-2, 2΄: 6΄, 2΄΄-terpyridine and SCN−. Polyhedron 2019, 173, 114–124.
Liu, Y. T.; Yang, L. S.; Yin, D. W.; Dang, Y.; Yang, L. Solvent-free synthesis, characterization, biological activity of Schiff bases and their metal(Ⅱ) complexes derived from ferrocenyl chalcone. J. Organomet. Chem. 2019, 899, 120903. doi: 10.1016/j.jorganchem.2019.120903
Marichev, K. O.; Patil, S. A.; Bugarin, A. Recent advances in the synthesis, structural diversity, and applications of mesoionic 1, 2, 3-triazol-5-ylidene metal complexes. Tetrahedron 2018, 74, 2523–2546. doi: 10.1016/j.tet.2018.04.013
Feng, Y. Q.; Bi, D. Q.; Hu, Y. L.; Zhong, Z. G. Ionothermal synthesis, crystal structure and antibacterial activities of a new 3d-4f hetero-metallic compound containing two kinds of ligands. Chin. J. Struct. Chem. 2015, 34, 1598–1605.
Mallela, R.; Konakanchi, R.; Guda, R.; Munirathinam, N.; Gandamalla, D.; Yellu, N. R. Zn(Ⅱ), Cd(Ⅱ) and Hg(Ⅱ) metal complexes of 2-aminonicotinaldehyde: synthesis, crystal structure, biological evaluation and molecular docking study. Inorg. Chim. Acta 2018, 469, 66–75. doi: 10.1016/j.ica.2017.08.042
Roozbahani, P.; Salehi, M.; Malekshah, R. E.; Kubicki, M. Synthesis, crystal structure, electrochemical behavior and docking molecular of poly-nuclear metal complexes of Schiff base ligand derived from 2-amino benzyl alcohol. Inorg. Chim. Acta 2019, 496, 119022. doi: 10.1016/j.ica.2019.119022
Qiao, Y.; Zhou, Y. F.; Guan, W. S.; Liu, L. H.; Liu, B.; Che, G. B. Syntheses, structures, and photocatalytic properties of two new one-dimensional chain transition metal complexes with mixed N, O-donor ligands. Inorg. Chim. Acta 2017, 466, 291–297. doi: 10.1016/j.ica.2017.06.018
Chai, X. C.; Gao, X. N.; Li, H.; Zhang, H. H.; Han, Q. P. Two coordination novel polymers based on a flexible ligand N, N΄-diacetic acid imidazolium. Chin. J. Struct. Chem. 2017, 36, 463–470.
Fan, C. B.; Wang, Y. L.; Xu, W. Y.; Liu, Q. Y. Ionothermal synthesis and characterization of a three-dimensional anionic zinc-5-sulfoisophthalate framework charge-balanced with the 1-Ethyl-3-methylimidazolium. Chin. J. Struct. Chem. 2016, 35, 77–84.
Deng, G. G.; Zhou, B.; Wang, J.; Chen, Z.; Gong, L.; Gong, Y. X. Synthesis and antitumor activity of novel steroidal imidazolium salt derivatives. Eur. J. Med. Chem. 2019, 168, 232–252. doi: 10.1016/j.ejmech.2019.02.025
Gan, Z. J.; Tian, Q. Q.; Shang, S. Q.; Luo, W.; Dai, Z. S.; Wang, H. J.; Li, D.; Wang, X. T.; Yuan, J. Y. Imidazolium chloride-catalyzed synthesis of benzimidazoles and 2-substituted benzimidazoles from o-phenylenediamines and DMF derivatives. Tetrahedron 2018, 74, 7450–7456. doi: 10.1016/j.tet.2018.11.014
Juan, B.; Jingan, Z. Study and application of benzimidazolium substituted amines and their metal complexes. J. Guangdong Trace Element Science 2008, 15, 1–6.
Yuan, W. G.; Ting, W.; Zhang, H. L.; Zhao, B.; Xiong, F.; Jing, L. H.; Qin. D. B. Two amine-tethered imidazolium NHC Ni(Ⅱ) complexes: synthesis, structure and catalytic activity. Chin. J. Struct. Chem. 2014, 33, 325–332.
Alfaif, M. Y.; Elbehairi, S. E. I.; Hafez, H. S. Spectroscopic exploration of binding of new imidazolium-based palladium(Ⅱ) saldach complexes with CT-DNA as anticancer agents against HER2/neu overexpression. J. Mol. Struct. 2019, 1191, 118–128. doi: 10.1016/j.molstruc.2019.04.119
Zhou, Q. H.; Yang, F. S. Spectroscopic study on the interaction mode of bis-(2-benzimidazolyl methylene) amine copper(Ⅱ) complex with DNA. J. Chem. 2005, 63, 71–74.
Zhou, Q. H.; Yang, F. S. Hydrolysis and cleavage of(Ⅱ) complex with bis(2-benzimidazolyl methylene) amine manganese complex. J. Chem. 2005, 21, 960–964.
Gamov, G. A.; Zavalishin, M. N.; Sharnin, V. A. Comment on the frequently used method of the metal complex-DNA binding constant determination from UV-Vis data. Spectrochimica Acta A 2019, 206, 160–164. doi: 10.1016/j.saa.2018.08.009
Fathima, S. S. A.; Paulpandiyan, R.; Nagarajan, E. R. Expatiating biological excellence of aminoantipyrine derived novel metal complexes: combined DNA interaction, antimicrobial, free radical scavenging studies and molecular docking simulations. J. Mol. Catal. A-Chem. 2019, 1178, 179–191.
Hegde, D.; Naik, G. N.; Vadavi, R. S.; Kumar, V. S.; Barretto, D. A.; Gudasi, K. B. Transition metal complexes of N΄-(2-(hydroxyimino) propanoyl) isonicotinohydrazide: synthesis, characterization, DNA interaction and anticancer evaluation. Inorg. Chim. Acta 2017, 461, 301–315. doi: 10.1016/j.ica.2017.02.034
Li, S.; Miao, T. F.; Fu, X. L.; Ma, F.; Gao, H.; Zhang, G. P. Theoretical study on the DNA interaction properties of copper(Ⅱ) complexes. Comput. Biol. Chem. 2019, 80, 244–248. doi: 10.1016/j.compbiolchem.2019.03.021
Marzieh, A.; Masoud, T. M. In vitro DNA and BSA-binding, cell imaging and anticancer activity against human carcinoma cell lines of mixed ligand copper(Ⅱ) complexes. Spectrochimica Acta A 2015, 150, 390–402. doi: 10.1016/j.saa.2015.05.076
Sharma, N. K.; Ameta, R. K.; Singh, M. Spectrophotometric and physicochemical studies of newly synthesized anticancer Pt(Ⅳ) complexes and their interactions with CT-DNA. J. Mol. Liq. 2016, 222, 752–761. doi: 10.1016/j.molliq.2016.07.101
Kumar, A.; Kumar, A.; Gupta, R. K.; Paitandi, R. P.; Singh, K. B. Cationic Ru(Ⅱ), Rh(Ⅲ) and Ir(Ⅲ) complexes containing cyclic π-perimeter and 2-aminophenyl benzimidazole ligands: synthesis, molecular structure, DNA and protein binding, cytotoxicity and anticancer activity. J. Organomet. Chem. 2016, 801, 68–79. doi: 10.1016/j.jorganchem.2015.10.008
Dehkhodaei, M.; Sahihi, M.; Rudbari, H. A.; Gharaghani, S.; Azadbakht, R.; Taheri, S.; Kajani, A. A. Studies of DNA- and HSA-binding properties of new nano-scale green synthesized Ni(Ⅱ) complex as anticancer agent using spectroscopic methods, viscosity measurement, molecular docking, MD simulation and QM/MM. J. Mol. Liq. 2017, 248, 24–35. doi: 10.1016/j.molliq.2017.10.044
Hou, T. T.; Bian, J. Y.; Yue, X. R.; Yue, S. M.; Ma, J. F. Synthesis, crystal structure, photoluminescence and theoretical studies of a series of copper(Ⅰ) compounds based on imidazole derivatives. Inorg. Chim. Acta 2013, 394, 15–20. doi: 10.1016/j.ica.2012.07.020
Hou, T. T.; Yue, S. M.; Yue, X. R.; Ma, J. F. Syntheses, crystal structures, and properties of nickel and cadmium complexes containing imidazole derivatives. J. Coord. Chem. 2012, 65: 22, 3895–3902.
Yue, X. R.; Chen, Y. N.; Yang, G. C.; Yue, S. M.; Su, Z. M. Synthesis, crystal structures and DNA-binding properties of Cd(Ⅱ), Cu(Ⅱ) and Ni(Ⅱ) complexes with 2-(2-pyridyl) benzothiazole. Synth. Met. 2015, 200, 1–6. doi: 10.1016/j.synthmet.2014.12.022
Yue, S. M.; Qi, S.; Li, Y. H.; Yang, Y. Syntheses, crystal structures and DNA-binding properties of Zn(Ⅱ), Ni(Ⅱ) and Co(Ⅱ) compounds containing thiazole derivatives. J. Struct. Chem. 2018, 37, 1945–1959.
Sheldrick, G. M. Acta Crystallog A 2008, 64, 112. doi: 10.1107/S0108767307043930
Sheldrick, G. M. Acta Cryst. 2015, C71, 3–8.
Schmidt, M. W.; Baldridge, K. K.; Boatz, J. A.; Elbert, S. T.; Gordon, M. S. General atomic and molecular electronic structure system. J. Comput. Chem. 1993, 14, 1347–1363. doi: 10.1002/jcc.540141112
Guo, Q.; Zhang, Z. H.; Song, Y. T.; Liu, S.; Gao, W.; Qiao, H.; Guo, L. L. Investigation on interaction of DNA and several cationic surfactants with different head groups by spectroscopy, gel electrophoresis and viscosity technologies. Chemosphere 2017, 168, 599–605. doi: 10.1016/j.chemosphere.2016.11.019
Bonacorso, H. G.; Calheiro, T. P.; Iglesias, B. A.; Silveira, C. H. D. Multinuclear NMR spectroscopy, photophysical, electrochemical and DNA-binding properties of fluorinated 1, 8-naphthyridine-based boron heterocycles. J. Fluorine Chem. 2018, 205, 8–14. doi: 10.1016/j.jfluchem.2017.11.006
Silveira, C. H. D.; Garoforo, E. N.; Chaves, O. A.; Gonçalves, P. F. B.; Streit, L. Synthesis, spectroscopy, electrochemistry and DNA interactive studies of meso-tetra (1-naphthyl) porphyrin and its metal complexes. Inorg. Chim. Acta 2018, 482, 542–553. doi: 10.1016/j.ica.2018.06.052
Ding, P. P.; Wang, Y.; Kou, H. Z.; Li, J. F.; Shi, B. X. Synthesis of heterobinuclear Cu(Ⅱ)-Ni(Ⅱ) complex: structure, CT-DNA interaction, hydrolytic function and antibacterial studies. J. Mol. Struct. 2019, 1196, 836–843. doi: 10.1016/j.molstruc.2019.06.081
Daravath, S.; Vamsikrishna, N.; Ganji, N.; Venkateswarlu, K. Synthesis, characterization, DNA binding ability, nuclease efficacy and biological evaluation studies of Co(Ⅱ), Ni(Ⅱ) and Cu(Ⅱ) complexes with benzothiazole Schiff base. Chemical Data Collections 2018, 17–18, 159–168.
Goswami, S.; Ray, S.; Sarkar, M. Spectroscopic studies on the interaction of DNA with the copper complexes of NSAIDs lornoxicam and isoxicam. International Int. J. Biol. Macromol. 2016, 93, 47–56. doi: 10.1016/j.ijbiomac.2016.08.025
Bandyopadhyay, N.; Pradhan, A. B.; Das, S.; Lu, L.; Zhu, M. Synthesis, structure, DFT calculations, electrochemistry, fluorescence, DNA binding and molecular docking aspects of a novel oxime based ligand and its palladium(Ⅱ) complex. J. Photoch. Photobio. B 2016, 160, 336–346. doi: 10.1016/j.jphotobiol.2016.04.026
Alreja, P.; Kaur, N. DNA and copper(Ⅱ) governed fluorescence tuning of phenanthroline possessing Ru(Ⅱ) complex. Interplay of electrostatic interactions. Inorg. Chem. Commun. 2017, 77, 51–54. doi: 10.1016/j.inoche.2017.01.033
Palanimuthu, D.; Samuelson, A. G. Dinuclear zinc bis(thiosemicarbazone) compounds: synthesis, in vitro anticancer activity, cellular uptake and DNA interaction study. Inorg. Chim. Acta 2013, 408, 152–161. doi: 10.1016/j.ica.2013.09.014
Keypour, H. K.; Forouzandeh, F.; Salehzadeh, S.; Hajibabaei, F.; Feizi, S.; Karamian, R. DNA binding studies and antibacterial properties of a new Schiff base ligand containing homopiperazine and products of its reaction with Zn(Ⅱ), Cu(Ⅱ) and Co(Ⅱ) metal ions: X-ray crystal structure of Cu(Ⅱ) and Zn(Ⅱ) complexes. Polyhedron 2019, 170, 584–592. doi: 10.1016/j.poly.2019.06.023
Saeidifar, M.; Mirzaei, H.; Nasab, N. A.; Torshizi, H. M. Mononuclear Pd(Ⅱ) complex as a new therapeutic agent: synthesis, characterization, biological activity, spectral and DNA binding approaches. J. Mol. Struct. 2017, 1148, 339–346. doi: 10.1016/j.molstruc.2017.06.139
Shankaraiah, N.; Jadala, C.; Nekkanti, S.; Senwar, K. R.; Nagesh, N.; Shrivastava, S. Design and synthesis of C3-tethered 1, 2, 3-triazolo-β-carboline derivatives: anticancer activity, DNA-binding ability, viscosity and molecular modeling studies. Bioorg. Chem. 2016, 64, 42–50. doi: 10.1016/j.bioorg.2015.11.005

Figure 11 Absorption spectra of (a) [Cd(pbm)(odc)2], (b) [Co(pbm)(odc)2], (c) [Cu(pbm)(odc)2] and (d) [Zn(pbm)(odc)2] in tris-HCl buffer (pH 7.0) in the absence and presence of increasing the amount of DNA at room temperature. Inset: arrow shows change in intensity with increasing the concentration of DNA

Figure 12 Emission spectra of (a) [Cd(pbm)(odc)2], (b) [Co(pbm)(odc)2], (c) [Cu(pbm)(odc)2] and (d) [Zn(pbm)(odc)2] in tris-HCl buffer (pH 7.0) in the presence and absence of CT-DNA at room temperature. Arrow shows change in intensity with increasing the concentration of DNA

Figure 13 Relative viscosity of CT-DNA upon addition of increasing the amounts of complexes 1~4 (r = 0.0~1.0). η is the viscosity of DNA in the presence of complex, and η0 is the viscosity of DNA alone
Table 1. Crystal Data and Structure Refinement for 1~4
| Complexes | 1 | 2 | 3 | 4 |
| CCDC | 1924089 | 1938100 | 1938101 | 1924090 |
| Chemical formula | C26H17CdN3O5 | C26H17CoN3O5 | C26H17CuN3O5 | C26H17N3O5Zn |
| Temperature (K) | 296.15 | 173.0 | 187.49 | 293(2) |
| Mr | 563.82 | 510.35 | 514.96 | 516.79 |
| Crystal system | Monoclinic | Monoclinic | Monoclinic | Monoclinic |
| Space group | P21/n | P21/n | P21/c | P21/n |
| a (Å) | 7.4963(4) | 7.3081(9) | 13.1636(10) | 7.4336(8) |
| b (Å) | 18.3015(10) | 18.501(3) | 15.3767(10) | 18.470(2) |
| c (Å) | 16.5769(9) | 16.257(2) | 11.3600(8) | 16.2706(18) |
| α (º) | 90 | 90 | 90 | 90 |
| β (º) | 98.3510(10) | 99.310(5) | 100.141(4) | 99.863(2) |
| γ (º) | 90 | 90 | 90 | 90 |
| Volume (Å3) | 2250.1(2) | 2169.0(5) | 2263.5 | 2200.9(4) |
| Z | 4 | 4 | 4 | 4 |
| Dc (g·cm-3) | 1.664 | 1.563 | 1.511 | 1.560 |
| F(000) | 1128.0 | 1044.0 | 1052.0 | 1056.0 |
| 2θ range for data collection | 5.69 to 51.424 | 5.536 to 50.12 | 8.924 to 130.15 | 3.36 to 49.364 |
| Reflections collected/unique | 13616/4273(Rint = 0.0610) | 21572/3835(Rint = 0.0881) | 13027/3757(Rint = 0.0532) | 12201/3754(Rint = 0.1168) |
| Goodness-of-fit on F2 | 1.027 | 1.055 | 1.129 | 1.020 |
| Final R indexes (I > 2σ(I)) | R = 0.0518, wR = 0.1222 | R = 0.0624, wR = 0.1293 | R = 0.0851, wR = 0.1790 | R = 0.0667, wR = 0.1717 |
| Final R indexes (all data) | R = 0.0918, wR = 0.1417 | R = 0.0927, wR = 0.1428 | R = 0.1106, wR = 0.1942 | R = 0.1639, wR = 0.2547 |
 下载: 导出CSV
Table 2. Concentration Ratio of the Mixed Solution
| Material number | Tris (μL) | DNA(μL) | Complex (μL) |
| 1 | 2700 | 0 | 300 |
| 2 | 2400 | 300 | 300 |
| 3 | 2100 | 600 | 300 |
| 4 | 1800 | 900 | 300 |
| 5 | 1500 | 1200 | 300 |
| 6 | 1200 | 1500 | 300 |
下载: 导出CSV
Table 3. Selected Bond Lengths (Å) and Bond Angles (°) of Complexes 1~4
| Complex 1 | Complex 2 | Complex 3 | Complex 4 | |||||||
| Bond | Dist. | Bond | Dist. | Bond | Dist. | Bond | Dist. | |||
| Cd(1)–O(1) | 2.256(4) | Co(1)–O(1) | 2.142(3) | Cu(1)–O(1) | 1.856(5) | Zn(1)–O(1) | 2.132(6) | |||
| Cd(1)–O(2) | 2.286(4) | Co(1)–O(2) | 2.108(3) | Cu(1)–O(4)#1 | 2.092(6) | Zn(1)–O(2) | 2.158(7) | |||
| Cd(1)–O(4)#1 | 2.372(4) | Co(1)–O(4)#1 | 2.202(3) | O(1)–Cu(1A)#2 | 1.684(7) | Zn(1)–O(4)#1 | 2.145(6) | |||
| Cd(1)–O(5)#1 | 2.307(4) | Co(1)–O(5)#1 | 2.126(3) | O(5)–Cu(1A)#2 | 2.408(7) | Zn(1)–O(5)#1 | 2.247(7) | |||
| Cd(1)–N(1) | 2.369(6) | Co(1)–N(1) | 2.169(5) | Cu(1)–N(1) | 2.051(6) | Zn(1)–N(1) | 2.045(7) | |||
| Cd(1)–N(2) | 2.236(5) | Co(1)–N(2) | 2.046(4) | Cu(1)–N(2) | 1.966(7) | Zn(1)–N(3) | 2.216(9) | |||
| Angle | (°) | Angle | (°) | Angle | (°) | Angle | (°) | |||
| C(13)–O(1)–Cd(1) | 91.1(4) | C(13)–O(1)–Co(1) | 87.8(3) | C(13)–O(1)–Cu(1) | 102.9(4) | C(1)–O(1)–Zn(1) | 90.1(6) | |||
| C(13)–O(2)–Cd(1) | 89.8(4) | C(13)–O(2)–Co(1) | 89.4(3) | C(26)–O(4)–Cu(1)#2 | 99.3(5) | C(1)–O(2)–Zn(1) | 88.2(6) | |||
| C(1)–N(1)–Cd(1) | 126.4(5) | C(1)–N(1)–Co(1) | 129.0(4) | N(1)–Cu(1)–O(4)#1 | 163.7(3) | C(15)–N(1)–Zn(1) | 136.6(7) | |||
| C(5)–N(1)–Cd(1) | 114.7(4) | C(5)–N(1)–Co(1) | 113.7(3) | C(5)–N(1)–Cu(1) | 113.2(3) | C(21)–N(1)–Zn(1) | 114(6) | |||
| C(6)–N(2)–Cd(1) | 113.8(4) | C(6)–N(2)–Co(1) | 113.0(3) | C(1)–N(1)–Cu(1) | 126.8(3) | C(22)–N(3)–Zn(1) | 112.5(7) | |||
| C(7)–N(2)–Cd(1) | 137.5(4) | C(7)–N(2)–Co(1) | 138.8(3) | C(6)–N(2)–Cu(1) | 112.0(10) | C(26)–N(3)–Zn(1) | 128.7(7) | |||
| O(1)–Cd(1)–N(1) | 117.74(16) | O(1)–Co(1)–N(1) | 92.03(15) | C(7)–N(2)–Cu(1) | 142.3(6) | O(1)–Zn(1)–N(3) | 109.7(3) | |||
| O(2)–Cd(1)–N(1) | 93.88(17) | O(2)–Co(1)–N(1) | 105.96(14) | O(1)–Cu(1)–N(1) | 92.1(2) | O(2)–Zn(1)–N(3) | 91.9(3) | |||
| O(2)–Cd(1)–N(1) | 93.88(17) | N(2)–Co(1)–O(1) | 159.98(15) | O(1)–Cu(1)–N(2) | 153.5(2) | N(1)–Zn(1)–O(1) | 102.7(3) | |||
| N(2)–Cd(1)–O(2) | 155.42(18) | N(2)–Co(1)–O(2) | 103.22(15) | N(2)–Cu(1)–N(1) | 81.6(3) | N(1)–Zn(1)–O(2) | 156.7(3) | |||
| N(2)–Cd(1)–N(1) | 72.96(18) | N(2)–Co(1)–N(1) | 78.38(16) | C(6)–N(2)–C(7) | 105.6(10) | N(1)–Zn(1)–N(3) | 77.5(3) | |||
| O(1)–Cd(1)–O(2) | 57.63(15) | O(2)–Co(1)–O(1) | 62.24(12) | C(8)–N(3)–C(6) | 106.8(9) | O(1)–Zn(1)–O(2) | 61.1(3) | |||
下载: 导出CSV

 扫一扫看文章


扫一扫关注我们


