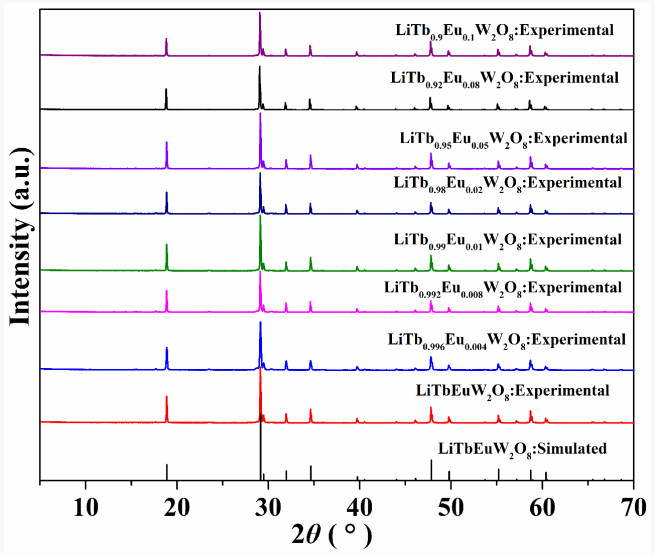
Figure 1.
XRD patterns of solid solution LiTb1-xEux(WO4)2 (x = 0, 0.004, 0.008, 0.01, 0.02, 0.05, 0.08, 0.1) and simulated patterns of LiTb(WO4)2

Crystal Structure of Scheelite-type LiTb(WO4)2 and Multi-color Emitting Properties Doped by Eu3+
Ya-Li XUE , Dan ZHAO , Xiao-Qi CUI , Xiao-Yang HAN , Bao-Zhong LIU , Yan-Ping FAN


In recent years, rare-earth (Ln3+) activated phosphors have been widely used in modern society to meet the increasing need for the creative applications in everyday devices, such as TV screens, computer monitors, electronic billboards, portable electronics, and white light emitting diodes (WLED)[1-5]. Typically, the method of commercial white LEDs produced by Nichia Corporation is to combine a blue InGaN chip with a yellow phosphor YAG: Ce3+, wherein blue light excites the phosphor[6, 7]. To improve the luminous efficiency, a new way which combined a near-ultraviolet (UV) LED chip with red, green and blue phosphors has been suggested. Such a combination can yield high color reproducibility and rendering index. Therefore, green and red phosphors with high thermal and chemical stability which can be excited by near UV around 400 nm attracted much attention in the past few years because of the amazing phenomenon of multi-color and tunable emission, such as K8Nb7P7O39: Eu3+[8], Ba3Y(PO4)3: Ce3+/Tb3+[9] and so on[10-13].
It is well-known that the energy transfer process usually has many effects on altering the luminescence intensity, color and lifetime of a phosphor[14]. As two famous Ln3+ ions, Tb3+ and Eu3+ show intense green and red emissions due to the 4f → 4f transitions, respectively[9, 15]. Moreover, Tb3+ and Eu3+ co-doped phosphors usually show an effective energy transfer from Tb3+ to Eu3+, which have been produced many references[16-20]. However, the common feature of most reports is that Eu3+ and Tb3+ ions are co-doped in a third-party host, whereas Eu3+-doped terbium based compounds have rarely been reported.
Rare-earth double tungstate with the general formula ALn(WO4)2 (A = Li, Na, K, Rb, Cs; Ln = Y, La-Lu) has attracted much attention for their applications as luminescent host materials[21-23]. Most of these crystals feature a scheelite-type structure with tetragonal I41/a symmetry at room temperature[24]. For LiTb(WO4)2, the structure can be thought as the substitution of two Ca2+ ions in CaWO4 by a couple of Li+ and Tb3+ ions in a statistical manner. Although the crystal structure of LiTb(WO4)2 is characterized by powder X-ray diffraction analysis in the literature[25], no single crystal data have been given until now.
In this work, we report the single crystal growth and structure determination of LiTb(WO4)2. Moreover, a series of LiTb1-xEux(WO4)2 (x = 0, 0.004, 0.008, 0.01, 0.02, 0.05, 0.08, 0.1) solid solutions were prepared, which show multi-color light emitting performance due to the efficient Tb3+→Eu3+ charge transfer.
All raw materials of Li2CO3 (≥99.5%), WO3 (≥99.9%), Eu2O3 (≥99.95%) and Tb4O7 (≥99.95%) were purchased from Sinopharm Chemical Reagent Shanghai limited company and used without any further purification. The X-ray powder diffraction (XRD) analysis was performed by Rigaku DMax2500 diffractometer with graphite-monochromatic CuKα characteristic radiation (2θ = 5~70°). Photoluminescence spectra were carried out by FLS920 Edinburgh Analytical Instrument apparatus. The infrared absorption spectrum was recorded on a Perkin Elmer (FTIR 2000) spectrometer in the change of 1000~450 cm-1. Sample in powder form was pressed into a disk using pellet of KBr.
Single crystals of LiTb(WO4)2 were prepared by the high-temperature flux method by using Li2O−WO3 as a flux. It was grown from a mixture of Li2CO3 (0.3400 g, 4.6009 mmol), Tb4O7 (0.4300 g, 0.5751 mmol), and WO3 (2.0000 g, 8.6267 mmol) with the molar ratio of 8:1:15 in a 20 mL Pt crucible. The mixture was placed in a vertical programmable temperature furnace, and then heated at 900 ℃ and kept this temperature until the solution became transparent and clear enough in the open air, then cooled at a rate of 2 ℃∙h−1 to 600 ℃, to grow single crystals. Finally, the production was washed by hot water to dissolve the addition flux and then a few colorless crystals of high optical quality were obtained.
Powder sample of LiTb(WO4)2 was prepared by the high-temperature solid state reaction method according to the following solid-state reactions:
|
|
The raw materials of Li2CO3 (0.0797 g, 1.0785 mmol), WO3 (1.0000g, 4.3134 mmol) and Tb4O7 (0.4031g, 0.5391 mmol), with the stoichiometric molar ratio of 2:8:1, were thoroughly grounded and pressed into a pellet. Then the mixture was transferred into a proper platinum crucible and preheated at 500 ℃ for 5 h at a muffle furnace. After that, the mixture was ground again to guarantee the best homogeneity and then continue to heat to 800 ℃ for 48 h in the open air. In this stage, it is very important to grind and mix the mixture every ten hours to improve crystallinity. Moreover, powder samples of LiTb1-xEux(WO4)2 (x = 0.004, 0.008, 0.01, 0.02, 0.05, 0.08, 0.1) were prepared by the same way according to the following solid-state reactions.
|
|
The purity of the powders was confirmed by powder XRD (2θ = 5~70°) analysis, as shown in Fig. 1. The experimental patterns were well indexed to the pure tetragonal phase of LiTb(WO4)2 and no other phase was observed, which indicated that the powder samples are pure and the structure model is right.
Several proper crystals (0.20mm × 0.05mm × 0.05mm) were selected and carefully mounted in fiberglass for single-crystal X-ray diffraction (SC-XRD) analysis. The set of intensity data was carried out using a Bruker Smart Apex2 CCD with graphite-monochromatic MoKα (λ = 0.71073 Å) radiation at 296 K. All of the atoms were refined with anisotropic thermal parameters. The important bond distances and bond angles are given in Table 1.

 DownLoad:
CSV
DownLoad:
CSV
| Bond | Dist. | Bond | Dist. | Bond | Dist. | ||
| W(1)–O(1) | 1.784(5) | Tb(1)–O(1)iv | 2.405(5) | Tb(1)–O(1) | 2.416(5) | ||
| W(1)–O(1)i | 1.784(5) | Tb(1)–O(1)v | 2.405(5) | Tb(1)–O(1)vi | 2.405(5) | ||
| W(1)–O(1)ii | 1.784(5) | Tb(1)–O(1)ix | 2.416(5) | Tb(1)–O(1)vii | 2.405(5) | ||
| W(1)–O(1)iii | 1.784(5) | Tb(1)–O(1)x | 2.416(5) | Tb(1)–O(1)viii | 2.416(5) | ||
| Angle | (°) | Angle | (°) | Angle | (°) | ||
| O(1)–W(1)–O(1)i | 107.03(16) | O(1)i–W(1)–O(1)ii | 114.5(3) | O(1)i–W(1)–O(1)iii | 107.03(16) | ||
| O(1)–W(1)–O(1)ii | 107.04(16) | O(1)–W(1)–O(1)iii | 114.5(3) | O(1)ii–W(1)–O(1)iii | 107.03(16) | ||
| Symmetry codes: (i) –y+1/4, x+1/4, –z+1/4; (ii) y–1/4, –x+1/4, –z+1/4; (iii) –x, –y+1/2, z; (iv) –x–1/2, –y+3/2, –z+1/2; (v) y–5/4, –x+3/4, z–1/4; (vi) –y+1/4, x+3/4, z–1/4; (vii) x–1/2, y, –z+1/2; (viii) y–5/4, –x+1/4, –z+1/4; (ix) –y+1/4, x+5/4, –z+1/4; (x) –x–1, –y+3/2, z | |||||||
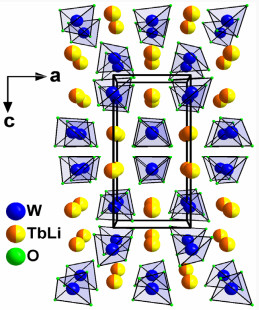
SC-XRD analysis indicates that compound LiTb(WO4)2 belongs to the tetragonal centrosymmetric space group I41/a and exhibits a three-dimensional (3D) network consisting of two-direction packing of isolated WO4 tetrahedra and Li/Tb atoms (Fig. 2). The reason that Li and Tb atoms were expressed as Li/Tb is that they are disordered and randomly occupy the same 4a site. The Li|Tb atom is coordinated by eight oxygen atoms with Li/Tb–O bond distances ranging from 2.405(5) to 2.416(5) Å (Table 1). W atom locates at the center of a tetrahedron with the four equal W–O bond distances of 1.784(5) Å, and O–W–O bond angles fall in the range of 107.04(16)~114.5(3)°. These values are common compared with other reports[26-28].
The Fourier transform infrared (FT-IR) spectrum of LiTb(WO4)2 was recorded to characterize the structural detail, as shown in Fig. 3. A series of absorption peaks from 450 to 1000 cm−1 originate from the vibrations of WO4 tetrahedra. Among them, the bands at 874 and 515 cm-1 can be assigned to stretching modes of W–O in WO4 tetragon. The bands at 829 and 706 cm−1 correspond to the ν1 and ν3 modes of the WO4 tetrahedra, respectively. The band at 609.5 cm−1 was due to the symmetrical vibrations of bridge oxygen atoms of Li/Tb–O–W groups[29, 30]. The IR spectrum confirms the existence of tetrahedrally coordinated tungsten atoms, which is consistent with the results obtained from the single-crystal X-ray structural analysis.
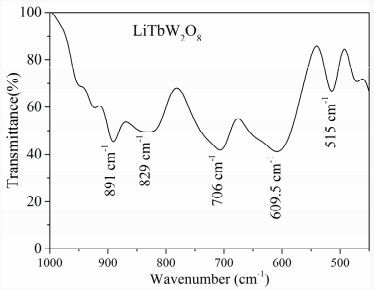
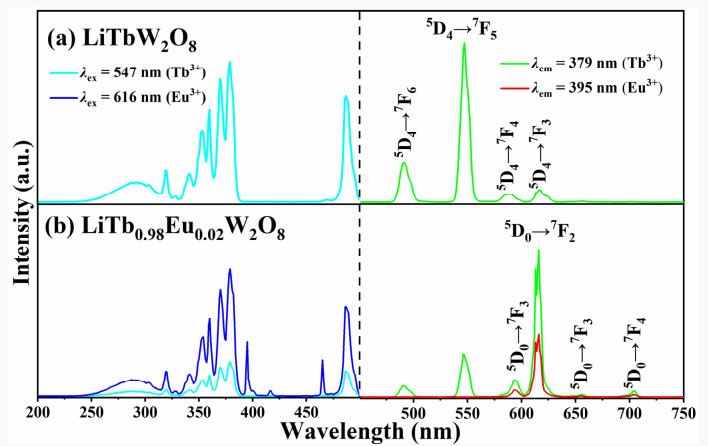
Fig. 4a shows the excitation spectra of undoped LiTb(WO4)2 phosphor by monitoring green emission 547 nm (5D0→7F2) in the range of 200~500 nm at room temperature. There exist a series of narrow bands in the range from 315 to 390 nm, which can be assigned to the spin-forbidden 4f→4f transitions of Tb3+: 7F6→5D0 (319 nm), 7F6→5G2 (341 nm), 7F6→5D2 (353 nm), 7F6→5G5 (360 nm), 7F6→5G6 (370 nm), 7F6→5D3 (379 nm) and 7F6→5D4 (487 nm), as listed in Table 2. The peak at 379 nm is the strongest, which is a common character compared with other reported phosphors[31, 32]. Under excitation of 379 nm, four typical emission peaks from blue to red region are generated, which can be assigned to the 5D4→7FJ (J = 3, 4, 5, 6) transition of Tb3+, that is, 491 nm (5D4→7F6) in the blue region, 547 nm (5D4→7F5) in the green region, and 589 nm (5D4→7F4) and 616 nm (5D4→7F3) in the red region. The strongest one is located at 547 nm, which is the reason why compound LiTb(WO4)2 exhibits strong green emission. This result is essentially in agreement with other Tb3+ activated phosphors, such as K2Ln(PO4)(WO4): Tb3+[31] and Li3Sc(BO3)2: 0.01Tb3+[32].
 DownLoad:
CSV
DownLoad:
CSV
| No. | Wavelength (nm) | Activation ion | Excitation transition |
| 1 | 319 | Tb3+ | 7F6→5D0 |
| 2 | 341 | Tb3+ | 7F6→5G2 |
| 3 | 354 | Tb3+ | 7F6 →5D2 |
| 4 | 360 | Tb3+ | 7F6 →5G5 |
| 5 | 370 | Tb3+ | 7F6 →5G6 |
| 6 | 379 | Tb3+ | 7F6 →5D3 |
| 7 | 395 | Eu3+ | 7F0 →5L6 |
| 8 | 417 | Eu3+ | 7F0 →5D3 |
| 9 | 465 | Eu3+ | 7F0 →5D2 |
| 10 | 487 | Tb3+ | 7F0 →5D4 |
The excitation and emission spectra of LiTb0.99Eu0.01(WO4)2 at different excitation and emission wavelengths are given in Fig. 4b. It is obvious that the green emission of LiTb(WO4)2 changes greatly when doped with Eu3+. The excitation spectrum by monitoring at 547 nm (5D4→7F5) is similar to undoped sample LiTb(WO4)2 (Fig. 4a). By monitoring at 616 nm (5D0→7F2), the characterize excitation peaks of both Tb3+ (319, 341, 353, 360, 370, 379, 487 nm) and Eu3+ (395, 417, 465 nm) appear together (Table 2), indicating that an energy transfer occurs from Tb3+ to Eu3+. On the other hand, the characterize emission peaks of both Tb3+ (491, 547 nm) and Eu3+ (594, 616, 656, 703 nm) appear together in the emission spectrum excited by monitoring at wavelength 379 nm (7F6→5D3), whereas by 395 nm (7D0→5L6) is similar to pure Eu3+ samples or Eu3+ doped materials[33-35]. This clearly proves that energy transfer takes place from Tb3+ to Eu3+ but the back transfer Eu3+→Tb3+ does not exist in the LiTb0.99Eu0.01(WO4)2 sample. It is a good property for solid solution phosphor LiTb0.98Eu0.02(WO4)2 that a broad near-UV (350~400 nm) light can be strongly absorbed, which is nicely in agreement with the excitation wavelength around 400 nm for near-UV LEDs and blue LEDs in commercial LED, respectively[36-40].
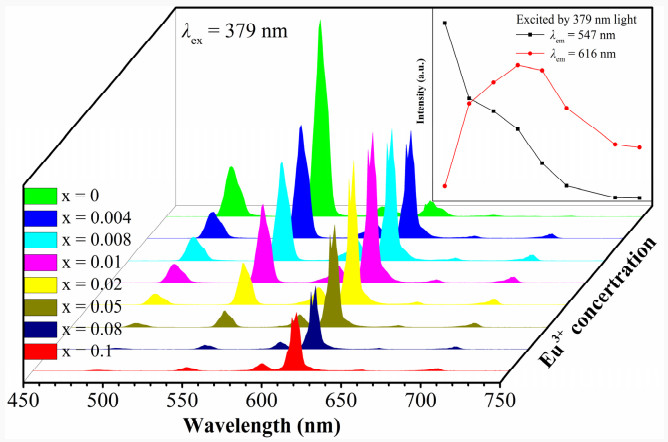
To further investigate the energy, transfer process of Tb3+→Eu3+, the concentration-dependent luminescent properties of a serials of LiTb1-xEux(WO4)2 (x = 0, 0.004, 0.008, 0.01, 0.02, 0.05, 0.08, 0.1) phosphors were studied. As shown in Fig. 5, all spectra reveal the characteristics of emission bands of Tb3+ and Eu3+. Simultaneously, the emission spectrum clearly shows the decrease of Tb3+ characterizes peaks (487, 547 nm) with increasing the Eu3+ concentration from 0 to 0.1. On the contrary, the Eu3+ characteristic emissions (595, 616, 656 and 703 nm) firstly increase with the increase of Eu3+ concentration from 0 to 0.01, and then decrease when the concentration exceeds 0.01. There are two possible reasons for this phenomenon. One is the concentration quenching of excess Eu3+, and the other is that 378 nm is not more suitable than 395 nm[41, 42].
It should be mentioned that the emission spectrum with 487 nm excitation (7F6 → 5D4 of Tb3+) is similar with 379 nm (7F6 → 5D3 of Tb3+) excitation spectra, enhancing the probability of Tb3+ → Eu3+ energy transfer along with the increase of Eu3+ dopant. The energy transfer efficiencies of LiTb1-xEux(WO4)2 (x = 0.004, 0.008, 0.01, 0.02, 0.05, 0.08, 0.1) phosphors can be calculated by using the equation as follows[15, 36]:
|
|
(1) |
where I and I0 represent the 547 nm emission intensity of Tb3+ host in the presence and absence of activator Eu3+[43]. The efficiency values were calculated to be 42.4%, 49.7%, 59.9%, 78.8%, 91.5%, 97.9% and 98.1% for Eu3+ concentrations of 0.4%, 0.8%, 1%, 2%, 5%, 8% and 10%, respectively. We can see that the value is 59.9% with Eu3+ concentration of 1%, and it increases significantly with increasing the Eu3+ concentration until 5%, 59.9%→91.5%[31]. Then the ηCT(I) values increase slowly, 91.5%→98.1%, for the Eu3+ concentration of 5%→10%, showing the saturation of Tb3+→Eu3+ charge transfer. This result suggests an efficient Tb3+→Eu3+ charge transfer process and Eu3+ is an excellent activator in LiTb(WO4)2 host.
As shown in Fig. 6, the PL decay curve of LiTb1-x(WO4)2: xEu3+ phosphors (excitation: 379 nm, emission: 547 nm) are well fitted with the single-exponential function[43, 44]:
|
|
(2) |
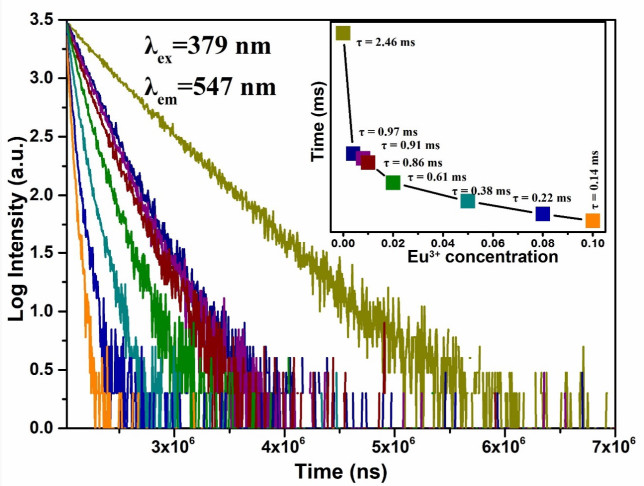
where I0 is the baseline correction, A1 is a pre-exponential factor obtained from the curve fitting, and τ is the lifetime of exciting state. The fitting τ value is 2.46, 0.97, 0.91, 0.86, 0.61, 0.38, 0.22 and 0.14 ms for LiTb1-x(WO4)2: xEu3+ samples with x = 0%, 0.4%, 0.8%, 1%, 2%, 5%, 8% and 10%, respectively. The luminescent decay lifetime of Tb3+ emission at 547 nm decreased rapidly with increasing the concentration of Eu3+ ions, indicating the existence of ET from Tb3+ to Eu3+.
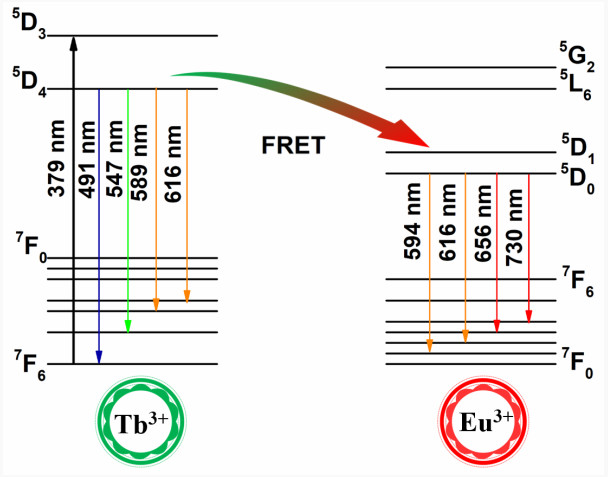
The energy transfer process between Tb3+ and Eu3+ ions is shown in Fig. 7. The electrons of Tb3+ ions are excited by the 379 nm photons to their 5D3 level. Some of them relax to the 7F6, 7F5, 7F4 and 7F3 levels for generating the blue, green and red emissions, while the energy transfer is possible due to the nearby electrons of the Eu3+ to the excited 5D1, 0 level[45]. Subsequently, the electrons of Eu3+ relax to the 7FJ (J = 1~6) levels quickly, which generates the orange and red emissions. Notably, the characteristic emission of Eu3+ is enhanced because of the effective overlap between 5D4→7FJ (J = 3~6) emissions of Tb3+ and the 7F1 → 5D1, 2 absorption of Eu3+.
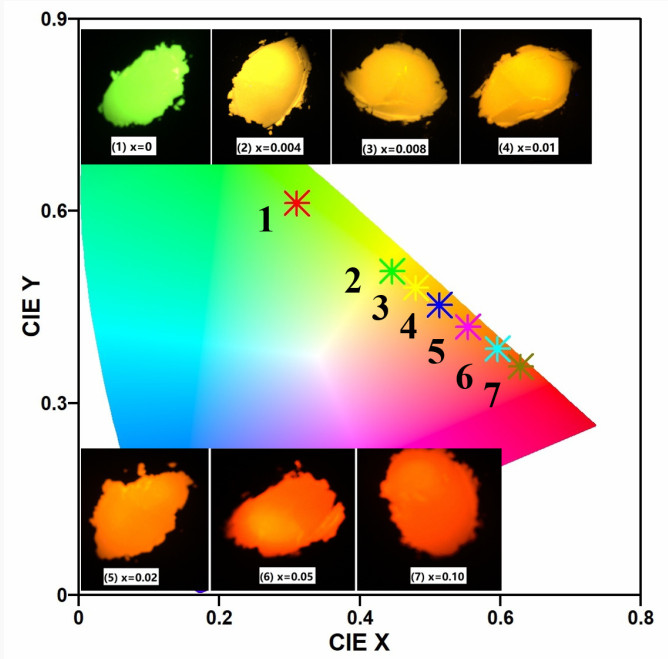
Because the red emissions of Eu3+ and green emissions of Tb3+ simultaneously exist in solid solution materials LiTb1-xEux(WO4)2 (x = 0~0.1) under UV or near-UV light excitation, the multicolor tunable luminescence can be obtained by adjusting the x value. The color of any light can be represented as an (x, y) coordinate on the basis of Commission International de L'Eclairage (CIE) functions. As shown in Fig. 8, the luminescent color (excited by 379 nm) tuned from green, yellow, orange to red as the concentration of Eu3+ increases from 0 to 10% and the corresponding CIE coordinates are listed in Table 3. The other noteworthy thing is that the CIE chromaticity coordinate of LiTb0.9Eu0.1(WO4)2 is so close to the standard red chromaticity coordinates (0.667, 0.330) of the National Television System Committee (NTSC). These presented results indicate the potential application of LiTb1-xEux(WO4)2 phosphors for white-LEDs.
 DownLoad:
CSV
DownLoad:
CSV
| LiTb1-xEux(WO4)2 | λex (nm) | λem (nm) | CIE | |
| 1 | x = 0 | 379 | Embase = 450~750 | (0.3099, 0.612) |
| 2 | x = 0.004 | 379 | Embase = 450~750 | (0.4459, 0.5062) |
| 3 | x = 0.008 | 379 | Embase = 450~750 | (0.4795, 0.4801) |
| 4 | x = 0.01 | 379 | Embase = 450~750 | (0.5131, 0.4525) |
| 5 | x = 0.02 | 379 | Embase = 450~~750 | (0.5538, 0.4194) |
| 6 | x = 0.05 | 379 | Embase = 450~750 | (0.596, 0.3851) |
| 7 | x = 0.08 | 379 | Embase = 450~750 | (0.6223, 0.3614) |
| 8 | x = 0.1 | 379 | Embase = 450~750 | (0.6287, 0.3566) |
In summary, a single crystal of LiTb(WO4)2 was prepared using high-temperature molten salt method and structurally determined through single-crystal X-ray diffraction analysis. The results show that it features the scheelite-type structure and crystalizes in the tetragonal space group I41/a. Li+ and Tb3+ ions in the structure are disordered and randomly occupy the same site with the molar ratio of 1:1. A series of LiTb1-xEux(WO4)2 phosphors were prepared via a high-temperature solid-state reaction method. Due to the concentration-dependent energy transfer, the emission color of the phosphor can be continuously changed from green through yellow and eventually to red by changing the doping concentration of Eu3+ because of the energy transfer from Tb3+ to Eu3+ ions. Hence, we think that the as-prepared multicolor tunable phosphors could be a promising candidate for near UV convertible phosphor for LED and display applications.
Jiao, M. M.; Guo, N.; Lu, W.; Jia, Y. C.; Lv, W. Z.; Zhao, Q.; Shao, B. Q.; You, H. P. Tunable blue-green-emitting Ba3LaNa(PO4)3F: Eu2+, Tb3+ phosphor with energy transfer for near-UV white LEDs. Inorg. Chem. 2013, 52, 10340−10346. doi: 10.1021/ic401033u
Nelli, I.; Kaczmarek, A. M.; Locardi, F.; Caratto, V.; Costa, G. A.; Deun, R. V. Multidoped Ln3+ gadolinium dioxycarbonates as tunable white light emitting phosphors. Dalton Trans. 2017, 46, 2785−2792. doi: 10.1039/C6DT04629K
Morrison, G.; Smith, M. D.; Zur Loye, H. C. Flux versus hydrothermal growth: polymorphism of A2(UO2)Si2O6 (A = Rb, Cs). Inorg. Chem. 2017, 56, 1053−1056. doi: 10.1021/acs.inorgchem.6b02931
Zhang, F.; Zhang, T.; Li, G.; Zhang, W. Single phase M+ (M = Li, Na, K), Dy3+ co-doped KSrBP2O8 white light emitting phosphors. J. Alloys Compd. 2015, 618, 484−487. doi: 10.1016/j.jallcom.2014.08.178
Taşcıoğlu, S.; Pekgözlü, İ.; Mergen, A. Synthesis and photoluminescence properties of Pb2+ doped SrAl2B2O7. Mater. Chem. Phys. 2018, 112, 78−82.
Dhanaraj, J.; Jagannathan, R.; Trivedi, D. C. Y2O2S: Eu3+ nanocrystals-synthesis and luminescent properties. J. Mater. Chem. 2003, 13, 1778−1782. doi: 10.1039/B302073H
Bi, W.; Meng, Q. Y.; Sun, W. J. Luminescent properties and energy transfer mechanism of NaGd(MoO4)2: Sm3+, Eu3+ phosphors. Ceram. Int. 2016, 42, 14086−14093. doi: 10.1016/j.ceramint.2016.06.017
Zhao, D.; Cui, J. Y.; Han, H. X.; Li, C. K8Nb7P7O39: a new type of complicated incommensurately modulated structure and photoluminescence properties of Eu3+-doped solid solutions. J. Mater. Chem. C 2016, 4, 11436−11448. doi: 10.1039/C6TC03022J
Han, B.; Zhang, J.; Li, P.; Li, J.; Bian, Y.; Shi, H. L. Luminescence and energy transfer of emission tunable phosphors YBa3B9O18: Ce3+, Tb3+. Optik 2015, 126, 1851−1854. doi: 10.1016/j.ijleo.2015.05.003
Yawalkar, M. M.; Nair, G. B.; Zade, G. D.; Dhoble, S. J. Effect of the synthesis route on the luminescence properties of Eu3+ activated Li6M(BO3)3 (M = Y, Gd) phosphors. Mater. Chem. Phys. 2017, 189, 136−145. doi: 10.1016/j.matchemphys.2016.12.006
Yoon, S. J.; Hakeem, D. A.; Park, K. Synthesis and photoluminescence properties of MgAl2O4: Eu3+ phosphors. Ceram. Int. 2016, 42, 1261−1266. doi: 10.1016/j.ceramint.2015.09.059
Evans, R. C.; Carlos, L. D.; Douglas, P.; Rocha, J. Tuning the emission colour in mixed lanthanide microporous silicates: energy transfer, composition and chromaticity. J. Mater. Chem. 2018, 18, 1100−1107.
Zhang, F.; Xie, J.; Li, G.; Zhang, W.; Wang, Y.; Huang, Y.; Tao, Y. Cation composition sensitive visible quantum cutting behavior of high-efficiency green phosphors Ca9Ln(PO4)7: Tb3+ (Ln = Y, La, Gd). J. Mater. Chem. C 2017, 5, 872−881. doi: 10.1039/C6TC03982K
Xue, Y. L.; Zhao, D.; Shi, C. L.; Liu, B. Z.; Zhao, J.; Li, F. F. Energy transfer and green emitting properties of solid solution PbGd1-xTbxB7O13 (x = 0~1). Chin. J. Struct. Chem. 2018, 37, 1279−1286
Xu, Z. H.; Li, C. X.; Li, G. G.; Chai, R. T.; Peng, C.; Yang D. M.; Lin, J. Self-assembled 3D urchin-like NaY(MoO4)2: Eu3+/Tb3+ microarchitectures: hydrothermal synthesis and tunable emission colors. J. Phys. Chem. C 2010, 114, 2573−2582. doi: 10.1021/jp9115029
Nazarov, M. V.; Jeon, D. Y.; Kang, J. H.; Popovici, E. J.; Muresan, L. E.; Zamoryanskaya, M. V.; Tsukerblat, B. S. Luminescence properties of europium-terbium double activated calcium tungstate phosphor. Solid State Commun. 2004, 131, 307−311. doi: 10.1016/j.ssc.2004.05.025
Moadhen, A.; Elhouichet, H.; Canut, B.; Sandu, C. S.; Queslati, M.; Roger, J. A. Evidence for energy transfer between Eu3+ and Tb3+ in aporous silicon matrix. Mater. Sci. Eng. B 2003, 105, 157−160. doi: 10.1016/j.mseb.2003.08.036
Kim Annh, T.; Ngoc, T.; Thu Nga, P.; Bitch, V. T.; Long, P.; Strek, W. J. Energy transfer between Tb3+ and Eu3+ in Y2O3 crystals. J. Lumin. 1988, 39, 215−221. doi: 10.1016/0022-2313(88)90032-4
Shi, P. L.; Xia, Z. G.; Molokeev, M. S.; Atuchin, V. V. Crystal chemistry and luminescence properties of red-emitting CsGd1-xEux(MoO4)2 solid-solution phosphors. Dalton Trans. 2014, 43, 9669−9676. doi: 10.1039/C4DT00339J
Durairajan, A.; Thangaraju, D.; Babu, S. M.; Valente, M. A. Luminescence characterization of sol-gel derived Pr3+ doped NaGd(WO4)2 phosphors for solid-state lighting applications. Mater. Chem. Phys. 2016, 179, 295−303. doi: 10.1016/j.matchemphys.2016.05.042
Zhao, D.; Zhao, E. X.; Xin, X.; Li, F. F. Single-crystal structure and bond structure of Scheelite-like KGd(MoO4)2. Chin. J. Inorg. Chem. 2014, 30, 1143−1150.
Rudowicz, C.; Karbowiak, M.; Gnutek, P.; Lewandowska, M. Comparative analysis of crystal-field parameters for rare-earth ions at monoclinic sites in AB(WO4)2 crystals: Ⅱ. Pr3+ and Nd3+ ions in KRE(WO4)2 (RE = Y or Gd), Pr3+ ions in M+Bi(XO4)2 (M+ = Li or Na and X = W or Mo), and Nd3+ ions in NaBi(WO4)2 and AgNd(WO4)2. J. Phys. : Condens. Matter. 2014, 26, 065501−15. doi: 10.1088/0953-8984/26/6/065501
Han, S. J.; Bai, C. Y.; Zhang, B. B.; Yang, Z. H.; Pan, S. L. Synthesis, structure and optical properties of two isotypic crystals, Na3MO4Cl (M = W, Mo). J. Solid State Chem. 2016, 237, 14−18. doi: 10.1016/j.jssc.2016.01.009
Zhao, D.; Shi, J. C.; Nie, K. C.; Zhang, R. J. Crystal structure and luminescent properties of two lithium lanthanide tungstate LiLn(WO4)2 (Ln = Sm, Eu). Optik. 2017, 138, 476−486. doi: 10.1016/j.ijleo.2017.02.106
Postema, J. M.; Fu, W. T.; Ijdo, D. J. W. Crystal structure of LiLnW2O8 (Ln = lanthanides and Y): an X-ray powder diffraction study. J. Solid State Chem. 2011, 184, 2004−2008. doi: 10.1016/j.jssc.2011.05.046
Han, S.; Wang, Y.; Jing, Q.; Wu, H.; Pan, S. L.; Yang, Z. H. Effect of the cation size on the framework structures of magnesium tungstate, A4Mg(WO4)3 (A = Na, K), R2Mg2(WO)3 (R = Rb, Cs). Dalton Trans. 2015, 44, 5810−5817. doi: 10.1039/C5DT00332F
Adib, K.; Nasrabadi, M. R.; Rezvani, Z.; Pourmortazavi, S. M.; Ahmadi, F.; Naderi, H. R.; Ganjali, M. R. Facile chemical synthesis of cobalt tungstates nanoparticles as high-performance supercapacitor. J. Mater. Sci. : Mater. Electron. 2016, 27, 4541−4550. doi: 10.1007/s10854-016-4329-4
Galceran, M.; Pujol, M. C.; Aguiló, M.; Díaz, F. Sol-gel modified Pechini method for obtaining nanocrystalline KRE(WO4)2 (RE = Gd and Yb). J. Sol-Gel. Sci. Techn. 2007, 42, 79−88. doi: 10.1007/s10971-006-1517-3
Jiang, Z. H.; Cai, P. Q.; Chen, C. L.; Pu, X. P.; Kim, S.; Seo, H. J. Facile one-step hydrothermal synthesis and luminescence properties of Eu3+-doped NaGd(WO4)2 nanophosphors. Mater. Chem. Phys. 2017, 193, 227−233. doi: 10.1016/j.matchemphys.2017.02.032
Zhang, F.; Xie, J.; Li, G.; Zhang, W.; Wang, Y.; Huang, Y.; Tao, Y. Cation composition sensitive visible quantum cutting behavior of high-efficiency green phosphors Ca9Ln(PO4)7: Tb3+ (Ln = Y, La, Gd). J. Mater. Chem. C 2017, 5, 872−881. doi: 10.1039/C6TC03982K
Wen, D. W.; Feng, J. J.; Li, J. H.; Shi, J. X.; Wu, M. M.; Su, Q. K2Ln(PO4)(WO4): Tb3+, Eu3+ (Ln = Y, Gd and Lu) phosphors: highly efficient pure red and tunable emission for white light-emitting diodes. J. Mater. Chem. C 2015, 3, 2107−2114. doi: 10.1039/C4TC02406K
Si, J. Y.; Liu, N.; Song, S. Y.; Cai, G. M.; Yang, N.; Li, Z. Investigation on Eu/Tb activated photoluminescent properties of Li3Sc(BO3)2 based phosphors. J. Alloy. Compd. 2017, 719, 171−181. doi: 10.1016/j.jallcom.2017.05.161
Sharma, A.; Varshney, M.; Shin, H. J.; Chae, K. H.; Won, S. O. XANES, EXAFS and photoluminescence investigations on the amorphous Eu: HfO2 Spectrochim. Acta A 2017, 173, 549−555. doi: 10.1016/j.saa.2016.10.006
Park, K.; Kim, H.; Hakeem, D. A. Effect of host composition and Eu3+ concentration on the photoluminescence of aluminosilicate (Ca, Sr)2Al2SiO7: Eu3+ phosphors. Dyes Pigments. 2017, 136, 70−77. doi: 10.1016/j.dyepig.2016.08.022
Zhao, D.; Ma, F. X.; Wu, Z. Q.; Zhang, L.; Wei, W.; Yang, J.; Zhang, R. H.; Chen, P. F.; Wu, S. X. Synthesis, crystal structure and characterizations of a new red phosphor K3EuB6O12. Mater. Chem. Phys. 2016, 182, 231−236. doi: 10.1016/j.matchemphys.2016.07.027
Zhang, X. W.; Zhao, Z.; Zhang, X.; Marathe, A.; Cordes, D. B.; Weeksc, B.; Chaudhuri, J. Tunable photoluminescence and energy transfer of YBO3: Tb3+, Eu3+ for white light emitting diodes. J. Mater. Chem. C 2013, 1, 7202−7207. doi: 10.1039/c3tc31200c
Liu, L.; Liang, Y. M.; Li, L. L.; Zou, L. C.; Gan, S. C. White light-emitting properties of NaGdF4 nanotubes through Tb3+, Eu3+doping. Cryst. Eng. Comm. 2015, 17, 7754−7761. doi: 10.1039/C5CE01118C
Narukawa, Y.; Ichikawa, M.; Sanga, D.; Sano, M.; Mukai, T. White light emitting diodes with super-high luminous efficacy. J. Phys. D: Appl. Phys. 2010, 43, 354002−6. doi: 10.1088/0022-3727/43/35/354002
Zhang, X.; Zhang, J.; Chen, Y.; Gong, M. Energy transfer and multicolor tunable emission in single-phase Tb3+, Eu3+ co-doped Sr3La(PO4)3 phosphors. Ceram. Int. 2016, 42, 13919−13924. doi: 10.1016/j.ceramint.2016.05.202
Zhao, D.; Nie, C. K. Synthesis and multi-color luminescent properties of Tb3+/Sm3+-codoped K3Gd3B4O12 phosphor. J. Liaocheng Univ. 2019, 32, 85−89.
Qin, D.; Tang, W. J. Efficient energy transfer and tunable emission in NaLa(MoO4)(WO4): Tb3+/Eu3+ phosphors. Ceram. Int. 2016, 42, 1538−1544. doi: 10.1016/j.ceramint.2015.09.102
Zhang, X. G.; Zhou, L. Y.; Shi, J. X.; Gong, M. L. Luminescence and energy transfer of a color tunable phosphor Tb3+, Eu3+ co-doped KCaY(PO4)2. Mater. Lett. 2014, 137, 32−35. doi: 10.1016/j.matlet.2014.08.112
Liao, J. S.; Wang, Q.; Wen, H. R.; Yuan, H. L.; Liu, S. J.; Fu, J. X.; Qiu, B. First observation of mutual energy transfer of Mn4+-Er3+ via different excitation in Gd2ZnTiO6: Mn4+/Er3+ phosphors. J. Mater. Chem. C 2017, 5, 9098−9105. doi: 10.1039/C7TC03045B
Liao, J. S.; Kong, L. Y.; Wang, Q.; Li, J. Q.; Peng, G. H.; Sun, Y. J.; Wen, H. R. Sol-gel preparation and near-infrared emission properties of Yb3+ sensitized by Mn4+ in double-perovskite La2ZnTiO6. Opt. Mater. 2018, 84, 82−88. doi: 10.1016/j.optmat.2018.06.055
Xu, D.; Zhou, W.; Zhang, Z.; Ma, X.; Xia, Z. Luminescence property and energy transfer behavior of apatite-type Ca4La6(SiO4)4(PO4)2O2: Tb3+, Eu3+ phosphor. Mater. Res. Bull. 2018, 108, 101−105. doi: 10.1016/j.materresbull.2018.08.040

Figure 1 XRD patterns of solid solution LiTb1-xEux(WO4)2 (x = 0, 0.004, 0.008, 0.01, 0.02, 0.05, 0.08, 0.1) and simulated patterns of LiTb(WO4)2

Figure 2 View of the crystal structure of LiTb(WO4)2 composed of [WO4] tetrahedra and (Li/Tb)2+ ions

Figure 4 Excitation and emission spectra of LiTb(WO4)2 (a) and LiTb0.99Eu0.01(WO4)2 (b) phosphors

Figure 5 Emission spectra of representative LiTb1-xEux(WO4)2 (x = 0~0.1) phosphors excited by 379 nm (7F6 →5D3 of Tb3+) as a function of Eu3+ doping content x. Inset is the variatation of 547 nm (5D4→7F5 of Tb3+) and 616 nm (7F0→5D2 of Eu3+) emission intensity

Figure 6 Fluorescence decay profile for LiTb1-xEux(WO4)2 under the excitation of 379 nm

Figure 8 CIE chromaticity diagram for the emission spectra of LiTb1-xEux(WO4)2 samples excited by 379 nm and inset digital photograph of the emission from samples
Table 1. Selected Bond Lengths (Å) and Bond Angles (°)
| Bond | Dist. | Bond | Dist. | Bond | Dist. | ||
| W(1)–O(1) | 1.784(5) | Tb(1)–O(1)iv | 2.405(5) | Tb(1)–O(1) | 2.416(5) | ||
| W(1)–O(1)i | 1.784(5) | Tb(1)–O(1)v | 2.405(5) | Tb(1)–O(1)vi | 2.405(5) | ||
| W(1)–O(1)ii | 1.784(5) | Tb(1)–O(1)ix | 2.416(5) | Tb(1)–O(1)vii | 2.405(5) | ||
| W(1)–O(1)iii | 1.784(5) | Tb(1)–O(1)x | 2.416(5) | Tb(1)–O(1)viii | 2.416(5) | ||
| Angle | (°) | Angle | (°) | Angle | (°) | ||
| O(1)–W(1)–O(1)i | 107.03(16) | O(1)i–W(1)–O(1)ii | 114.5(3) | O(1)i–W(1)–O(1)iii | 107.03(16) | ||
| O(1)–W(1)–O(1)ii | 107.04(16) | O(1)–W(1)–O(1)iii | 114.5(3) | O(1)ii–W(1)–O(1)iii | 107.03(16) | ||
| Symmetry codes: (i) –y+1/4, x+1/4, –z+1/4; (ii) y–1/4, –x+1/4, –z+1/4; (iii) –x, –y+1/2, z; (iv) –x–1/2, –y+3/2, –z+1/2; (v) y–5/4, –x+3/4, z–1/4; (vi) –y+1/4, x+3/4, z–1/4; (vii) x–1/2, y, –z+1/2; (viii) y–5/4, –x+1/4, –z+1/4; (ix) –y+1/4, x+5/4, –z+1/4; (x) –x–1, –y+3/2, z | |||||||
 下载: 导出CSV
Table 2. Excitation Peaks of LiTb1-xEux(WO4)2 Phosphors
| No. | Wavelength (nm) | Activation ion | Excitation transition |
| 1 | 319 | Tb3+ | 7F6→5D0 |
| 2 | 341 | Tb3+ | 7F6→5G2 |
| 3 | 354 | Tb3+ | 7F6 →5D2 |
| 4 | 360 | Tb3+ | 7F6 →5G5 |
| 5 | 370 | Tb3+ | 7F6 →5G6 |
| 6 | 379 | Tb3+ | 7F6 →5D3 |
| 7 | 395 | Eu3+ | 7F0 →5L6 |
| 8 | 417 | Eu3+ | 7F0 →5D3 |
| 9 | 465 | Eu3+ | 7F0 →5D2 |
| 10 | 487 | Tb3+ | 7F0 →5D4 |
下载: 导出CSV
Table 3. CIE Chromaticity Coordinates of LiTb1-xEux(WO4)2
| LiTb1-xEux(WO4)2 | λex (nm) | λem (nm) | CIE | |
| 1 | x = 0 | 379 | Embase = 450~750 | (0.3099, 0.612) |
| 2 | x = 0.004 | 379 | Embase = 450~750 | (0.4459, 0.5062) |
| 3 | x = 0.008 | 379 | Embase = 450~750 | (0.4795, 0.4801) |
| 4 | x = 0.01 | 379 | Embase = 450~750 | (0.5131, 0.4525) |
| 5 | x = 0.02 | 379 | Embase = 450~~750 | (0.5538, 0.4194) |
| 6 | x = 0.05 | 379 | Embase = 450~750 | (0.596, 0.3851) |
| 7 | x = 0.08 | 379 | Embase = 450~750 | (0.6223, 0.3614) |
| 8 | x = 0.1 | 379 | Embase = 450~750 | (0.6287, 0.3566) |
下载: 导出CSV

 扫一扫看文章


扫一扫关注我们

