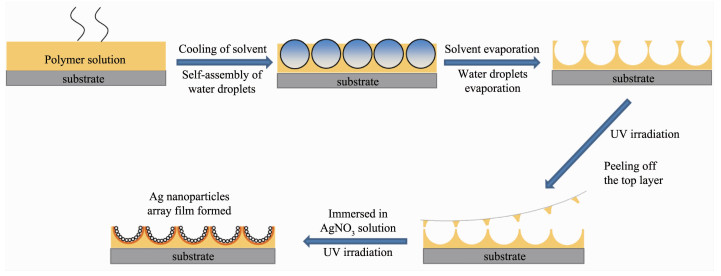
Figure 1.
Schematic illustration for the preparation of Ag nanoparticles array

Fabrication of Honeycomb-like Ag Nanoparticles Film Used as Surface Enhanced Raman Scattering Substrate
Yuan-Jun LIU , Fen YE , Wei WANG , Jun-Hao ZHANG , Chao YAN , Ai-Hua YUAN


Surface enhanced Raman scattering (SERS) technique has been extensively applied to various fields in the past few decades including environment, health care and biology due to the ultrasensitivity, excellent selectivity, rapid detection capability as well as nondestructive testing[1-2]. The enhancement of Raman signature strongly depends on the active substrate, most of which are composed by noble metal units, including Ag or Au with various micro-/nanostructures[3-5]. The reported enhancement factor (EF) of these SERS substrates can reach up to 106~1014. However, high SERS enhancement is often accompanied by low uniformity and reproducibility.
Suitable SERS substrates should possess not only a large surface area to adsorb amounts of analyte molecules but also abundant and uniform "hot spots". It was confirmed that substrates with periodic ordered microstructures exhibit superior SERS performance over disordered ones. Periodic nanoparticle arrays possess uniform and high density of hot spots and so good reproducibility[6-8]. Up to date, several strategies have been employed to prepare ordered SERS substrates including electron beam lithography techniques, nanosphere lithography, and so on[7, 9-11]. Although these strategies are quite effective for the fabrication of ordered SERS substrates, the involved complicated and expensive devices highly limit their wide application. Thus, it is highly expected to fabricate ordered patterns with noble metal nanoparticles by a more easy operation way for highly sensitive SERS substrates[12-13].
Recently, breath figure method was known as a simple and efficient technique for the fabrication of honeycomb patterned polymer films[14-15]. In this work, the amphiphilic diblock copolymer, polystyrene-block-poly (4-vinylpyridine) (PS-b-P4VP), was adopted to induce a patterned film with honeycomb structure by a static breath figure method. After UV-light treatment, the top PS layer of the as-prepared PS-b-P4VP pattern film can be easily peeled off with an adhesive tape, fully exposing the P4VP domain in the film. On this treated honeycomb polymer pattern, silver ions can be adsorbed on and were in situ reduced by UV-assisted reduction method, forming Ag nanoparticles array film. R6G was then used as the probe molecular to investi-gate the SERS performance of this silver particle array substrate. The results indicate that the Ag nanoparticles array on honeycomb-patterned film shows an enhance-ment factor as high as 1.31×10⁹, limit of detection (LOD) low to 10-10 mol·L-1. The collected SERS signals on 120 positions show small relative standard deviation (only ~12%), suggesting the favorable reliability and good reproducibility of the prepared Ag nanoparticles array film SERS active substrate.
Amphiphilic diblock copolymer polystyrene-b-poly(4-vinylpyridine) (PS-b-P4VP, Mn=122 000 kg·mol-1 for PS and 22 000 kg·mol-1 for P4VP) was purchased from Polymer Source. Trichloromethane (CHCl3) and AgNO3 were purchased from Sinopharm Chemical Reagent Co., Ltd. R6G was purchased from J & K Scientific, Ltd. ITO glasses were provided by Huanan Scientific and Technical Corporation. All of the glasses were cut into 1 cm×1 cm square shape. Water used in all experiments was deionized and ultrafiltrated with a Lab Water system.
All the experiments were carried out at room temperature. ITO glasses (1 cm×1 cm) were firstly immersed in an acidic mixture of 98% H2SO4 and 30% H2O2 (7:3; V/V) with ultrasonic cleaning for 30 min and were then strongly rinsed by deionized water for several times. The cleaned wafers were then dried under nitrogen flow.
Typically, a saturated relative humidity environ-ment was firstly made by adding 5 mL of distilled water in 30 mL of glass bottle, which was sealed by plastic wrap for 2 h. A piece of ITO glass was placed on the top of a glass upholder in the glass bottle to make the ITO glass 5 mm higher than the water level. Then, the micro-patterned film was prepared by dropping a 50 μL of 30 mg·mL-1 of PS-b-P4VP trichloromethane solution onto the surface of ITO glass. After 30 min, the thus prepared pattern film was put under the irradiation of UV-light that was generated by a commercial 5 W of Hg lamp. The Hg lamp provides light irradiation with a wavelength range of 200~320 nm (the strongest line is 254 nm). The distance between the pattern film and the Hg lamp is fixed to be 20 cm. After UV-light irradiation of 2 h, the top PS layer of the honeycomb-patterned film was then peeled off with a commercially available adhesive tape, leaving the P4VP layer.
0.05 mol·L-1 AgNO3 solution was prepared by dissolving AgNO3 in a mixture solution of deionized water and ethanol (1:1, V/V). The processed honeycomb-patterned film was put into a petri dish. Then 3 mL of the AgNO3 solution was dropped into the petri dish to immerse the film. Finally, to expose the petri dish under UV light irradiation for 3~5 h induces the formation of Ag nanoparticles onto the honeycomb-patterned film. For comparison, Ag nanoparticles array films were also obtained with 0.02 mol·L-1 or 0.08 mol·L-1 AgNO3 and UV light irradiation of 3 h. In addition, Ag nanoparticles loaded on pristine ITO glass were also prepared with 3 mL 0.05 mol·L-1 AgNO3 and UV light irradiation of 3 h.
The obtained Ag nanoparticles array on honeycomb-patterned film was used as SERS substrate. The substrates were soaked into 2 mL of R6G~aqueous solution and allowed to be adsorbed for 8 h, and then took out and dried under ambient condition before measurements. Raman spectra were measured by a laser confocal Raman microspectros-cope with an accumulation time of 2 s. A 532 nm laser with power of 50 mW was used as the excitation source. The light spot of the laser on the substrate has a diameter of about 2 μm.
The surface morphology of the samples was detected by using a field emission scanning electron microscope (FE-SEM, 3 kV, S-4800, Hitachi). Silver composition was analyzed by X-ray photoelectron spectrometer (XPS) (ESCALAB 250Xi, Thermo Fisher Scientific Inc.). Surface-enhanced Raman scattering analysis was measured with a Raman spectrometer (Renishaw in Via, England).
Ag nanoparticle array film was prepared with the assistance of PS-b-P4VP honeycomb-patterned film, which was prepared by static breath figure method (Fig. 1). With the evaporation of CHCl3, the temperature of the solution quickly decreases. Water droplets are then condensed and self-assembled onto the surface. After the complete evaporation of the solvent and water droplets, honeycomb-patterned film is formed on ITO glass[16]. The honeycomb-patterned film was treated under UV-irradiation for 2 h to peel off the top layer, fully exposing the bottom P4VP domain.
The processed honeycomb-patterned film was then immersed into AgNO3 solution. During the immersing process, P4VP region will adsorb Ag+ due to its electron-rich pyridine ring. When exposed to UV light, the pyridine ring will be excited and electron-hole pairs will be formed. The photo-generated electrons have strong reducing ability and can reduce Ag+, causing the in situ generation of Ag nanoparticles on the surface of the honeycomb-patterned porous films[17-19]. Compared with other methods such as chemical reducing agent route and electrochemical deposition method[20-22], this irradiation assisted reduc-tion strategy is simple and green.
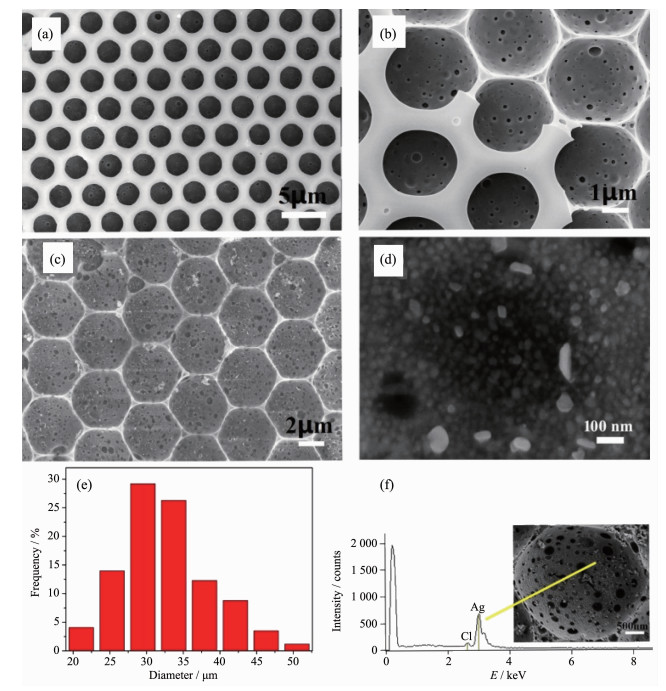
As shown in Fig. 2a, the obtained PS-b-P4VP polymer film shows porous feature with regular arrangement, demonstrating the formation of honeycomb-like structure. The prepared porous film shows homogeneous pore size. 75.6% of the pores have sizes in the range of 2.8~3.0 μm. After peeling off the top layer of the honeycomb-like PS-b-P4VP film by an adhesive tape, the "dark domain" (corresponding to P4VP part) (Fig. 2b) becomes easily accessible[14]. Fig. 2c and d show SEM images of the formed Ag nanoparticles array film. The corresponding particle size distribution in Fig. 2e indicates that the Ag nanoparticle size is in the range of 20~50 nm. The presence of silver on the film is further confirmed by energy dispersive spectrum (EDS, Fig. 2f). It should be noted that if the top layer was not peeled off, no Ag nanoparticles can be formed on the film by this method.
X-ray photoelectron spectrum (XPS) illustrates elements of Ag, C, N, and O (Fig. 3a). The elements of C and N come from the PS-b-P4VP film, while O would come from the adsorbed H2O. The high-resolution XPS spectrum of Ag region contains two bands with binding energies of 368.4 eV and 374.4 eV, exactly corresponding to Ag03d5/2 and Ag03d3/2, respectively (Fig. 3b)[23-24]. This indicates that metallic Ag nanoparticles rather than other silver compounds exist on the honeycomb-patterned film.
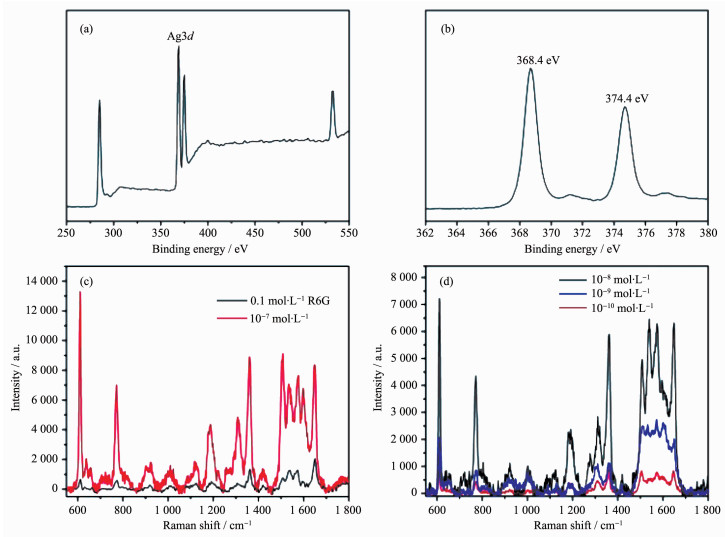
It was proposed that most SERS-active system must possess metal particles with size in the range of 20~70 nm[17]. This value is well consistent with that of our prepared Ag nanoparticle array film (20~50 nm), which was then investigated as SERS substrate. R6G was employed as a probe compound to test the SERS performance. Fig. 3c shows the obtained Raman spectra of R6G solution (10-7 mol·L-1) with our prepared Ag nanoparticle array substrates. The spectrum is well consistent with previously reported data[16]. All these peak intensities are much higher than those obtained with bare ITO substrate and even a much higher concentration of 0.1 mol·L-1.
In order to quantitatively demonstrate the SERS performance, the EF was calculated according to the following formula[25].
|
$ {\rm{EF}} = \frac{{{I_{{\rm{SERS}}}}{N_0}}}{{{I_0}{N_{{\rm{SERS}}}}}} = \frac{{{I_{{\rm{SERS}}}}{n_0}{N_{\rm{A}}}}}{{{I_0}{n_{{\rm{SERS}}}}{N_{\rm{A}}}}} = \frac{{{I_{{\rm{SERS}}}}{C_0}{V_0}}}{{{I_0}{C_{{\rm{SERS}}}}{V_{{\rm{SERS}}}}}} = \frac{{{I_{{\rm{SERS}}}}{C_0}}}{{{I_0}{C_{{\rm{SERS}}}}}} $ |
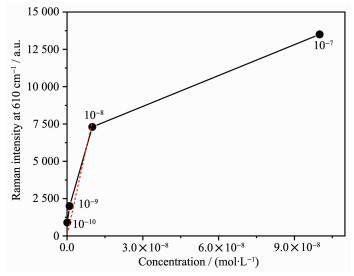
Where N0 and I0 are the number of molecules and intensity of regular Raman measurement with 0.1 mol·L-1 R6G aqueous solution, NSERS and ISERS are those with our prepared SERS substrate measurement under the same solution[25]. From this formula, EF value of 2.18×10⁷ is calculated based on the peak at 610 cm-1. In addition, the practical limit of detection, as shown in Fig. 3d, can reach to 10-10 mol·L-1. The corresponding EF values for 10-8, 10-9, and 10-10 mol·L-1 of R6G aqueous solution are 1.26×10⁸, 3.67×10⁸, and 1.31×10⁹, respectively. These results indicate that the as-prepared Ag nanoparticle array substrates would be used as active SERS substrate. Fig. 4 shows the approximate linear range of 10-10~10-8 mol·L-1 for the detection of R6G based on the peak intensity at 610 cm-1.
For comparison, the SERS performance of contrast substrates prepared with 0.02 mol·L-1 or 0.08 mol·L-1 AgNO3 by keeping the UV irradiation reduction time of 3 h was also investigated, which provide relatively lower EF values of 6.97×10⁶ and 3.15×10⁶ toward 10-7 mol·L-1 of R6G, respectively. This indicates that there is an optimal density or size of Ag nanoparticles on the polymer film for SERS performance since the concentration of AgNO3 solution would influence Ag nanoparticles density or size on the film. It was also found that the Ag nanoparticles array film prepared with longer UV light irradiation time of 5 h also show relatively lower EF of 6.85×10⁵. Additionally, Ag nanoparticles loaded on pristine ITO glass were also prepared at the same reaction condition for comparison. The SERS measurement on this contrast flat SERS substrate shows EF value of about 4.19×10⁶. This value is much smaller than that of our prepared honeycomb SERS substrate (2.18×10⁷), suggesting the honeycomb microstructure on the SERS substrate is highly favorable for the SERS performance.
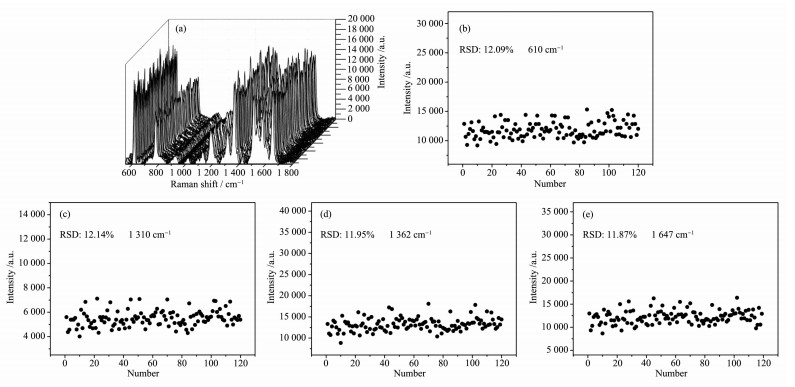
To detect the uniformity of the prepared SERS substrates, SERS mapping-scan spectra on 120 spots were collected (Fig. 5). The Raman mapping was scanned over a 30 μm×30 μm area with a step size of 3 μm. It was demonstrated that the Raman signals obtained from the 120 spots show similar intensity. The relative standard deviation (RSD) values for the vibration at 610, 1 310, 1 362 and 1 647 cm-1 are 12.1%, 12.1%, 12.0%, and 11.9%, respectively, which shows that the obtained Ag nanoparticles array substrates have reasonable uniformity. The relatively lower RSD values are related to the high uniformity of the SERS pattern with microscale pattern. For SERS investigation, the usual laser spot size is about ~1 μm for 532 nm laser; at this size scale, the obtained pattern is uniform, thus showing high SERS signal uniformity with low RSD values (lower than those of Ag nanoparticles loaded on pristine ITO, 51%~75%).
It was generally accepted that SERS is predo-minantly originated from two mechanisms, electromag-netic and chemical effects. The electromagnetic enhancement is related to surface plasmon resonance occurring in the nanogaps between nanoparticles (known as "hot spots"), which induce stronger electro-magnetic field and thus stronger SERS signals. Compared with flat substrate[26], honeycomb-patterned film with larger surface area can immobilize more Ag nanoparticles and create more "hot spots", thus inducing higher enhancement. On the other side, it is also believed that chemical enhancement also provides some contribution to the SERS performance of our prepared Ag nanoparticles array on honeycomb-patterned film substrates. Usually, the peaks at 1 362 and 1 647 cm-1 due to the aromatic C-C stretching vibrations show the relatively highest intensity in Raman spectrum of R6G[27]. However, in our case, the peak at 610 cm-1 resulting from C-C-C ring in-plane bending vibration is stronger than the above two, which may be caused by the unique molecular orientation of analytes on the Ag nanoparticles array due to the weak interaction between the analyte molecular and the polymer[28]. This suggests the possible contribution of chemical enhancement to the SERS.
Compared to other SERS substrates prepared with various chemical routes, our prepared honeycomb SERS substrate has several advantages. Firstly, the preparation route is quite simple without complex instrument or surface modification. It is easily scaled up. Secondly, the honeycomb pattern with larger surface area can form amounts of "hot-spots", thus showing high EF value. Especially, the 4-vinylpyridine part in the polymer can not only adsorb more Ag+ ions on the surface but also will possibly enrich the analyte molecular, both of which are favorable of the enhanced SERS performances.
In summary, this study demonstrates the fabrication of Ag nanoparticle array SERS substrate with the assistance of PS-b-P4VP film obtained by static breath figure method. The prepared SERS substrate shows EF value as high as 1.31×10⁹ and limit of detection low to 10-10 mol·L-1 for R6G. In addition, the smaller relative standard deviation values of ~12% indicate the favorable uniformity. It is believed that the route to patterned metal film would also extend to other metal composition for various potential applications.
Gruenke N L, Cardinal M F, Mcanally M O, et al. Chem. Soc. Rev., 2016, 45:2263-2290 doi: 10.1039/C5CS00763A
Cialla D, Mrz A, Bhme R, et al. Anal. Bioanal. Chem., 2012, 403:27-54 doi: 10.1007/s00216-011-5631-x
Zijlstra P, Paulo P M, Orrit M, et al. Nature Nanotechn., 2012, 7:379-386 doi: 10.1038/nnano.2012.51
Talley C E, Jackson J B, Chris O, et al. Nano Lett., 2005, 5:1569-1574 doi: 10.1021/nl050928v
Mei H, Bai H, Bai S, et al. Mater. Lett., 2018, 230:24-27 doi: 10.1016/j.matlet.2018.07.069
Zhang X, Salcedo W J, Rahman M M, et al. Surf. Sci., 2018, 676:39-45 doi: 10.1016/j.susc.2018.02.003
Kim N H, Kim S, Choi M, et al. Sens. Actuators B, 2018, 258:18-24 doi: 10.1016/j.snb.2017.11.065
Sooraj K P, Ranjan M, Rao R, et al. Appl. Surf. Sci., 2018, 447:576-581 doi: 10.1016/j.apsusc.2018.04.020
Yin X, Dong H, Wang S, et al. Chin. Chem. Lett., 2019, 30:179-182 doi: 10.1016/j.cclet.2018.06.013
Brown R J, Milton M J. J. Raman Spectro., 2010, 39:1313-1326
Long N V. Appl. Spectro. Rev., 2015, 50:499-525 doi: 10.1080/05704928.2014.923901
Nistico R, Novara C, Chiado A, et al. Mater. Lett., 2019, 247:208-210 doi: 10.1016/j.matlet.2019.03.121
Fu Q, Zhan Z, Dou J, et al. ACS Appl. Mater. Interf., 2015, 7:13322-13330 doi: 10.1021/acsami.5b01524
Escalé P, Rubatat L, Billon L. Eur. Polym. J., 2012, 48:1001-1025 doi: 10.1016/j.eurpolymj.2012.03.001
Liang Z, Li X. Mater. Lett., 2018, 227:74-77 doi: 10.1016/j.matlet.2018.05.041
Lin Y W, Tang C. J. Phys. Chem. C, 2015, 119:24865-24874 doi: 10.1021/acs.jpcc.5b08375
Xie W, Qiu P, Mao C. J. Mater. Chem., 2011, 21:5190-5202 doi: 10.1039/c0jm03301d
Liu Y, He L, Xu C, et al. Chem. Commun., 2009, 43:6566-6568 https://www.ncbi.nlm.nih.gov/pubmed/19865651
Lu L Q, Zheng Y, Qu W G, et al. J. Mater. Chem., 2012, 22:20986-20995 doi: 10.1039/c2jm33955b
饶艳英, 李章良, 黄建辉, 等.无机化学学报, 2018, 34:1231-1239 doi: 10.11862/CJIC.2018.165RAO Yan-Ying, LI Zhang-Liang, HUANG Jian-Hui, et al. Chinese J. Inorg. Chem., 2018, 34:1231-1239 doi: 10.11862/CJIC.2018.165
沈茂, 梁华定, 金燕仙, 等.无机化学学报, 2018, 34:92-98 doi: 10.11862/CJIC.2018.014SHEN Mao, LIANG Hua-Ding, JIN Yan-Xian, et al. Chinese J. Inorg. Chem., 2018, 34:92-98 doi: 10.11862/CJIC.2018.014
Alyami A, Quinn A J, Iacopino D. Talanta, 2019, 201:58-64 doi: 10.1016/j.talanta.2019.03.115
Li X, Zhu G, Xiao L, et al. J. Alloys Compd., 2019, 773:40-49 doi: 10.1016/j.jallcom.2018.09.269
Ou Y, Wang L Y, Zhu L W, et al. J. Phys. Chem. C, 2014, 118:11478-11484 doi: 10.1021/jp503166g
Yuan Y, Panwar N, Yap S H, et al. Coord. Chem. Rev., 2017, 337:1-33 doi: 10.1016/j.ccr.2017.02.006
Shen Y, Liu Y, Wang W, et al. RSC Adv., 2016, 6:38716-38723 doi: 10.1039/C6RA05225H
Lu Y, Liu G L, Lee L P. Nano Lett., 2005, 5:5-9 doi: 10.1021/nl048965u
Li H, Li H, Wu S, et al. J. Alloys Comp., 2016, 674:56-62 doi: 10.1016/j.jallcom.2016.03.010

Figure 2 SEM images of (a) the formed PS-b-P4VP film; (b) the film after being peeled off the top layer; (c) the film loaded with Ag nanoparticles and (d) Ag nanoparticles in one pore; (e) size distribution of Ag nanoparticles; (f) EDS spectrum

Figure 3 (a) XPS spectrum of Ag nanoparticles array; (b) High resolution XPS spectrum for Ag3d; Raman scattering spectra of (c) 0.1 mol·L-1 R6G measured on bare ITO substrate and 10-7 mol·L-1 R6G measured on Ag nanoparticles array film and (d) 10-8~10-10 mol·L-1 of R6G solution on Ag nanoparticle array film

Figure 4 Linear range for the detection of R6G based on the Raman peak intensity at 610 cm-1

 扫一扫看文章


扫一扫关注我们
 下载:
下载:

 下载:
下载:
