Figure 1.
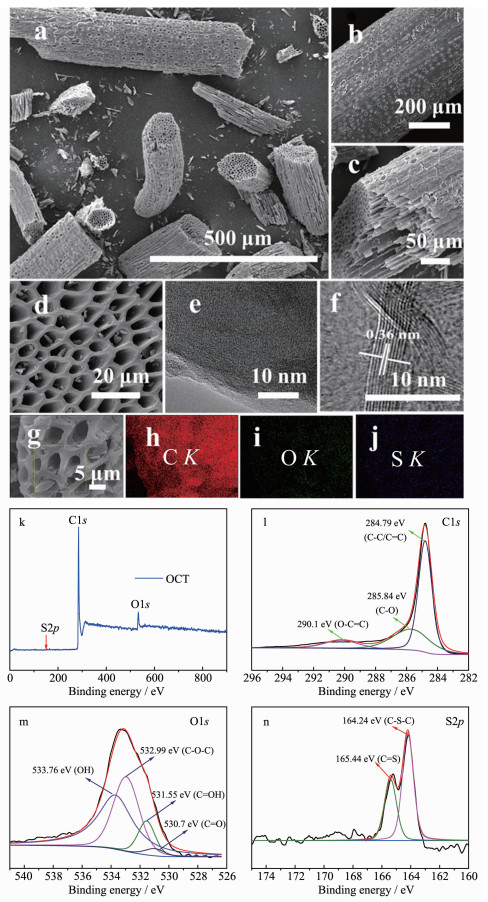
SEM images (a~d), TEM image (e), HRTEM image (f), EDS (g~j), XPS survey spectrum (k) and high-resolution spectra of (l) C1s, (m) O1s and (n) S2p of OCT
Biomass Derived Highly-Ordered Carbon Tube as Cathode Material for High Performance Lithium-Sulfur Batteries
Meng-Yuan ZHANG , Xiao-Long YOU , Li-Jun LIU , Dessie Walle Maru , Ya-Juan LI , You-Nian LIU

Lithium-sulfur (Li-S) batteries are among the most promising electrochemical energy storage devices for the near future generations. Researchers never tired of emphasizing to sulfur because of its high energy density, natural abundance, low cost and environmental friendliness[1-2]. Despite its considerable advantages, the Li-S cell is plagued with several challenges and hindered its widely practical realization[3-5]: (1) Poor electrode recharge ability and limited rate capability owing to the insulating nature of sulfur and solid reduction products (Li2S and Li2S2); (2) Fast capacity decay resulted from the generation of various soluble polysulfide Li2Sn (3≤n≤6) intermediates[6-7]. To over-come these problems and improve the battery perfor-mance, considerable investigations have been made to optimize cathodes[8-9], electrolytes[10-11], separators[12-13], and lithium anode[14-15]. Tremendous studies have been focused on synthesizing sulfur/carbon (C/S) composites. The carbon material with special structures can not only improve the conductivity of sulfur but also physically confine the outward diffusion of polysulfide[16]. Among these, graphene[17], carbon nanotube[18], hollow carbon sphere[19] and mesoporous carbon[5] were adopted to prepare C/S composite. However, in order to gain carbon materials with specific structure, precise control is needed. Usually, expensive or poisonous agents are used in preparation processes, which highly cause environment pollution. Thus, preparing carbon material with specific structure in a clean, cheap and easy way is imperative[2, 20].
Biomass derived carbon from natural product was widely applied in absorption[21], catalysis[22] and energy field[23], which shows great potential to commercialize for its tunable porous structures and surface properties. Compared to the conventional synthesis methods of carbon, there are three prominent advantages of biomass-derived carbon material[24-26]. Firstly, the carbon source is easily available and cheap. Many natural materials including natural plants and some animal tissues can be used to gain the desired product, which usually are thought useless and disposed roughly lead to environmental pollution. Secondly, kinds of texture with special morphology can be obtained easily without precise control. Because the natural products usually have specific inherent textures resulted from their biological self-evolution. Some natural plants evolve an amazing and sophisticated highly-ordered tube architecture to deliver water and nutrition, after carbonization, the sophisticate can be preserved effectively. Thirdly, the synthesis method is facile which is very important for commercialization. Triggered by these advantages, numerous of studies were reported to prepare biomass-derived carbon for Li-S batteries[26-28].
Herein, palm tree fiber was adopted as carbon source to obtain highly ordered carbon tube (OCT) for Li-S battery. The inner diameter of tube in OCT was about 5 μm. The obtained OCT possesses very high specific surface area (2 707 cm2·g-1) and pore volume (1.74 cm3·g-1). The sulfur and OCT composite (S@OCT) cathode exhibited an excellent electrochemical performance.
The palm tree (Trachycarpus sortunei Wendl, collected from Yuelu Mountain, Changsha, Hunan) fiber was washed with distilled water and dried at 120 ℃ for 24 h in an oven, then cut into 2~3 mm. The synthesis processes were involved carbonization and activation steps. Firstly, 3 g palm tree fiber was put into a graphite cuvette and heated at 500 ℃ for 2 h in N2 atmosphere with temperature ramp 10 ℃·min-1. After cooling down to room temperature, the resultant product was ground into powder in mortar. Then 0.7 g powder was mixed with 2.8 g KOH in 20 mL deionized water and was stirred for 12 h. Then, it was dried at 110 ℃ for 12 h. The dried mixture was transferred into graphite cuvette and activated at 900 ℃ for 1 h in N2 atmosphere with temperature ramp 10 ℃·min-1, washed three times with 1 mol·L-1 HCl to remove the species that containing KOH, K and K2CO3, and then rinsed with deionized water until the filtrate was nearly neutral. Finally, the prepared OCT was dried at 110 ℃ for 12 h.
The sulfur and ordered carbon tube (S@OCT) composite was synthesized with hydrothermal method. Typically, the 60 mg OCT was dispersed in 60 mL deionized water followed with sonication and stirring, then 3.7 mmol Na2S2O3 was added. Finally, 10 mL 1 mol·L-1 HCl was added into the mixture drop wise with vigorous stirring. The uniform solution was kept under stirring for 2 h and transferred into 100 mL autoclave, sealed tightly and put into an oven to conduct the hydrothermal reaction at 180 ℃ for 12 h. The autoclave was cooled down to room temperature and the product was rinsed with deionized water. The obtained S-3@OCT was dried under vacuum at 60 ℃ for 12 h. The S@OCT composite was also prepared with different contents of sulfur by changing the mass of OCT (120, 80 mg) and denoted as S-1@OCT, S-2@ OCT, respectively.
The morphologies and structures of the obtained samples were characterized through field emission scanning electron microscopy (FE-SEM, FEI Nova Nano-230, 20 kV) equipped with an X-ray energy dispersive spectrometer (EDS). Transmission electron microscppy (TEM) images were obtained from TEM/STEM (FEI Titan G2 60-300, USA, 200 kV), which included corrector technologies enabling resolution of 80 pm. The sulfur content in the S@OCT composite was determined by thermogravimetric analyzer (TGA, SDT600), where the temperature was increased from room temperature to 800 ℃ at a heating rate of 10 ℃·min-1 under N2 atmosphere. The specific surface area, the pore structure parameters of OCT were determined by N2 adsorption isotherms at 77 K using a Micromeritics Tristar 3000 surface area and porosity analyzer. The crystalline phases were performed with XRD (Dmax/2550VB, Rigaku, Japan) in the 2θ range of 5°~80° with Cu Kα radiation (λ=0.154 06 nm). The chemical interactions of the components were investigated with ESCALAB 250XI X-ray photoelectron spectroscopy (Thermo Fisher Scientific, USA).
The sulfur cathode membrane was fabricated by mixing the active material S@OCT composite (70%(w/w)), acetylene black (20%(w/w)) and polyvinylidene fluoride (10%(w/w)) binder with N-methyl-2-pyrro-lidone (NMP). Then the following solution was stirred for about 5 h to form a uniform slurry. The slurry was pasted onto Al foil. After dried under vacuum at 50 ℃ for 12 h, it was cut into circular disk with 1.0 cm diameter. The sulfur loading of the electrode with S-3@OCT was about 1.44 mg·cm-2. CR2025-type coin cells were assembled in an argon-filled glove box (MBRAUN, Germany). The lithium foil was used as the anode. The separator was Celgard 2500 membrane. The electrolyte was 1 mol·L-1 LiN(CF3SO2)2 (LiTFSI, Novolyte Technologies, Inc.) in a mixed solvent of 1, 3-dioxolane (DOL) and 1, 2-dimethoxyethane (DME) (2:1 by weight) with 1%(w/w) LiNO3 additive. Galvanostatic charge and discharge measurements were conducted using a LAND CT2001A Battery Test System (Jinnuo Electronic Co., Wuhan, China) between 1.5 and 2.8 V (vs Li/Li+). The specific capacities were calculated based on the mass of sulfur. The cyclic voltammetry (CV) were performed on CHI660E (Chenhua Co., Shanghai, China) electrochemical workstation at room temperature with the scan rate of 0.1 mV·s-1. Meanwhile, the electrochemical impedance (EIS) measurement was carried out at open circuit voltage over the frequency range from 1×10⁻² to 1×10⁵ Hz with the voltage amplitude of 5 mV.
The preparation processes of OCT was facile, green and the involved agents could be widely used in industrial production. The morphology of the OCT was revealed by SEM and TEM presented in Fig. 1(a~j). The entire, side and sectional view of the carbonized fiber were shown in Fig. 1(a~d). The carbonized fiber presented highly ordered carbon tube architecture. The inner diameter of the tube was about 5 μm. One carbonized fiber was consisted of about 500 tubes. On the surface of the carbonized fiber, there were many ordered macro-porous (about 9 μm). The special architecture of OCT could effectively accommodate sulfur and be benefit to the transport of electrolyte. Whats more, as shown in Fig. 1e, we could see an abundant microporous (< 1 nm) on the carbon frame-work of OCT. Fig. 1f was the HRTEM image of OCT, the clear lattice fringes with the an-interplanar spacing of 0.36 nm were corresponding to the graphitic carbon characteristic, which could confirmed the OCT was highly graphitic. Fig. 1(h~k) display the element mapping of C, O and S in the OCT. Besides carbon, there were O and S elements uniformly distributed in the carbon framework of the OCT.
To further prove the oxidation state of elements in OCT, XPS investigation was carried out. The XPS survey spectra of OCT was shown in Fig. 1k, which indicated that the content of C, O and S element was 94.24%, 5.21% and 0.55%(n/n), respectively. Fig. 1(l~n) show the high-resolution spectrum of C1s, O1s and S2p. The three peaks in Fig. 1l located at 290.1, 285.84 and 284.79 eV were corresponding to O-C=C, C-O and C-C/C=C species[29-30]. In Fig. 1m, we could observed four peaks at 533.76, 532.99, 531.55 and 530.7 eV respectively, which attributed to OH, C-O-C, C=OH and C=O bonds. The peaks in Fig. 1n at 165.44 and 164.24 eV were identified of C=S and C-S-C bonds[31]. The XPS results suggested that there were lots of oxygen-containing functional groups on the surface of OCT, and the carbon framework of OCT was sulfur doped.
To quantify the specific surface area and pore volume, N2 adsorption-desorption test was conducted and the result is displayed in Fig. 2(a, b). The result revealed that the specific surface area was 2 707 m2·g-1 and the total pore volume was 1.74 cm3·g-1. The pore size located between 0.4 and 6 nm. It was worthy to note that the micro-pore volume was up to 0.76 cm3·g-1. Thus, the obtained OCT with high specific area and pore volume was a promising matrix to store sulfur.
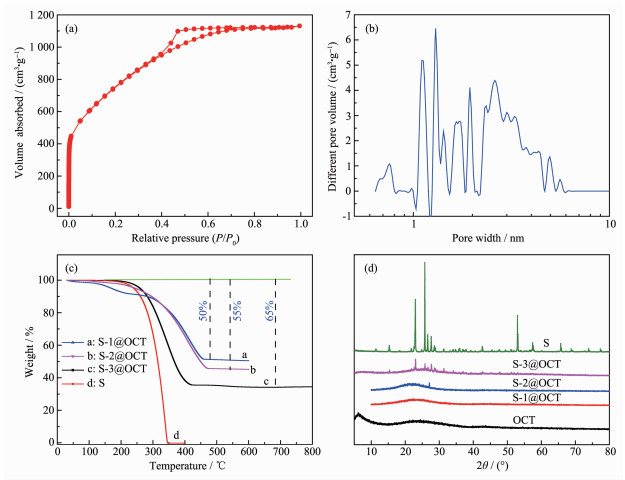
The sulfur content of S@OCT was determined by TGA. As shown in Fig. 2c, the determined contents of sulfur were 50%, 55% and 65%(w/w) for S-1@OCT, S-2@OCT and S-3@OCT, respectively. The main weight loss temperature of sulfur in S-1@OCT, S-2@OCT and S-3@OCT was about 200 ℃. The weight loss of S-1@OCT between 100 and 150 ℃ was related to the absorption water.
Fig. 2d showed the XRD patterns of OCT, S, S-1@OCT, S-2@OCT and S-3@OCT. Almost no sulfur peaks could be observed in the S-1@OCT and S-2@OCT, while sharp sulfur peaks could be detected in S-3@OCT. Meanwhile, it was obvious that the peak intensity of S-3@OCT became weaker than sulfur. The results suggested that when the content of sulfur above 55%, part of sulfur could not enter into the pores of OCT.
The electrochemical performance of S@OCT was tested at different current rates (Fig. 3a). The S-3@OCT cathode with 65% sulfur showed the initial discharge capacity of 1 255.2 mAh·g-1 and retained a capacity of 756.9 mAh·g-1 after 100 cycles at the current rate of 0.2C. When tested at 1C, the initial discharge capacity was 1 079.7 mAh·g-1 and maintained a capacity of 610 mAh·g-1 after 100 cycles. what′s more, this material also exhibited excellent cycling performance when tested at 5C with a very high coulomb efficiency, almost 100%(Fig. 3a).
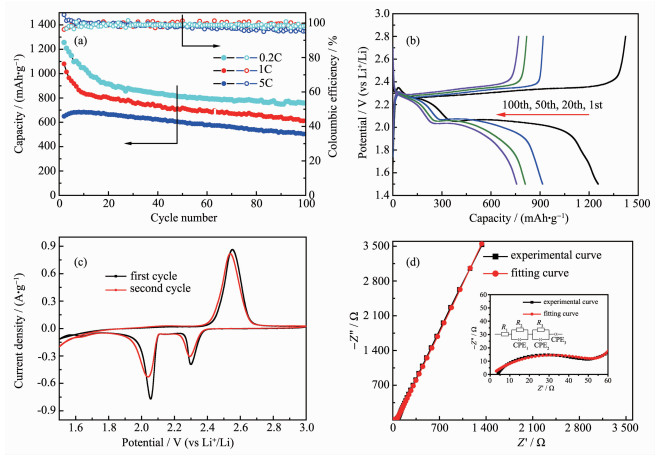
The discharge-charge voltage profiles of S-3@OCT electrode at 0.2C is shown in Fig. 3b. The electrode clearly showed two-step discharge plateaus, which confirmed the two-step reactions of sulfur with lithium anode, and it could be proved by the cyclic voltammetry curves at Fig. 3c.
EIS test is presented in Fig. 3d. The equivalent circuit was inserted to Fig. 3d. The impedance spectrum showed a depressed semicircle in the high frequency and a sloping straight line in the low frequency[32-33]. And the fitting dates were shown in Table 1. R1 (0.91 Ω) was the resistance of the electrolyte between the electrodes. R2 (100 Ω) presented the charge-transfer resistance generated at the cathode/electrolyte interface. Meanwhile, the constant phase element (CPE1) was used to replace the double-layer capacitance. R3 (0.55 Ω) represented the charge-transfer resistance of solid electrolyte interface (SEI). And the CPE2 contributed to the double-layer capacitance on SEI. The CPE3 was Warburg impedance. CPE was dened by the impedance relationship Z=1/Yo(iω)n (Z represents the constant phase angular impedance; ω is angular frequency; i is imaginary part of the impedance; Yo is the parameter including diffusion coefficient; n is a constant number between 0~1 (if n is 0.5, the formula is Warburg impedance; if n is 0, the formula is resis-tance impedance; if n is 1, the formula is capacitance impedance)). It was worth to mention that the small values and stable variation of the Warburg impedance indicated the good diffusion of soluble species in the pores of the OCT[34]. Comparing with our previous work[2], the material had fast electrochemical kinetics.
 下载:
导出CSV
下载:
导出CSV
| R1/Ω | R2/Ω | CPE1 | R3/Ω | CPE2 | CPE3 | ||||
| Yo/Ω | n | Yo/Ω | n | Yo/Ω | n | ||||
| 0.91 | 100 | 4.13×l0-2 | 0.74 | 0.55 | 1.42×10⁻⁴ | 0.57 | 2.39×l0-3 | 0.79 | |
We obtained the carbon material with highly ordered carbon tubes, which mainly possesses the following three properties for Li-S battery. Firstly, the superior conductivity of the OCT was beneficial to improve the utilization of sulfur. Secondly, the hierarchical porous structure was helpful to confine the lithium polysulfides. Specifically, the micro-porous channel interconnected by the pores in the framework prominently accelerated infiltration of electrolyte and the diffusion of Li+, thus, the battery exhibited outstan-ding performance at very high rate. Besides, the meso-pores in OCT could accommodate more sulfur and buffers the volume expansion resulted from the phase transformation between sulfur, lithium polysulfides and Li2S2/Li2S. In addition, the abundant micro-pores could alleviate dissolution of lithium polysulfides by strong capillary force, thus, the capacity retention was greatly improved. Thirdly, the large specific surface area provided abundant deposition site for Li2S2/Li2S, which was vital to achieve long cycles.
Borchardt L, Oschatz M, Kaskel S, et al. Chem. Eur. J., 2016, 22:7324-7351 doi: 10.1002/chem.201600040
Maru D W, Zeng K, Zhang M Y, et al. J. Mater. Sci., 2018, 53:14608-14618 doi: 10.1007/s10853-018-2670-0
Sohn H, Gordin M L, Regula M, et al. J. Power Sources, 2016, 302:70-78 doi: 10.1016/j.jpowsour.2015.10.013
Gueon D, Hwang J, Yang S B, et al. ACS Nano, 2018, 12:226-233 doi: 10.1021/acsnano.7b05869
Sun L, Wang D, Luo Y, et al. ACS Nano, 2015, 10(1):1300-1308
Ji X L, Kyu T L, Linda F, et al. Nat. Mater., 2005, 8(6):500-506
Bruce P G, Freunberger S A, Laurence J, et al. Nat. Mater., 2011, 11(1):19-29
Shang X N, Guo P Q, Qin T F, et al. Adv. Mater. Interfaces, 2018, 5(7):1602-1610
Jung J K, Hee S K, Jihoon A, et al. J. Power Sources, 2016, 306:617-622 doi: 10.1016/j.jpowsour.2015.12.093
Yang W, Yang W, Song A, et al. J. Power Sources, 2017, 348:175-182 doi: 10.1016/j.jpowsour.2017.03.008
Liu M, Jiang H R, Ren Y X, et al. Electrochim. Acta, 2016, 213:871-878 doi: 10.1016/j.electacta.2016.08.015
Ghazi Z A, He X, Khattak A M, et al. Adv. Mater., 2017, 29(21):1606817-1606822 doi: 10.1002/adma.201606817
Li J, Huang Y, Zhang S, et al. ACS Appl. Mater. Interfaces, 2017, 9(8):7499-7504 doi: 10.1021/acsami.7b00065
Cheng X B, Huang J Q, Zhang Q J. Electrochem. Soc., 2018, 165(1):A6058-A6072 doi: 10.1149/2.0111801jes
Suriyakumar S, Stephan A M, Angulakshmi N, et al. Electrochim Acta, 2018, 265:151-159 doi: 10.1016/j.electacta.2018.01.155
Jayaprakash N, Shen J, Moganty S S, et al. Angew. Chem. Int. Ed., 2011, 50(26):5904-5908 doi: 10.1002/anie.201100637
Xu G Y, Yan Q B, Kushima A, et al. Nano Energy, 2017, 31:568-574 doi: 10.1016/j.nanoen.2016.12.002
Xu T, Song J, Gordin M L, et al. ACS Appl. Mater. Interfaces, 2013, 5(21):11355-11362 doi: 10.1021/am4035784
Zhang Y Z, Zong X L, Zhan L, et al. Electrochim. Acta, 2018, 284:89-97 doi: 10.1016/j.electacta.2018.05.144
Li X Y, Fu N Q, Zou J Z, et al. Mater. Lett., 2017, 209:505-508 doi: 10.1016/j.matlet.2017.08.083
Maneerung T, Liew J, Dai Y J, et al. Bioresour. Technol., 2016, 200:350-359 doi: 10.1016/j.biortech.2015.10.047
Li H, Riisager A, Saravanamurugan S, et al. ACS Catal., 2017, 8(1):148-187
Xu X, Meng Z, Zhu X L, et al. J. Power Sources, 2018, 380:12-17 doi: 10.1016/j.jpowsour.2018.01.057
Liu M, Chen Y, Chen K, et al. BioResources, 2014, 10(1):155-168
Qu Y H, Zhang Z A, Zhang X H, et al. Carbon, 2015, 84(1):399-408 https://www.sciencedirect.com/science/article/pii/S0008622314011518
Geng Z, Xiao Q F, Wang D B, et al. Electrochim. Acta, 2016, 202:131-139 doi: 10.1016/j.electacta.2016.03.176
Chen F, Yang J, Bai T, et al. Electrochim. Acta, 2016, 192:99-109 doi: 10.1016/j.electacta.2016.01.192
Zhang J, Xiang J Y, Dong Z M, et al. Electrochim. Acta, 2014, 116(2):146-151 https://www.sciencedirect.com/science/article/pii/S0013468613022445
Zhao C J, Liu G Q, et al. Chem. Eng. J., 2018, 334:1270-1280 doi: 10.1016/j.cej.2017.11.069
Zhang H M, Chen J Y, Li Y B, et al. Electrochim. Acta, 2015, 165:7-13 doi: 10.1016/j.electacta.2015.02.240
You X L, Liu L J, Zhang M Y, et al. Mater. Lett., 2018, 217:167-170 doi: 10.1016/j.matlet.2018.01.096
Li Y J, Zhan H, Liu S Q, et al. J. Power Sources, 2010, 195(9):2945-2949 doi: 10.1016/j.jpowsour.2009.11.004
Li H P, Sun L C, Zhao Y, et al. Electrochim. Acta, 2019, 295:822-828 doi: 10.1016/j.electacta.2018.11.012
Wang Z Y, Wang L, Liu S, et al. Adv. Funct. Mater., 2019, 1:1901051-1901061

Figure 1 SEM images (a~d), TEM image (e), HRTEM image (f), EDS (g~j), XPS survey spectrum (k) and high-resolution spectra of (l) C1s, (m) O1s and (n) S2p of OCT

Figure 2 (a) N2 adsorption-desorption isotherms of the OCT; (b) Pore size distribution of the OCT; (c) TG curves of S-1@OCT, S-2@OCT, S-3@OCT and S; (d) XRD patterns of S, S-1@OCT, S-2@OCT, S-3@ OCT and OCT

Figure 3 (a) Long cycling performance of S-3@OCT electrode at 0.2C, 1C and 5C; (b) Discharge-charge voltage profiles of S-3@OCT electrode at 0.2C; (c) CV curves of S-3@OCT electrode; (d) Nyquist plots before cycling of S-3@OCT electrode

 扫一扫看文章

扫一扫关注我们
 下载:
下载: