Scheme1.
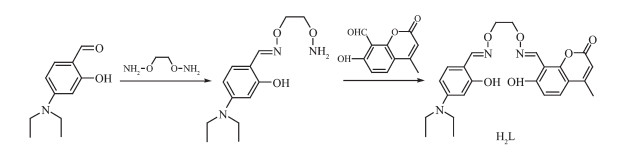
Synthetic route to H2L

Syntheses, Crystal Structures, Hirshfeld Surface Analyses, Thermal and Fluorescent Properties of Cu(Ⅱ) and Ni(Ⅱ) Salamo-Type Complexes
Qiong SU , Qing ZHAO , Xiao-Xin AN , Yan-Bin WANG , Xiao-Yan LI , Wen-Kui DONG


More recently, the preparation of a series of metal complexes has attracted considerable attention in modern coordination chemistry. Salen (R-CH=N-(CH2)n-N=CH-R) and its derivatives have been widely studied by many organic as well as inorganic chem-ists[1-3], because Salen-type ligands containing tetraden-tate [N2O2] coordination site can form stable alkaline earth, rare earth, and transition metal complexes for several decades[4-7]. Moreover, Salen-like ligands and their corresponding metallic complexes have excellent potential applications in many aspects, such as biological systems[8-15], electrochemical conducts[16-18], supra-molecular buildings[19-26], luminescence prop-erties[27-33], catalysis[34-36], magnetic materials[37-44], nonlin-ear optical materials[45] and ions recognition[46-51].
Recently, a new class of Salamo (-CH=N-O-(CH2)n -O-N=CH-) ligands containing [N2O2] donor have been exploited[52-56]. The studies previously showed that Salamo-type complexes are relatively stable at least 10 000 times than Salen-like complexes[57]. Based on our previous reported, Salamo-type metal complexes also have been applied in supramolecular archite-ctures[58-59], organic reaction catalysts and luminescence properties[60-63]. Coumarin, as important materials and intermediate product of organic chemicals, has been widely used in medicine, agriculture, photosensitive materials and other fields. It is noteworthy that coumarin has good characteristics of luminescence[64-65].
Based on the above research, we have devised and prepared a ligand H2L containing coumarin-skeleton and its corresponding mononuclear Cu(Ⅱ) and trinuclear Ni(Ⅱ) Salamo-type complexes. Furthermore, the fluorescent properties, thermal stabilities and Hirshfeld surface analyses of complexes 1 and 2 were also studied in detail.
4-(N, N′-Diethylamino)salicylaldehyde (99%) and 7-hydroxyl-4-methylcoumarin (98%) were purchased from Alfa Aesar and used directly without purification. All other solvents and chemicals were analytical grade and obtained from Tianjin Chemical Reagent Factory. Elemental analyses data of C, H and N were performed on a GmbH VarioEL V3.00 automatic elemental analysis instrument. Elemental analyses for copper(Ⅱ) and nickel(Ⅱ) were detected with an IRIS ER/S-WP-1 ICP atomic emission spectrometer. Melting points were measured with a microscopic melting point apparatus made by Beijing Taike Instrument Limited Company and were uncorrected. Fourier transform IR spectra were recorded with a VERTEX70 FT-IR spectrophotometer, with samples prepared as KBr (500~4 000 cm-1) and CsI (100~500 cm-1) pellets. UV-Visible absorption spectra were collected on a Shimadzu UV-3900 spectrophotometer. Fluorescent spectra were recorded on F-7000 spectrophotometer. Single crystal X-ray structure determinations were determined by a SuperNova Dual, Cu at zero, Eos four-circle diffractometer. Thermal stabilities analyses were carried out at a heating rate of 10 ℃·min-1 on a ZRY-1P thermoanalyzer. Hirshfeld surface analyses and two-dimensional fingerprint plots were calculated using CrystalExplorer program.
1, 2-Bis(aminooxy)ethane and 8-formyl-7-hydroxy-4-methylcoumarin were prepared in accordance with the previously literature[36, 61, 66]. Major synthetic route of the ligand H2L are presented in Scheme 1.
4-(N, N′-Diethylamino)salicylaldehyde (483.1 mg, 2.5 mmol) dissolved in ethanol solution (25 mL) was added slowly to a colorless ethanol solution (50 mL) of 1, 2-bis(aminooxy)ethane (322.4 mg, 3.5 mmol) more than 3 h. Subsequently, the above solution was heated at 52~55 ℃ about 5.5 h. The solution was concentrated by vacuum distillation. Then, the column chromato-graphy isolation for reaction mixture was carried out with ethyl acetate/chloroform (1:20, V/V) and gained 550.2 mg expected intermediate product 2-(O-(1-ethyloxyamide))oxime-5-(N, N′-diethylamino) phenol.
8-Formyl-7-hydroxy-4-methylcoumarin (306.3 mg, 1.5 mmol) was dissolved in the ethanol solution (15 mL). The above solution was added to the stirred colorless ethanol solution (15 mL) of the obtained intermediate product (393.1 mg, 1.5 mmol). The mixture was refluxed and stirred at 80~82 ℃ about 6 h before being allowed to cool to room temperature. Then the suspension solution was filtered and washed with ethanol/hexane (1:4, V/V). After dried under vacuum, the resulting white solid of H2L was collected. Yield: 61.6%. m.p. 148~149 ℃. Anal. Calcd. for C24H27N3O6(%): C 63.56; H 6.00; N 9.27. Found(%): C 63.62; H 6.09; N 9.18.
A methanol solution (2 mL) of copper(Ⅱ) acetate dihydrate (1.99 mg, 0.01 mmol) was mixed to an acetonitrile solution (2 mL) of H2L (4.53 mg, 0.01 mmol). The mixture was stirred further at room temperature for 30 min, and the color of the solution turned dark green. After that the solution was filtered and the filtrate was left undisturbed at room temperature for approximately one week. Clear dark brown block-shaped crystals suitable for X-ray measurement were obtained. Yield: 40.5%. Anal. Calcd. for C24H25CuN3O6(%): C 55.97; H 4.89; N 8.16; Cu 12.34. Found(%): C 56.08; H 4.96; N 8.09; Cu 12.27.
A methanol solution (2 mL) of nickel(Ⅱ) acetate tetrahydrate (7.47 mg, 0.03 mmol) was completely added to an acetonitrile solution (2.0 mL) of H2L (9.07 mg, 0.02 mmol). Then the color of the mixed solution became light green and was stirred for 20 min at room temperature. After that the mixture was filtered, and the resulting filtrate was stand undisturbed for about two weeks at room temperature. Clear light green block-like single crystals for X-ray crystallographic analysis were collected. Yield: 45.2%. Anal. Calcd. for C56H72Ni3N6O20(%): C 50.75; H 5.48; N 6.34; Ni 13.29. Found(%): C 50.82; H 5.56; N 6.26; Ni 13.19.
Suitable crystals of complexes 1 and 2 with approximate dimensions of 0.15 mm×0.18 mm×0.21 mm and 0.17 mm×0.21 mm×0.23 mm, respectively, were mounted on glass rod for determining single crystal structures. X-ray diffraction data of complexes 1 and 2 were performed on a SuperNova (Dual, Cu at zero, Eos) diffractometer using a graphite monochro-mated Mo Kα radiation source (λ=0.071 073 nm) at 293.53(10) K, respectively. Multi-scan absorption corrections were applied. The crystal structures were solved using direct methods and refined anisotropically by the full-matrix least-squares techniques based on F2 with SHELX-2014 program[67]. The positions for hydro-gen atoms were fixed on geometrically idealized posi-tions and refined via a riding model. The non-hydro-gen atoms were refined anisotropically with displace-ment parameters. Selected collection parameters and structure refinement of complexes 1 and 2 are summarized in Table 1.

 下载:
导出CSV
下载:
导出CSV
| Complex | 1 | 2 |
| Formula | C24H25CuN3O6 | C56H72Ni3N6O20 |
| Formula weight | 515.01 | 1 325.32 |
| Crystal system | Monoclinic | Triclinic |
| Space group | P21/c | P1 |
| a / nm | 0.930 33(3) | 1.026 80(12) |
| b / nm | 3.155 67(10) | 1.129 69(13) |
| c / nm | 0.770 51(2) | 1.385 94(14) |
| α / (°) | 78.774(9) | |
| β / (°) | 96.500(3) | 75.005(10) |
| γ / (°) | 75.672(10) | |
| V / nm3 | 2.247 5(12) | 1.489 9(13) |
| Z | 4 | 1 |
| Dc / (g·cm-3) | 1.522 | 1.477 |
| μ / mm-1 | 1.019 | 1.018 |
| F(000) | 1 068.0 | 694.0 |
| θ range / (°) | 3.321~26.019 | 3.316~26.021 |
| Index ranges | -11 ≤ h ≤ 7, -38 ≤ k ≤ 32, -9 ≤ l ≤ 8 | -10 ≤ h ≤ 12, -10 ≤ k ≤ 13, -17 ≤ l ≤ 17 |
| Reflection collected | 9 589 | 9 650 |
| Independent reflection | 4 426 | 5 855 |
| Rint | 0.027 1 | 0.044 7 |
| Completeness to θ / % | 99.66 | 99.80 |
| Data, restraint, parameter | 4 426, 0, 310 | 5 855, 28, 413 |
| GOF on F2 | 1.192 | 1.037 |
| Final R indices [I > 2σ(I)] | R=0.055 4, wR=0.102 6 | R=0.092 9, wR=0.116 7 |
| Largest diff. peak and hole / (e·nm-3) | 274 and -385 | 627 and -400 |
CCDC: 1869995, 1; 1869996, 2.
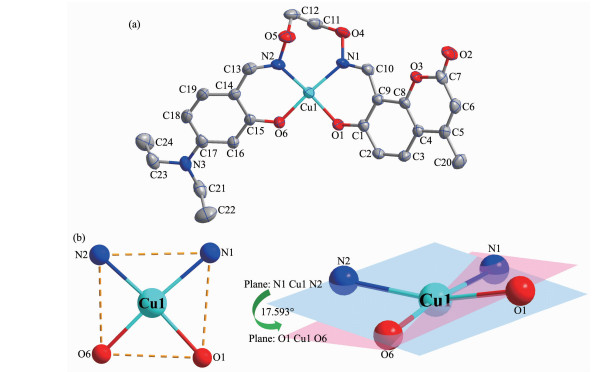
X-ray diffraction analysis demonstrated that complex 1 possesses an asymmetric mononuclear structure and crystallizes in the monoclinic system with P21/c space group. Asymmetric unit of complex 1 is composed of one Cu(Ⅱ) ion and one fully deprotonated L2- unit. The molecular structure with atomic labeling of complex 1 is depicted in Fig. 1. Selected bond lengths and angles of complex 1 are listed in Table 2.
Hydrogen atoms and solvent molecules are omitted for clarity
下载:
导出CSV
| 1 | |||||
| Cu1-O1 | 0.192 6(2) | Cu1-O6 | 0.189 4(2) | Cu1-N1 | 0.199 5(3) |
| Cu1-N2 | 0.194 5(3) | ||||
| O1-Cu1-O6 | 87.03(9) | O1-Cu1-N1 | 88.45(10) | O1-Cu1-N2 | 162.58(10) |
| O6-Cu1-N1 | 173.65(11) | O6-Cu1-N2 | 90.91(10) | N1-Cu1-N2 | 94.73(11) |
| 2 | |||||
| Ni1-O1 | 0.204 8(3) | Ni1-O6 | 0.202 0(3) | Ni1-O7 | 0.202 4(3) |
| Ni1-O9 | 0.208 7(3) | Ni1-N1 | 0.207 6(4) | Ni1-N2 | 0.206 7(3) |
| Ni2-O1 | 0.210 4(3) | Ni2-O6 | 0.204 4(3) | Ni2-O8 | 0.210 7(3) |
| Ni2-O1#1 | 0.210 4(3) | Ni2-O6#1 | 0.204 4(3) | Ni2-O8#1 | 0.210 7(3) |
| O1-Ni1-O6 | 79.31(11) | O1-Ni1-O7 | 91.36(11) | O1-Ni1-O9 | 91.58(11) |
| O1-Ni1-N1 | 86.94(14) | O1-Ni1-N2 | 166.48(13) | O6-Ni1-O7 | 94.41(11) |
| O6-Ni1-O9 | 88.73(11) | O6-Ni1-N1 | 165.21(15) | O6-Ni1-N2 | 87.39(14) |
| O7-Ni1-O9 | 176.05(12) | O7-Ni1-N1 | 91.31(13) | O7-Ni1-N2 | 87.19(13) |
| O9-Ni1-N1 | 86.21(13) | O9-Ni1-N2 | 90.57(12) | N1-Ni1-N2 | 106.53(16) |
| O1-Ni2-O6 | 77.49(10) | O1-Ni2-O8 | 91.28(11) | O1-Ni2-O1#1 | 180.00 |
| O1-Ni2-O6#1 | 102.51(10) | O1-Ni2-O8 | 88.72(11) | O6-Ni2-O8 | 87.74(11) |
| O1-Ni2-O6#1 | 102.51(10) | O6-Ni2-O6#1 | 180.00 | O6-Ni2-O8 | 92.26(11) |
| O8-Ni2-O8#2 | 180.00 | O1-Ni2-O6#1 | 77.49(10) | O1-Ni2-O8#2 | 91.28(11) |
| O6-Ni2-O8#2 | 87.74(11) | ||||
| Symmetry codes: #1: 1-x, 1-y, 1-z; #2: x, y, -1+z for 2. | |||||
The Cu(Ⅱ) ion in the [N2O2] donor coordination sphere from full deprotonated L2- unit is four-coor-dinated, which is bonded to two oxygen atoms (Cu1-O1 0.192 6(2) nm, Cu1-O6 0.189 4(2) nm) of the phenolic groups and two nitrogen atoms (Cu1-N1 0.199 5(3) nm, Cu1-N2 0.194 5(3) nm) of the oxime groups. Consequently, the coordination geometry of Cu(Ⅱ) ion could be best described as a distorted square planar geometry with [CuN2O2] coordination and deduced by using τ4 index(τ4=0.169)[68] (Fig. 1b). Moreover, the coordination planes of N1-Cu1-N2 and O1-Cu1-O6 have a dihedral angle of 17.593°, which has a nonplanar configuration. Based on the above data, the distances of Cu1 atom and phenolic oxygen (O1 and O6) atoms of the fully deprotonated L2- unit are clearly shorter than those of the nitrogen (N1 and N2) atoms from Salamo-type moiety of H2L. The angle of N-Cu1-O is in a range of 88.45(10)°~173.65(11)°, and the angle of O1-Cu1-O6 and N1-Cu1-N2 are 87.03(9)° and 94.73(11)°, respectively (Table 2).
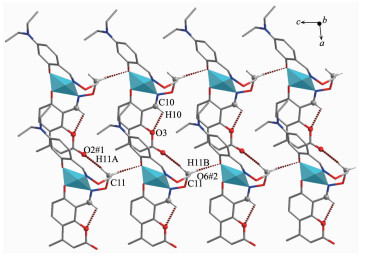
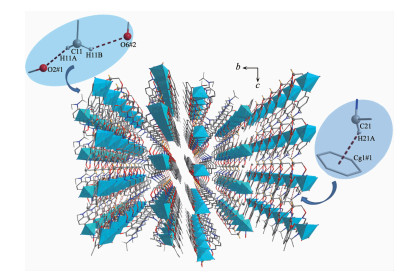
It is worthy to note that important supramolecular interactions exist in complex 1. The major hydrogen bonds and C-H…π interactions in complex 1 are listed in Table 3. Two intramolecular hydrogen bonding (C10-H10…O3, C11-H11A…O2#1) and one intermolecular hydrogen bonding(C11-H11B…O6#2) interactions form an infinite 1D chain structure[24, 58] (Fig. 2). There is only one C-H…π (C21-H21A…Cg1#1, Cg1: C1-C2-C3-C4-C8-C9) interaction. A complicated 3D supramolecular architecture is formed through the interplay of hydrogen bonding and C-H…π interactions (Fig. 3)[25, 59].
Symmetry codes: #1: -1+x, y, z; #2: x, y, -1+ z
The molecular structure of complex 2 was determined by X-ray crystallographic and atom numbering is presented in Fig. 4. Selected bond lengths and angles of complex 2 are listed in Table 2.
下载:
导出CSV
| D-H…A | d(D-H) / nm | d(H…A) / nm | d(D…A) / nm | ∠D-H…A / (°) | |
| 1 | |||||
| C10-H10…O3 | 0.093 | 0.235 0 | 0.270 4(3) | 102 | |
| C11-H11A…O2#1 | 0.097 | 0.256 0 | 0.350 7(4) | 164 | |
| C11-H11B…O6#2 | 0.097 | 0.255 0 | 0.334 3(4) | 139 | |
| C21-H21A…Cg1#1 | 0.097 | 0.283 0 | 0.363 0(4) | 141 | |
| 2 | |||||
| C10-H10…O3#1 | 0.093 | 0.227 0 | 0.266 5(6) | 105 | |
| C12-H12A…O7#1 | 0.097 | 0.230 0 | 0.313 6(6) | 143 | |
| C16-H16…O8#1 | 0.093 | 0.255 0 | 0.324 1(5) | 132 | |
| C23-H23B…O4#2 | 0.097 | 0.256 0 | 0.333 7(6) | 137 | |
| O10-H10A…O8#2 | 0.082 | 0.203 0 | 0.274 7(5) | 146 | |
| C20-H20A…Cg2#3 | 0.096 | 0.280 0 | 0.349 1(5) | 130 | |
| Symmetry codes: #1: -1+x, y, z; #2: x, y, -1+z for 1; #1: 1-x, 1-y, 1-z; #2: x, y, -1+z; #3: -x, 1-y, 2-z for 2. Cg1 is the centroids of benzene ring C1-C2-C3-C4-C8-C9 of 1; Cg2 is the centroids of benzene ring O3-C7-C6-C5-C4-C8 of 2. | |||||
Symmetry codes: #1: -1+x, y, z; #2: x, y, -1+z
Hydrogen atoms and solvent molecules are omitted for clarity; Symmetry codes: #1: 1-x, 1-y, 1-z
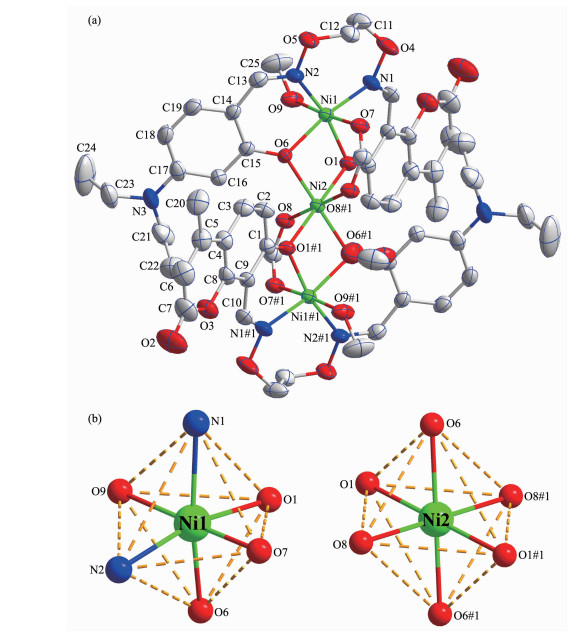
Single crystal X-ray diffraction analysis indicated that the crystal structure of complex 2 is very different from complex 1, forming a new 2:3 (molar ratio of L2- to Ni(Ⅱ)) trinuclear structure. Complex 2 crystallizes in the triclinic system space group of P1 and is made up of three Ni(Ⅱ) ions, two μ-acetate anions, one coor-dinated methanol molecule, two fully deprotonated L2- units and one lattice methanol molecule.
As depicted in Fig. 4, two symmetrically equivalent terminal six-coordinated Ni(Ⅱ) ions (Ni1 or Ni1#1) in [N2O2] cores of the two Salamo-type ligands, are bound by four donor atoms (N1, N2, O1, O6 or N1#1, N2#1, O1#1, O6#1) from the unsymmetrical fully deprotonated L2- units (Ni1-N1 0.207 6(4) nm, Ni1-N2 0.206 7(3) nm, Ni1-O1 0.204 8(3) nm, Ni1-O6 0.202 0(3) nm), one oxygen atom (Ni1-O9 0.208 7(3) nm) from coordinated methanol molecule and one oxygen atom (Ni1-O7 0.202 4(3) nm) from a μ-acetate anion. Therefore, the terminal Ni(Ⅱ) ions (Ni1 or Ni1#1) form the slightly distorted octahedral geometries. Meantime, the central Ni2 ion is surrounded by six oxygen atoms: four phenolic oxygen atoms (Ni2-O1 0.210 4(3) nm, Ni2-O6 0.204 4(3) nm, Ni2-O1#1 0.210 4(3) nm, Ni2-O6#1 0.204 4(3) nm) arising from two fully deprotonated L2- units and two oxygen atoms (Ni2-O8 0.210 7(3) nm, Ni2-O8#1 0.210 7(3) nm) of two μ-acetate anions. Consequently, the central Ni2 ion is also six-coor-dinated possessing the geometry of a slightly distorted octahedron. The angle of N1-Ni1-N2 is 106.53(16)°, and Ni1-O-Ni2 is in a range of 96.27(12)°~99.09(11)°. The Ni1…Ni2 distance is 0.309 2(4) nm and the length of two terminal Ni1…Ni1#1 is 0.618 4(4) nm (Table 2).
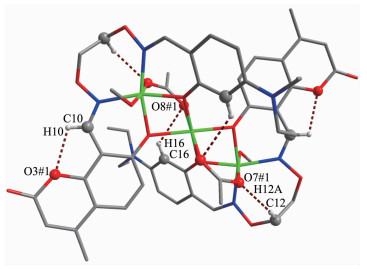
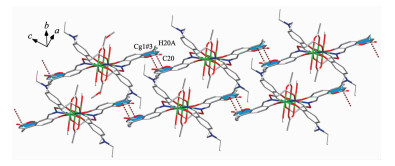
Supramolecular architecture of complex 2 is connected by extensive hydrogen bonding and C-H…π interactions, which plays an important role in the crystal packing modes. Three intramolecular hydrogen bonding interactions(C10-H6…O3#1, C12-H12A…O7#1 and C16-H16…O8#1) are observed(Fig. 5)[24, 58]. In addition, 2D supramolecular architecture is built by one C-H…π (C20-H20A…Cg2#3, Cg2: O3-C7-C6-C5-C4-C8) interaction (Fig. 6). With the help of hydrogen bonding and C-H…π interactions, adjacent molecular units are linked together to form an infinite 3D supramolecular structure shown in Fig. 7[25, 59].
Symmetry codes: #1: 1-x, 1-y, 1-z
Symmetry codes: #3: -x, 1-y, 2-z
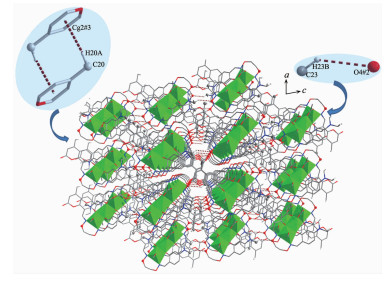
Symmetry codes: #2: x, y, -1+z; #3: -x, 1-y, 2-z
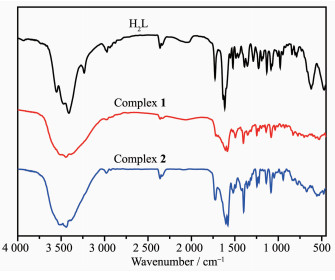
Infrared spectra were measured at various bands within a region of 4 000~500 cm-1 (Fig. 8), which confirms the presence of H2L and its complexes 1 and 2. Major infrared bands are delineated in Table 4. It can be seen from the IR spectra, the phenolic O-H stretching vibration band of H2L exhibited a characteristic absorption at 3 231 cm-1. However, this band was not emerged in complex 1, which indicated that the phenolic hydroxyl groups of H2L are fully deprotonated. This band disappeared, and a new O-H stretching vibration band of the coordinated methanol molecule was seen at around 3 443 cm-1 [27]. The expected Ar-O vibration band of H2L was observed at ca. 1 286 cm-1; nevertheless, this band occurred at 1 241 and 1 244 cm-1 in complexes 1 and 2, respe-ctively, shifting to low frequencies[32]. The observed band at 1 613 cm-1 in H2L is assigned to a chara-cteristic C=N vibration. Meanwhile, the C=N vibration bands of complexes 1 and 2 displayed at 1 596 and 1 595 cm-1, respectively. The frequencies in complexes 1 and 2 moved towards lower frequencies region due to the coordination between nitrogen atoms of the C=N group and the metal ions[40]. A typical C=O vibration band in the H2L emerged at 1 731 cm-1, and those of complexes 1 and 2 were obtained at approximately 1 715 and 1 724 cm-1, respectively[65]. Upon complexa-tion, M-N/O interactions were formed in the IR spectra. Most important of all, the appearance of new medium intensity bands for complexes 1 and 2 at approximately 529 and 539 cm-1 are attributed to M-N stretching vibration band and the bands at 456 and 462 cm-1 are assigned to M-O vibration band[65]. The facts mentioned above are in accordance with the results of crystal X-ray diffractions.
下载:
导出CSV
| cm-1 | ||||||
| νO=H | νAr-O | νC=N | νC=O | νM-N | νM-O | |
| H2L | 3 231 | 1 286 | 1 613 | 1 731 | — | — |
| Complex 1 | — | 1 241 | 1 596 | 1 715 | 529 | 456 |
| Complex 2 | 3 443 | 1 244 | 1 595 | 1 724 | 539 | 462 |
UV-Vis spectrum of H2L in methanol solution (25 μmol·L-1) and its corresponding complexes 1 and 2 in methanol solution (1 mmol·L-1) were measured within a range of 220~550 nm (Fig. 9). Clearly, the UV-Vis spectrum of H2L had three relatively intense absorption peaks at 289, 328 and 356 nm, respectively. The former peak at 289 nm could be assigned to the π-π* transition for the benzene rings; the second peak at 328 nm could be appointed to π-π* transition for the oxime group; and the third peak at 356 nm could be assigned to the n-π* transitions for carbonyl group[32, 64].
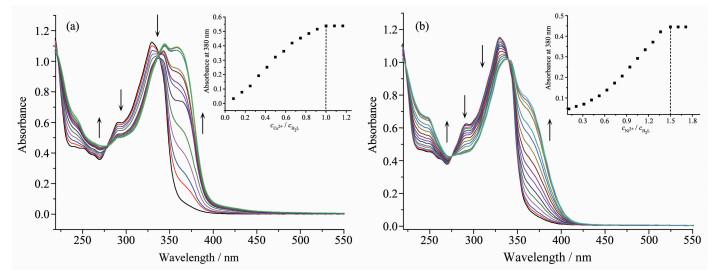
cH2L=25 μmol·L-1; the arrow indicates that the concentration of metal ions is gradually increasing
In the titration experiment of complex 1, the gradual addition of Cu(OAc)2 to H2L solution caused the color variation from colorless to dark brown. In contrast to H2L, the absorption peaks were bathochro-mically shifted[64]. The phenomena above are owing to the reaction of H2L with Cu(Ⅱ) ions. When Cu(Ⅱ) ions were added in excess (cCU2+/cH2L>1), the absorbance remained relatively stable. Quite evidently, the spec-troscopic titration of H2L and Cu(Ⅱ) shows the forma-tion of a 1:1 mononuclear Cu(Ⅱ) complex (Fig. 9a).
Similar change was also seen in the titration experiment of complex 2. Obviously, the spectroscopic titration of H2L and Ni(Ⅱ) displayed the formation of a 2:3 trinuclear Ni(Ⅱ) complex, giving the similar results and presented in Fig. 9b.
The fluorescence behaviors of H2L and its corresponding complexes 1 and 2 were measured in methanol solution (25 mmol·L-1) at room temperature in a wavelength range of 350~600 nm and displayed in Fig. 10. The spectra of H2L exhibited an intense emission peak at 416 nm upon excitation at 350 nm, which should be attributed to intra-ligand π-π* transitions owing to the existence of lone pair elec-trons of the donor atoms (N, O-donor)[30, 61]. While the spectra of complexes 1 and 2 displayed two relatively weak emission peaks at 422 and 435 nm upon excita-tion at 350 nm, respectively. The emission peaks of complexes 1 and 2 were bathochromically-shifted compared to those of H2L, which can be attributed to L-M charge-transfer transitions (LMCT) resulting from the coordination of nitrogen and oxygen atoms to metal (Cu and Ni) ions[31, 62].
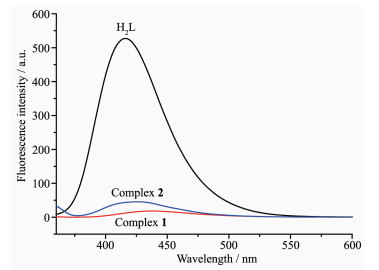
c=25 mmol·L-1
The Hirshfeld surfaces of H2L and its complexes 1 and 2 were analyzed using Crystal Explorer. The surface analyses of H2L and its complexes 1 and 2 mapped with dnorm (standard high resolution), curvedness and shape index, are illustrated in Fig. 11[69].
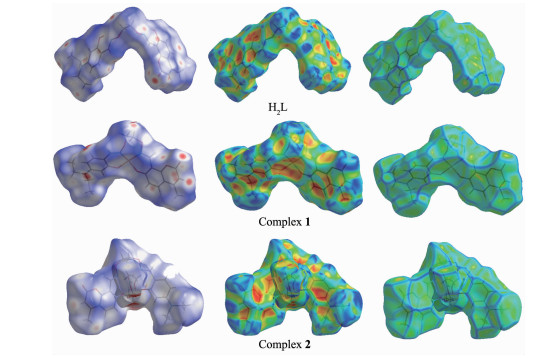
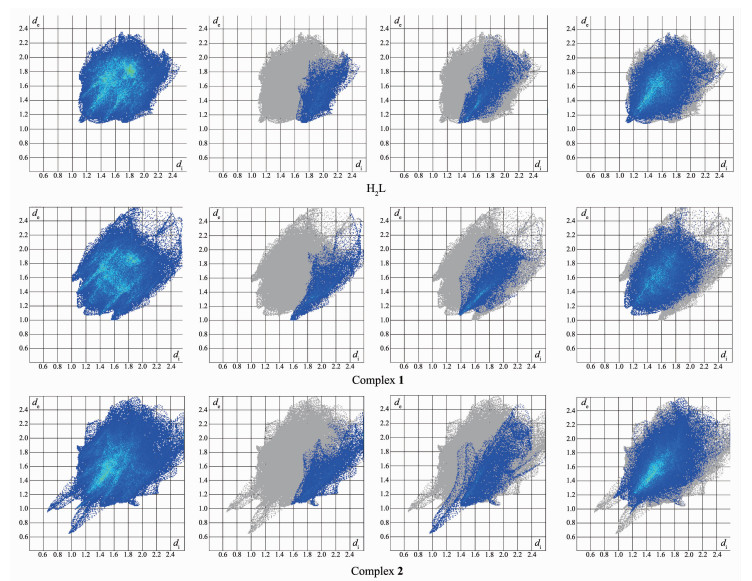
When mapped with the function of dnorm, the surface of H2L produces several spherical red depressions indicating that there are mainly C-H…O interactions, and other visible depressions correspond to H…H and C…H interactions. For complexes 1 and 2, more intense red depressions are seen on the Hirshfeld surfaces, which marks the O…H/H…O interactions persisting. Two dimensional fingerprint plots are used to explain the atom pair contacts of the crystal, which can quantify the intermolecular interactions. Meantime, it could be decomposed to highlight contributions from different interactions. The 2D fingerprint plot of H…H, C…H/H…C and O…H/H…O interactions in H2L and complexes 1 and 2 are depicted in Fig. 12. For each point on the Hirshfeld isosurface, two distances, de (the distance from the point to the nearest nucleus external to the surface) and di (the distance to the nearest nucleus internal to the surface), are defined. The proportions of C…H/H…C, O…H/H…O and H…H interactions in H2L cover 10.3%, 11.7% and 48.1% of the Hirshfield surfaces, respectively. However, the proportions of C…H/H…C, O…H/H…O and H…H interactions in complexes 1 and 2 cover 10.6%, 13.5%, 44.1% and 11.0%, 12.1%, 54.1% of the Hirshfield surfaces, respectively. It is due to the existence of hydrogen bonds that complexes 1 and 2 can be more stable[70].
TG curves of complexes 1 and 2 are shown in Fig.S1(Supporting Information). The TG analysis of complex 1 indicated that a weight loss occurred in a temperature range of 168~179 ℃, which is due to the breakdown of ligand H2L. Between 198 and 650 ℃, TG curve of 1 displayed overall estimated weight loss of 83.7% (Calcd. 84.6%), indicating the completely decomposition of ligand molecule and the formation of CuO(Calcd. 15.4%, Obsd. 16.3%)[62].
Complex 2 was thermally decomposed in three steps. An initial weight loss of 3.1% (Calcd. 2.4%) was observed in a temperature range of 70~85 ℃, which corresponds to the loss of one lattice methanol molecule. The second step of decomposition was noticed in a temperature range of 150~230 ℃, which is due to the elimination of two μ2-acetate ions and two coordinated methanol molecules. Meanwhile, the weight loss obtained in this step was 13.1% against the calculated loss of 13.7%. Finally, the third step was between 245 and 650 ℃ with approximately 66.2% weight loss (Calcd. 67.0%), indicating the decomposition of ligand molecule and the remaining product weight seems likely to correspond to NiO with a value of 17.6% (Calcd. 16.9%). The overall estimated weight loss amounts to 82.4%[62].
In summary, the syntheses and structural characterization of a new containing coumarin-skeleton ligand H2L and its two new mononuclear Cu(Ⅱ) and trinuclear Ni(Ⅱ) Salamo-type complexes, with the general chemical formulae of [CuL] (1) and [Ni3(L)2(μ-OAc)2(CH3OH)2]·CH3OH (2), were described in the present paper. Single-crystal X-ray diffractions have established their structures. Abundant hydrogen bonding and C-H…π supra-molecular interactions exist in complexes 1 and 2. The fluorescent results of complexes 1 and 2 showed relatively weak emission peaks compared to H2L. The Hirshfeld surfaces and 2D fingerprint plots can explain the atom pair contacts of the crystal, which can quantify the intermolecular interactions.
Acknowledgements: This work was supported by the National Natural Science Foundation of China (Grants No.51563022, 21761018) and the Program for Excellent Team of Scientific Research in Lanzhou Jiaotong University (Grant No.201706), which are gratefully acknowledged.
Supporting information is available at http://www.wjhxxb.cn
Lee S H, Shin N, Kwak S W, et al. Inorg. Chem., 2017, 56:2621-2626 doi: 10.1021/acs.inorgchem.6b02797
Liu P P, Wang C Y, Zhang M, et al. Polyhedron, 2017, 129:133-140 doi: 10.1016/j.poly.2017.03.019
Subramaniam P, Anbarasan S, Devi S S, et al. Polyhedron, 2016, 119:14-22 doi: 10.1016/j.poly.2016.08.013
Akine S, Miyashita M, Piaob S, et al. Inorg. Chem. Front., 2014, 1:53-57 doi: 10.1039/C3QI00067B
Akine S, Varadi Z, Nabeshima T. Eur. J. Inorg. Chem., 2013, 35:5987-5998
Song X Q, Lei Y K, Wang X R, et al. J. Solid State Chem., 2014, 218:202-212 doi: 10.1016/j.jssc.2014.06.025
孙银霞, 李春宇, 杨成娟等.无机化学学报, 2016, 32:327-335 http://www.wjhxxb.cn/wjhxxbcn/ch/reader/view_abstract.aspx?flag=1&file_no=20160218&journal_id=wjhxxbcnSUN Yin-Xia, LI Chun-Yu, YANG Cheng-Juan et al. Chinese J. Inorg. Chem., 2016, 32:327-335 http://www.wjhxxb.cn/wjhxxbcn/ch/reader/view_abstract.aspx?flag=1&file_no=20160218&journal_id=wjhxxbcn
Chen C Y, Zhang J W, Zhang Y H, et al. J. Coord. Chem., 2015, 68:1054-1071 doi: 10.1080/00958972.2015.1007965
Wu H L, Bai Y H, Zhang Y H, et al. Z. Anorg. Allg. Chem., 2014, 640:2062-2071 doi: 10.1002/zaac.v640.10
Wu H L, Pan G L, Wang H, et al. J. Photochem. Photobiol. B, 2014, 135:33-43 doi: 10.1016/j.jphotobiol.2014.04.005
Wu H L, Pan G L, Bai Y C, et al. J. Chem. Res., 2014, 38:211-217 doi: 10.3184/174751914X13933417974082
Wu H L, Bai Y C, Zhang Y H, et al. J. Coord. Chem., 2014, 67:3054-3066 doi: 10.1080/00958972.2014.959507
Wang F, Xu Y L, Aderinto S O, et al. J. Photochem. Photobiol. A, 2017, 332:273-282 doi: 10.1016/j.jphotochem.2016.09.004
Wu H L, Wang H, Wang X L, et al. New J. Chem., 2014, 38:1052-1061 doi: 10.1039/c3nj01145c
Wu H L, Pan G L, Bai Y C, et al. Res. Chem. Intermed., 2015, 41:3375-3388 doi: 10.1007/s11164-013-1440-5
Hao J, Li X Y, Wang L, et al. Spectrochim. Acta Part A, 2018, 204:388-402 doi: 10.1016/j.saa.2018.06.074
Wang L, Hao J, Zhai L X, et al. Crystals, 2017, 7:277 doi: 10.3390/cryst7090277
Ömer S, ÜmmühanÖÖ, Nurgul S, et al. Tetrahedron, 2016, 72:5843-5852 doi: 10.1016/j.tet.2016.08.004
Chai L Q, Huang J J, Zhang H S, et al. Spectrochim. Acta Part A, 2014, 131:526-531 doi: 10.1016/j.saa.2014.04.127
Chai L Q, Zhang K Y, Tang L J, et al. Polyhedron, 2017, 130:100-107 doi: 10.1016/j.poly.2017.04.010
Dong X Y, Li X Y, Liu L Z, et al. RSC Adv., 2017, 7:48394-48403 doi: 10.1039/C7RA07826A
Chai L Q, Zhang H S, Huang J J, et al. Spectrochim. Acta Part A, 2015, 137:661-669 doi: 10.1016/j.saa.2014.08.084
Chen L, Dong W K, Zhang H, et al. Cryst. Growth Des., 2017, 17:3636-3648 doi: 10.1021/acs.cgd.6b01860
Zhang L W, Liu L Z, Wang F, et al. Molecules, 2018, 23:1141 doi: 10.3390/molecules23051141
Dong X Y, Zhao Q, Wei Z L, et al. Molecules, 2018, 23:1006 doi: 10.3390/molecules23051006
Chai L Q, Tang L J, Chen L C, et al. Polyhedron, 2017, 122:228-240 doi: 10.1016/j.poly.2016.11.032
Dong X Y, Akogun S F, Zhou W M, et al. J. Chin. Chem. Soc., 2017, 64:412-419 doi: 10.1002/jccs.2017.64.issue-4
Dong Y J, Dong X Y, Dong W K, et al. Polyhedron, 2017, 123:305-315 doi: 10.1016/j.poly.2016.12.010
Xu L, Zhu L C, Ma J C, et al. Z. Anorg. Allg. Chem., 2015, 641:2520-2524 doi: 10.1002/zaac.201500619
Dong W K, Ma J C, Dong Y J, et al. J. Coord. Chem., 2016, 69:3231-3241 doi: 10.1080/00958972.2016.1231302
Tao C H, Ma J C, Zhu L C, et al. Polyhedron, 2017, 128:38-45 doi: 10.1016/j.poly.2017.02.040
Wang P, Zhao L. Synth. React. Inorg. Met.-Org. Nano-Met. Chem., 2016, 46:1095-1101 doi: 10.1080/15533174.2015.1004416
Dong X Y, Zhao Q, Kang Q P, et al. Crystals, 2018, 8:230 doi: 10.3390/cryst8050230
Li X Y, Chen L, Gao L, et al. RSC Adv., 2017, 7:35905-35916 doi: 10.1039/C7RA06796H
Li L H, Dong W K, Zhang Y, et al. Appl. Organomet. Chem., 2017:e3818 http://www.cnki.com.cn/Article/CJFDTotal-ZJJJ201402024.htm
Chin T K, Endud S, Jamil S, et al. Catal. Lett., 2013, 143:282-288 doi: 10.1007/s10562-012-0959-1
Liu P P, Sheng L, Song X Q, et al. Inorg. Chim. Acta, 2015, 434:252-257 doi: 10.1016/j.ica.2015.05.026
Song X Q, Liu P P, Xiao Z R, et al. Inorg. Chim. Acta, 2015, 438:232-244 doi: 10.1016/j.ica.2015.09.022
Song X Q, Peng Y J, Chen G Q, et al. Inorg. Chim. Acta, 2015, 427:13-21 doi: 10.1016/j.ica.2014.12.008
Dong W K, Ma J C, Dong Y J, et al. Polyhedron, 2016, 115:228-235 doi: 10.1016/j.poly.2016.05.017
Dong W K, Ma J C, Zhu L C, et al. New J. Chem., 2016, 40:6998-7010 doi: 10.1039/C6NJ00855K
Liu Y A, Wang C Y, Zhang M, et al. Polyhedron, 2017, 127:278-286 doi: 10.1016/j.poly.2017.02.007
Song X Q, Liu P P, Liu Y A, et al. Dalton Trans., 2016, 45:8154-8163 doi: 10.1039/C6DT00212A
Zheng S S, Dong W K, Zhang Y, et al. New J. Chem., 2017, 41:4966-4973 doi: 10.1039/C6NJ04090J
Bella S D, Fragala I. Synth. Met., 2000, 115:191-196 doi: 10.1016/S0379-6779(00)00354-4
Dong W K, Li X L, Wang L, et al. Sens. Actuators B, 2016, 229:370-378 doi: 10.1016/j.snb.2016.01.139
Wang B J, Dong W K, Zhang Y, et al. Sens. Actuators B, 2017, 247:254-264 doi: 10.1016/j.snb.2017.02.154
Wang F, Gao L, Zhao Q, et al. Spectrochim. Acta Part A, 2018, 190:111-115 doi: 10.1016/j.saa.2017.09.027
Dong Y J, Li X L, Zhang Y, et al. Supramol. Chem., 2017, 29:518-527 doi: 10.1080/10610278.2017.1285031
Hao J, Li X Y, Zhang Y, et al. Materials, 2018, 11:523 doi: 10.3390/ma11040523
Dong W K, Akogun S F, Zhang Y, et al. Sens. Actuators B, 2017, 238:723-734 doi: 10.1016/j.snb.2016.07.047
Dong W K, Ma J C, Zhu L C, et al. Cryst. Growth Des., 2016, 16:6903-6914 doi: 10.1021/acs.cgd.6b01067
Wang L, Li X Y, Zhao Q, et al. RSC Adv., 2017, 7:48730-48737 doi: 10.1039/C7RA08789F
Dong W K, Li G, Wang Z K, et al. Spectrochim. Acta Part A, 2014, 133:340-347 doi: 10.1016/j.saa.2014.04.190
Hao J, Li L H, Zhang J T, et al. Polyhedron, 2017, 134:1-10 doi: 10.1016/j.poly.2017.05.060
Zhang H, Dong W K, Zhang Y, et al. Polyhedron, 2017, 133:279-293 doi: 10.1016/j.poly.2017.05.051
Akine S, Taniguchi T, Dong W K, et al. J. Org. Chem., 2005, 70:1704-1711 doi: 10.1021/jo048030y
Kang Q P, Li X Y, Zhao Q, et al. Appl. Organomet. Chem., 2018, 32:e4379 doi: 10.1002/aoc.v32.7
Hao J, Liu L Z, Dong W K, et al. J. Coord. Chem., 2017, 70:1936-1952 doi: 10.1080/00958972.2017.1324152
杨玉华, 郝静, 董银娟, 等.无机化学学报, 2017, 33:1280-1292 doi: 10.11862/CJIC.2017.150YANG Yu-Hua, HAO Jing, DONG Yin-Juan, et al. Chinese J. Inorg. Chem., 2017, 33:1280-1292 doi: 10.11862/CJIC.2017.150
Akine S, Taniguchi T, Saiki T, et al. J. Am. Chem. Soc., 2005, 127:540-541 doi: 10.1021/ja046790k
Zhao Q, Wei Z L, Kang Q P, et al. Spectrochim. Acta Part A, 2018, 203:472-480 doi: 10.1016/j.saa.2018.06.007
Dong W K, Zheng S S, Zhang J T, et al. Spectrochim. Acta Part A, 2017, 184:141-150 doi: 10.1016/j.saa.2017.04.061
Gao L, Wang F, Zhao Q, et al. Polyhedron, 2018, 139:7-16 doi: 10.1016/j.poly.2017.10.004
Dong X Y, Gao L, Wang F, et al. Crystals, 2017, 7:267 doi: 10.3390/cryst7090267
Dong Y, Li F J, Jiang X X, et al. Org. Lett., 2011, 9:2252-2255 http://med.wanfangdata.com.cn/Paper/Detail/PeriodicalPaper_PM21476597
Sheldrick G M. Acta Crystallogr. Sect. C:Cryst. Struct. Commun., 2015, C71:3-8
Yang L, Powell D R, House R P. Dalton Trans., 2007, 9:955-964 http://www.ncbi.nlm.nih.gov/pubmed/17308676
Ghosh K, Harms K, Chattopadhyay S. Polyhedron, 2017, 123:162-175 doi: 10.1016/j.poly.2016.10.027
Wang F, Liu L Z, Gao L, et al. Spectrochim. Acta Part A, 2018, 203:56-64 doi: 10.1016/j.saa.2018.05.088

Figure 1 (a) Molecular structure of complex 1 with 50% probability displacement ellipsoids; (b) Coordination polyhedrons for the Cu(Ⅱ) ion
Hydrogen atoms and solvent molecules are omitted for clarity

Figure 2 View of the hydrogen bonding interactions of complex 1
Symmetry codes: #1: -1+x, y, z; #2: x, y, -1+ z

Figure 3 Three dimensional supramolecular architecture of complex 1 constructed by hydrogen bonding and C-H…π interactions
Symmetry codes: #1: -1+x, y, z; #2: x, y, -1+z

Figure 4 (a) Molecular structure of complex 2 with 50% probability displacement ellipsoids; (b) Coordination polyhedrons for the Ni(Ⅱ) ions
Hydrogen atoms and solvent molecules are omitted for clarity; Symmetry codes: #1: 1-x, 1-y, 1-z

Figure 5 View of the intramolecular hydrogen bonding interactions of complex 2
Symmetry codes: #1: 1-x, 1-y, 1-z

Figure 6 View of 2D supramolecular architecture of complex 2 constructed by C-H…π interactions
Symmetry codes: #3: -x, 1-y, 2-z

Figure 7 Three dimensional supramolecular architecture of complex 2 constructed by hydrogen bonding and C-H…π interactions
Symmetry codes: #2: x, y, -1+z; #3: -x, 1-y, 2-z

Figure 9 (a) UV-Vis spectral changes of complex 1 of H2L in methanol by the addition of Cu(OAc)2 in methanol; (b) UV-Vis spectral changes of complex 2 of H2L in methanol by the addition of Ni(OAc)2 in methanol
cH2L=25 μmol·L-1; the arrow indicates that the concentration of metal ions is gradually increasing

Figure 10 Emission spectra of H2L and its complexes 1 and 2 in methanol solution
c=25 mmol·L-1

Figure 11 Hirshfeld surfaces of H2L, complexes 1 and 2 mapped with dnorm, shape index and curvedness

Figure 12 Two dimensional fingerprint plots of H2L, complexes 1 and 2 with the major decomposition plots
Table 1. Crystal and refinement parameters for complexes 1 and 2
| Complex | 1 | 2 |
| Formula | C24H25CuN3O6 | C56H72Ni3N6O20 |
| Formula weight | 515.01 | 1 325.32 |
| Crystal system | Monoclinic | Triclinic |
| Space group | P21/c | P1 |
| a / nm | 0.930 33(3) | 1.026 80(12) |
| b / nm | 3.155 67(10) | 1.129 69(13) |
| c / nm | 0.770 51(2) | 1.385 94(14) |
| α / (°) | 78.774(9) | |
| β / (°) | 96.500(3) | 75.005(10) |
| γ / (°) | 75.672(10) | |
| V / nm3 | 2.247 5(12) | 1.489 9(13) |
| Z | 4 | 1 |
| Dc / (g·cm-3) | 1.522 | 1.477 |
| μ / mm-1 | 1.019 | 1.018 |
| F(000) | 1 068.0 | 694.0 |
| θ range / (°) | 3.321~26.019 | 3.316~26.021 |
| Index ranges | -11 ≤ h ≤ 7, -38 ≤ k ≤ 32, -9 ≤ l ≤ 8 | -10 ≤ h ≤ 12, -10 ≤ k ≤ 13, -17 ≤ l ≤ 17 |
| Reflection collected | 9 589 | 9 650 |
| Independent reflection | 4 426 | 5 855 |
| Rint | 0.027 1 | 0.044 7 |
| Completeness to θ / % | 99.66 | 99.80 |
| Data, restraint, parameter | 4 426, 0, 310 | 5 855, 28, 413 |
| GOF on F2 | 1.192 | 1.037 |
| Final R indices [I > 2σ(I)] | R=0.055 4, wR=0.102 6 | R=0.092 9, wR=0.116 7 |
| Largest diff. peak and hole / (e·nm-3) | 274 and -385 | 627 and -400 |
 下载: 导出CSV
Table 2. Selected bond distances (nm) and angles (°) for complexes 1 and 2
| 1 | |||||
| Cu1-O1 | 0.192 6(2) | Cu1-O6 | 0.189 4(2) | Cu1-N1 | 0.199 5(3) |
| Cu1-N2 | 0.194 5(3) | ||||
| O1-Cu1-O6 | 87.03(9) | O1-Cu1-N1 | 88.45(10) | O1-Cu1-N2 | 162.58(10) |
| O6-Cu1-N1 | 173.65(11) | O6-Cu1-N2 | 90.91(10) | N1-Cu1-N2 | 94.73(11) |
| 2 | |||||
| Ni1-O1 | 0.204 8(3) | Ni1-O6 | 0.202 0(3) | Ni1-O7 | 0.202 4(3) |
| Ni1-O9 | 0.208 7(3) | Ni1-N1 | 0.207 6(4) | Ni1-N2 | 0.206 7(3) |
| Ni2-O1 | 0.210 4(3) | Ni2-O6 | 0.204 4(3) | Ni2-O8 | 0.210 7(3) |
| Ni2-O1#1 | 0.210 4(3) | Ni2-O6#1 | 0.204 4(3) | Ni2-O8#1 | 0.210 7(3) |
| O1-Ni1-O6 | 79.31(11) | O1-Ni1-O7 | 91.36(11) | O1-Ni1-O9 | 91.58(11) |
| O1-Ni1-N1 | 86.94(14) | O1-Ni1-N2 | 166.48(13) | O6-Ni1-O7 | 94.41(11) |
| O6-Ni1-O9 | 88.73(11) | O6-Ni1-N1 | 165.21(15) | O6-Ni1-N2 | 87.39(14) |
| O7-Ni1-O9 | 176.05(12) | O7-Ni1-N1 | 91.31(13) | O7-Ni1-N2 | 87.19(13) |
| O9-Ni1-N1 | 86.21(13) | O9-Ni1-N2 | 90.57(12) | N1-Ni1-N2 | 106.53(16) |
| O1-Ni2-O6 | 77.49(10) | O1-Ni2-O8 | 91.28(11) | O1-Ni2-O1#1 | 180.00 |
| O1-Ni2-O6#1 | 102.51(10) | O1-Ni2-O8 | 88.72(11) | O6-Ni2-O8 | 87.74(11) |
| O1-Ni2-O6#1 | 102.51(10) | O6-Ni2-O6#1 | 180.00 | O6-Ni2-O8 | 92.26(11) |
| O8-Ni2-O8#2 | 180.00 | O1-Ni2-O6#1 | 77.49(10) | O1-Ni2-O8#2 | 91.28(11) |
| O6-Ni2-O8#2 | 87.74(11) | ||||
| Symmetry codes: #1: 1-x, 1-y, 1-z; #2: x, y, -1+z for 2. | |||||
下载: 导出CSV
Table 3. Hydrogen bonding and C-H…π interaction of complexes 1 and 2
| D-H…A | d(D-H) / nm | d(H…A) / nm | d(D…A) / nm | ∠D-H…A / (°) | |
| 1 | |||||
| C10-H10…O3 | 0.093 | 0.235 0 | 0.270 4(3) | 102 | |
| C11-H11A…O2#1 | 0.097 | 0.256 0 | 0.350 7(4) | 164 | |
| C11-H11B…O6#2 | 0.097 | 0.255 0 | 0.334 3(4) | 139 | |
| C21-H21A…Cg1#1 | 0.097 | 0.283 0 | 0.363 0(4) | 141 | |
| 2 | |||||
| C10-H10…O3#1 | 0.093 | 0.227 0 | 0.266 5(6) | 105 | |
| C12-H12A…O7#1 | 0.097 | 0.230 0 | 0.313 6(6) | 143 | |
| C16-H16…O8#1 | 0.093 | 0.255 0 | 0.324 1(5) | 132 | |
| C23-H23B…O4#2 | 0.097 | 0.256 0 | 0.333 7(6) | 137 | |
| O10-H10A…O8#2 | 0.082 | 0.203 0 | 0.274 7(5) | 146 | |
| C20-H20A…Cg2#3 | 0.096 | 0.280 0 | 0.349 1(5) | 130 | |
| Symmetry codes: #1: -1+x, y, z; #2: x, y, -1+z for 1; #1: 1-x, 1-y, 1-z; #2: x, y, -1+z; #3: -x, 1-y, 2-z for 2. Cg1 is the centroids of benzene ring C1-C2-C3-C4-C8-C9 of 1; Cg2 is the centroids of benzene ring O3-C7-C6-C5-C4-C8 of 2. | |||||
下载: 导出CSV
Table 4. Main data of IR spectra of H2L and complexes 1 and 2
| cm-1 | ||||||
| νO=H | νAr-O | νC=N | νC=O | νM-N | νM-O | |
| H2L | 3 231 | 1 286 | 1 613 | 1 731 | — | — |
| Complex 1 | — | 1 241 | 1 596 | 1 715 | 529 | 456 |
| Complex 2 | 3 443 | 1 244 | 1 595 | 1 724 | 539 | 462 |
下载: 导出CSV

 扫一扫看文章


扫一扫关注我们