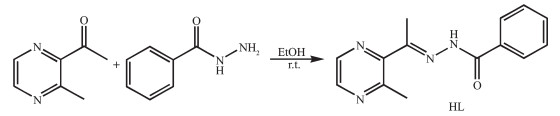
Scheme 1.
Synthetic route of HL

Syntheses, Crystal Structures and DNA-Binding Properties of Cu(Ⅱ)/Ni(Ⅱ) Complexes with Acylhydrazone Ligand Bearing Pyrazine Unit
Wan-Wan WANG , Yuan WANG , Ling ZHANG , Yu-Fei SONG , Wei-Na WU , Zhong CHEN


Schiff bases and their metal complexes have been widely used in medical fields such as anticancer, antibacterial, and antiviral drugs[1-2]. Generally, the presence of a heterocyclic ring in the synthesized Schiff bases plays a major role in extending their pharmacological properties[3]. Particularly, pyrazine-containing thiosemicarbazone has been extensively investigated as potential anticancer agents[4], because pyrazine is a vital nitrogen heterocyclic compound with various biological activities and a key structural unit for the drug design[4-6]. However, acylhydrazones bearing pyrazine unit, as their structural analogs, received much less attention[4, 7-8].
Our previous work has showed that 2-acetopyrazine benzoylacylhydrazone could form stable complexes with transition metal ions, such as Cu(Ⅱ), Ni(Ⅱ) and Zn(Ⅱ)[5]. It is noted that the biological activities of acylhydrazones often show a high depend-ence on their substituent[9]. In this regard, we chose 2-aceto-3-methylpyrazine as the starting material for the formation of benzoylacylhydrazone ligand HL (Scheme 1). In this paper, the structures and DNA-binding properties of its Ni(Ⅱ)/Cu(Ⅱ) complexes have been discussed in detail.
Solvents and starting materials for synthesis were purchased commercially and used as received. Elemental analysis was carried out on an Elemental Vario EL analyzer. The IR spectra (ν=4 000~400 cm-1) were determined by the KBr pressed disc method on a Bruker V70 FT-IR spectrophotometer. 1H NMR spectra of HL was acquired with Bruker AV400 NMR instru-ment in DMSO-d6 solution with TMS as internal standard. The UV spectra were recorded on a Purkinje General TU-1800 spectrophotometer. The interactions between the complexes and ct-DNA are measured by using literature method[5] via emission spectra on a Varian CARY Eclipse spectrophotometer.
As shown in Scheme 1, the ligand HL was produced by condensation of 2-aceto-3-methylpyrazine (1.36 g, 0.01 mol) and benzoylhydrazide (1.36 g, 0.01 mol) in ethanol solution (30 mL) with continuous stirring at room temperature for 3 h. Yield: 2.08 g (82%). Elemental analysis Calcd. for C14H14N4O(%): C: 66.13; H: 5.55; N: 22.03. Found(%): C: 66.28; H: 5.44; N: 21.99. FT-IR (cm-1): ν(C=O) 1 685, ν(C=N)imine 1 582, ν(C=N)pyrazine 1 542. 1H NMR (400 MHz, DMSO-d6): δ 10.97 (1H, s, NH), 8.52 (2H, s, pyrazine-H), 7.91 (2H) and 7.53~7.60 (3H) for phenyl-H, 2.80 (3H, s, CH3), 2.43 (3H, s, CH3).
The complexes 1 and 2 were generated by reaction of the ligand HL (5 mmol) with equimolar of NiSO4 or CuSO4 in methanol solution (10 mL) at room temperature for 1 h. Crystals suitable for X-ray diffraction analysis were obtained by evaporating the corresponding reaction solutions at room temperature.
1: Brown blocks. Anal. Calcd. for C31H39N8O7S0.5Ni(%): C: 52.41; H: 5.53; N: 15.77. Found(%): C: 52.30; H: 5.64; N: 15.54. FT-IR (cm-1): ν(C=O) 1 654, ν(C=N) 1 562, ν(C=N)pyrazine 1 532.
2: Green blocks. Anal. Calcd. for C29.5H32N8O7.5 SCu2(%): C: 45.55; H: 4.15; N: 14.41. Found (%): C: 45.41; H: 4.28; N: 14.32. FT-IR (cm-1): ν(C=O) 1 652, ν(C=N) 1 560, ν(C=N)pyrazine 1 535.
The X-ray diffraction measurement for 1 (size: 0.20 mm×0.20 mm×0.20 mm) and 2 (size: 0.15 mm×0.14 mm×0.12 mm) were performed on a Bruker SMART APEX Ⅱ CCD diffractometer equipped with a graphite monochromatized Mo Kα radiation (λ=0.071 073 nm) using φ-ω scan mode. Semi-empirical absorption correction was applied to the intensity data using the SADABS program[10]. The structures were solved by direct methods and refined by full matrix least-square on F2 using the SHELXTL-97 program[11]. All non-hydrogen atoms were refined anisotropically. The H atoms of disordered methanol molecule (occupancy value of each atom being 0.5) in 2 were not added. All the other H atoms were positioned geometrically and refined using a riding model. Details of the crystal parameters, data collection and refinements for 1 and 2 are summarized in Table 1.

 下载:
导出CSV
下载:
导出CSV
| 1 | 2 | |
| Empirical formula | C31H39N8O7S0.5Ni | C29.5H32N8O7.5SCu2 |
| Formula weight | 710.44 | 777.77 |
| T / K | 296(2) | 293(2) |
| Crystal system | Monoclinic | Triclinic |
| Space group | C2/c | P1 |
| a / nm | 2.066 0(3) | 1.070 2(5) |
| b / nm | 1.451 20(17) | 1.172 3(6) |
| c / nm | 2.273 1(3) | 1.420 9(6) |
| α / (°) | 71.701(8) | |
| β / (°) | 104.518(2) | 73.328(7) |
| γ / (°) | 72.022(7) | |
| V / nm3 | 6.597 6(15) | 1.573 8(13) |
| Z | 8 | 2 |
| Dc / (g·cm-3) | 1.431 | 1.641 |
| Absorption coefficient / mm-1 | 0.679 | 1.481 |
| F(000) | 2 984 | 798.0 |
| Reflection collected | 16 533 | 8 031 |
| Unique reflection | 5 802 | 5 486 |
| Rint | 0.026 0 | 0.056 2 |
| Goodness-of-fit (GOF) on F2 | 1.037 | 1.070 |
| R indices [I > 2σ(I)] | R1=0.046 9, wR2=0.130 1 | R1=0.050 1, wR2=0.139 8 |
| R indices (all data) | R1=0.055 6, wR2=0.137 7 | R1=0.066 9, wR2=0.151 0 |
CCDC 1876785: 1; 1876789: 2.
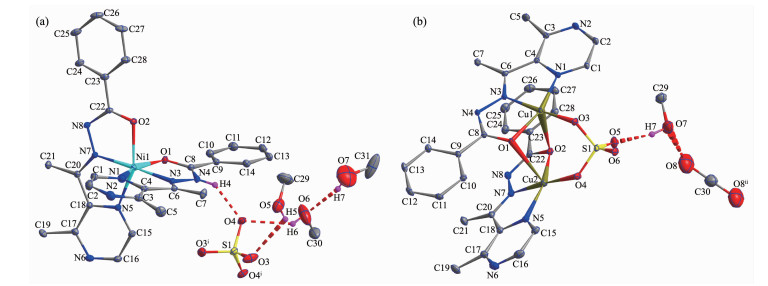
Diamond drawings of complexes 1 and 2 are shown in Fig. 1. Selected bond distances and angles are listed in Table 2. As shown in Fig. 1a, the asymm-etric unit of 1 contains one discrete cationic Ni(Ⅱ) ion, a half of sulfate anions for charge balance, and three lattice methanol molecules. The center Ni(Ⅱ) ion with a distorted octahedron geometry is coordinated by two acylhydrazones with [ONN] donor set. It should be noted that one of the acylhydrazone ligands is neutral, since the bond length of C8-O1 (0.123 3(3) nm) is clearly shorter than that of C22-O2 (0.126 5(4) nm). In the solid state, intermolecular N-H…O (N4-H4…O4, with D…A distance being 0.270 0(3) nm, D-H…A angle being 139.6°) and O-H…O (O7-H7…O6, with D…A distance being 0.278 0(12) nm, D-H…A angle being 159.6°; O5-H5…O3, with D…A distance being 0.296 1(8) nm, D-H…A angle being 118.8°; O6-H6…O4, with D…A distance being 0.281 5(7) nm, D-H…A angle being 125.0°) hydrogen bonds are helpful to stabilize the crystal structure (Fig. 1a).
Hydrogen bonds shown in dashed line; H atoms of C-H bonds are omitted for clarity; Symmetry codes: i-x, y, 1.5-z; ii 3-x, -y, -z
下载:
导出CSV
| 1 | ||||||
| Ni1-N1 | 0.207 5(3) | Ni1-N3 | 0.199 0(2) | Ni1-O1 | 0.209 9(2) | |
| Ni1-N5 | 0.207 4(2) | Ni1-N7 | 0.195 2(2) | Ni1-O2 | 0.205 3(2) | |
| N3-Ni1-N1 | 76.53(9) | N3-Ni1-N5 | 100.20(10) | N5-Ni1-N1 | 94.21(9) | |
| N7-Ni1-N1 | 101.88(10) | N7-Ni1-N3 | 177.60(9) | N7-Ni1-N5 | 78.06(9) | |
| N1-Ni1-O1 | 153.44(9) | N3-Ni1-O1 | 77.14(8) | N3-Ni1-O2 | 103.90(9) | |
| N5-Ni1-O1 | 93.79(9) | N7-Ni1-O1 | 104.54(9) | N7-Ni1-O2 | 77.94(9) | |
| O2-Ni1-N1 | 94.18(9) | O2-Ni1-N5 | 155.72(9) | O2-Ni1-O1 | 88.76(8) | |
| 2 | ||||||
| Cu1-N1 | 0.198 7(3) | Cu1-N3 | 0.190 3(3) | Cu2-N5 | 0.199 0(4) | |
| Cu2-N7 | 0.189 7(4) | Cu1-O1 | 0.195 6(3) | Cu1-O2 | 0.255 8(3) | |
| Cu1-O3 | 0.189 4(3) | Cu2-O1 | 0.258 3(3) | Cu2-O2 | 0.195 4(3) | |
| Cu2-O4 | 0.188 3(3) | |||||
| N1-Cu1-O2 | 97.19(12) | N3-Cu1-N1 | 79.85(14) | N5-Cu2-O1 | 96.39(12) | |
| N3-Cu1-O1 | 80.86(12) | N3-Cu1-O2 | 91.74(12) | N7-Cu2-O2 | 80.30(14) | |
| N7-Cu2-N5 | 79.98(16) | N7-Cu2-O1 | 91.64(13) | O2-Cu2-N5 | 160.26(14) | |
| O1-Cu1-N1 | 160.70(13) | O1-Cu1-O2 | 84.03(11) | O3-Cu1-N3 | 171.81(14) | |
| O2-Cu2-O1 | 83.39(11) | O3-Cu1-N1 | 101.01(14) | O4-Cu2-N5 | 97.72(15) | |
| O3-Cu1-O1 | 98.00(13) | O3-Cu1-O2 | 96.21(12) | O4-Cu2-O2 | 102.01(14) | |
| O4-Cu2-N7 | 175.98(14) | O4-Cu2-O1 | 91.89(13) | |||
Complex 2 crystallizes in the triclinic space group P1 with one discrete dimeric Cu(Ⅱ) unit in the unit cell. As illustrated in Fig. 1b, two Cu(Ⅱ) ions of the dimer are separated by 0.317 4 nm and doubly bridged by two O atoms from two acylhydrazone ligands to form a nearly planar four-membered Cu2O2 core (r.m.s. deviation: 0.030 15 nm). Each of the Cu(Ⅱ) ions is also coordinated by two N atoms from one L- ligand (bond length of C8-O1 and C22-O2 are 0.128 8(5) and 0.129 2(5) nm, respectively) and one O atom from the η2-SO42- at the outer axial sites, giving a distorted square pyramid coordination geometry (τ=0.185 and 0.262 for Cu1 and Cu2, respe-ctively)[12]. The O-H…O (O7-H7…O5, with D…A distance being 0.272 4(7) nm, D-H…A angle being 168.3°; O8…O7, with D…A distance being 0.257 4 nm) hydrogen bonds are also present in the crystal (Fig. 1b).
The FT-IR spectral regions for both complexes were more or less similar due to the similar coor-dination modes of the ligands. The ν(C=O), ν(C=N)imine and ν(C=N)pyrazine bands were at 1 663, 1 578 and 1 559 cm-1, respectively. They shifted to lower frequency values in the IR spectra of complexes, indicating that the carbonyl O, imine N and pyrazine N atoms take part in the coordination[5]. It is in accordance with the crystal structure study.
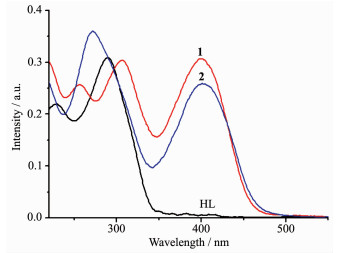
The UV spectra of the ligand HL, 1 and 2 in CH3OH solution (10 μmol·L-1) were measured at room temperature (Fig. 2). The spectra of HL featured two main band at around 230 nm (ε=10 950 L·mol-1·cm-1) and 290 nm (ε=15 423 L·mol-1·cm-1), which could be assigned to characteristic π-π* transition of pyrazine and imine units, respectively[13]. In the spectrum of complex 1, these two bonds red-shifted to 256 nm (ε=12 832 L·mol-1·cm-1) and 306 nm (ε=15 191 L·mol-1 ·cm-1), respectively. By contrast, two bands of the ligand were merged into one at 271 nm (ε=17 968 L·mol-1·cm-1) in the spectrum of complex 2. Moreover, new peaks at 400 nm (ε=15 314 L·mol-1·cm-1) and 401 nm (ε=12 955 L·mol-1·cm-1) were observed in the spectra of complexes 1 and 2, respectively, primarily due to the ligand-to-metal charge transfer (LMCT)[14]. This indicates that an extended conjugation forms in anionic ligand after complexation.
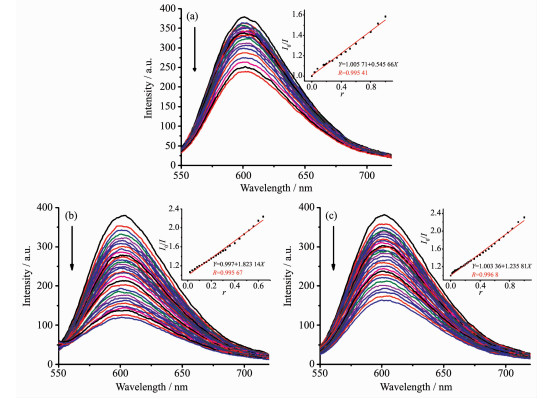
It is well known that EB can intercalate nonspecifically into DNA, which causes it to fluoresce strongly. Competitive binding of other drugs to DNA and EB will result in displacement of bound EB and a decrease in the fluorescence intensity[14-15]. The effects of the ligand and complexes on the fluorescence spectra of EB-DNA system are presented in Fig. 3. The fluorescence intensities of EB bound to ct-DNA at about 600 nm showed remarkable decreasing trends with the increasing concentration of the tested compounds, indicating that some EB molecules are released into solution after the exchange with the compounds. The quenching of EB bound to DNA by the compounds is in agreement with the linear Stern-Volmer equation: I0/I=1+Ksqr[14-15], where I0 and I represent the fluorescence intensities in the absence and presence of quencher, respectively, Ksq is the linear Stern-Volmer quenching constant, r is the ratio of the concentration of quencher and DNA. In the quenching plots of I0/I versus r, Ksq values are given by the slopes. The Ksq values were 0.545, 1.823 and 1.236 for the ligand HL, complexes 1 and 2, respe-ctively. The results indicate that interaction of the complexes to DNA is stronger than that of the ligand HL, because the complexes have higher rigidity to bind the base pairs along DNA, thus increasing their binding abilities.
Arrow shows the fluorescence intensities change of EB-DNA system upon increasing tested compound concentration; Inset: plot of I0/I versus r
Two complexes with a pyrazine-containing benzoylhydrazone ligand were prepared and chara-cterized by single-crystal X-ray crystallography. In complex 1, the center Ni(Ⅱ) ion is surrounded by two acylhydrazones with [ONN] donor set, giving a distorted octahedron geometry. By contrast, complex 2 contains one discrete dimeric Cu(Ⅱ) unit in the unit cell. Moreover, the fluorescence spectra indicated that the interaction of the complexes to DNA is stronger than that of the ligand HL. Further research is needed to better determine the relationship between structures and activities.
Sönmez M, Sogukomerogullari H G, Öztemel F, et al. Med. Chem. Res., 2014, 23:3451-3457 doi: 10.1007/s00044-014-0925-0
Hameed A, Al-Rashida M, Uroos M, et al. Expert Opin. Ther. Pat., 2017, 27:1-17 doi: 10.1080/13543776.2017.1262350
Shanty A A, Philip J E, Sneha E J, et al. Bioorg. Med. Chem., 2016, 70:67-73
Castiñeiras A, García-Santos I, Nogueiras S, et al. J. Mol. Struct., 2014, 1074:1-18 doi: 10.1016/j.molstruc.2014.05.042
侯旭锋, 赵晓雷, 张露, 等.无机化学学报, 2018, 34(1):201-205 http://www.wjhxxb.cn/wjhxxbcn/ch/reader/view_abstract.aspx?flag=1&file_no=20180124&journal_id=wjhxxbcnHOU Xu-Feng, ZHAO Xiao-Lei, ZHANG Lu, et al. Chinese J. Inorg. Chem., 2018, 34(1):201-205 http://www.wjhxxb.cn/wjhxxbcn/ch/reader/view_abstract.aspx?flag=1&file_no=20180124&journal_id=wjhxxbcn
Olczak A, Gówka M L, Goka J, et al. J. Mol. Struct., 2007, 830:171-175 doi: 10.1016/j.molstruc.2006.07.011
Popov L D, Levchenkov S I, Shcherbakov I N, et al. Russ. J. Coord. Chem., 2016, 42:151-156 doi: 10.1134/S1070328416020068
Bi X, Sun J, Liu W L, et al. J. Inclusion Phenom. Macrocyclic Chem., 2014, 80:235-242 doi: 10.1007/s10847-014-0382-x
Meira C S, Filho J M D S, Sousa C C, et al. Bioorg. Med. Chem., 2018, 26:1971-1985 doi: 10.1016/j.bmc.2018.02.047
Sheldrick G M. SADABS, University of Göttingen, Germany, 1996.
Sheldrick G M. SHELX-97, Program for the Solution and the Refinement of Crystal Structures, University of Göttingen, Germany, 1997.
Golovnev N N, Molokeev M S, Sterkhova I V, et al. Inorg. Chem. Commun., 2018, 97:88-92 doi: 10.1016/j.inoche.2018.09.011
Kubo T, Shimizu A, Sakamoto M, et al. Angew. Chem. Int. Ed., 2010, 117:6722-6726
毛盼东, 赵晓雷, 邵志鹏, 等.无机化学学报, 2017, 33(5):890-896 http://www.wjhxxb.cn/wjhxxbcn/ch/reader/view_abstract.aspx?flag=1&file_no=20170522&journal_id=wjhxxbcnMAO Pan-dong, ZHAO Xiao-Lei, SHAO Zhi-Peng, et al. Chinese J. Inorg. Chem., 2017, 33(5):890-896 http://www.wjhxxb.cn/wjhxxbcn/ch/reader/view_abstract.aspx?flag=1&file_no=20170522&journal_id=wjhxxbcn
林龙, 李先宏, 张波, 等.无机化学学报, 2017, 33(1):143-148 http://www.wjhxxb.cn/wjhxxbcn/ch/reader/view_abstract.aspx?flag=1&file_no=20170117&journal_id=wjhxxbcnLIN Long, LI Xian-Hong, ZHANG Bo, et al. Chinese J. Inorg. Chem., 2017, 33(1):143-148 http://www.wjhxxb.cn/wjhxxbcn/ch/reader/view_abstract.aspx?flag=1&file_no=20170117&journal_id=wjhxxbcn

Figure 1 Diamond drawings of 1 (a) and 2 (b) with 10% thermal ellipsoids
Hydrogen bonds shown in dashed line; H atoms of C-H bonds are omitted for clarity; Symmetry codes: i-x, y, 1.5-z; ii 3-x, -y, -z

Figure 2 UV spectra of the ligand HL, complexes 1 and 2 in CH3OH solution at room temperature

Figure 3 Emission spectra of EB-DNA system in the absence and presence of ligand HL (a), complexes 1 (b) and 2 (c)
Arrow shows the fluorescence intensities change of EB-DNA system upon increasing tested compound concentration; Inset: plot of I0/I versus r
Table 1. Crystal data and structure refinement for complexes 1 and 2
| 1 | 2 | |
| Empirical formula | C31H39N8O7S0.5Ni | C29.5H32N8O7.5SCu2 |
| Formula weight | 710.44 | 777.77 |
| T / K | 296(2) | 293(2) |
| Crystal system | Monoclinic | Triclinic |
| Space group | C2/c | P1 |
| a / nm | 2.066 0(3) | 1.070 2(5) |
| b / nm | 1.451 20(17) | 1.172 3(6) |
| c / nm | 2.273 1(3) | 1.420 9(6) |
| α / (°) | 71.701(8) | |
| β / (°) | 104.518(2) | 73.328(7) |
| γ / (°) | 72.022(7) | |
| V / nm3 | 6.597 6(15) | 1.573 8(13) |
| Z | 8 | 2 |
| Dc / (g·cm-3) | 1.431 | 1.641 |
| Absorption coefficient / mm-1 | 0.679 | 1.481 |
| F(000) | 2 984 | 798.0 |
| Reflection collected | 16 533 | 8 031 |
| Unique reflection | 5 802 | 5 486 |
| Rint | 0.026 0 | 0.056 2 |
| Goodness-of-fit (GOF) on F2 | 1.037 | 1.070 |
| R indices [I > 2σ(I)] | R1=0.046 9, wR2=0.130 1 | R1=0.050 1, wR2=0.139 8 |
| R indices (all data) | R1=0.055 6, wR2=0.137 7 | R1=0.066 9, wR2=0.151 0 |
 下载: 导出CSV
Table 2. Selected bond lengths (nm) and angles (°) in complexes 1 and 2
| 1 | ||||||
| Ni1-N1 | 0.207 5(3) | Ni1-N3 | 0.199 0(2) | Ni1-O1 | 0.209 9(2) | |
| Ni1-N5 | 0.207 4(2) | Ni1-N7 | 0.195 2(2) | Ni1-O2 | 0.205 3(2) | |
| N3-Ni1-N1 | 76.53(9) | N3-Ni1-N5 | 100.20(10) | N5-Ni1-N1 | 94.21(9) | |
| N7-Ni1-N1 | 101.88(10) | N7-Ni1-N3 | 177.60(9) | N7-Ni1-N5 | 78.06(9) | |
| N1-Ni1-O1 | 153.44(9) | N3-Ni1-O1 | 77.14(8) | N3-Ni1-O2 | 103.90(9) | |
| N5-Ni1-O1 | 93.79(9) | N7-Ni1-O1 | 104.54(9) | N7-Ni1-O2 | 77.94(9) | |
| O2-Ni1-N1 | 94.18(9) | O2-Ni1-N5 | 155.72(9) | O2-Ni1-O1 | 88.76(8) | |
| 2 | ||||||
| Cu1-N1 | 0.198 7(3) | Cu1-N3 | 0.190 3(3) | Cu2-N5 | 0.199 0(4) | |
| Cu2-N7 | 0.189 7(4) | Cu1-O1 | 0.195 6(3) | Cu1-O2 | 0.255 8(3) | |
| Cu1-O3 | 0.189 4(3) | Cu2-O1 | 0.258 3(3) | Cu2-O2 | 0.195 4(3) | |
| Cu2-O4 | 0.188 3(3) | |||||
| N1-Cu1-O2 | 97.19(12) | N3-Cu1-N1 | 79.85(14) | N5-Cu2-O1 | 96.39(12) | |
| N3-Cu1-O1 | 80.86(12) | N3-Cu1-O2 | 91.74(12) | N7-Cu2-O2 | 80.30(14) | |
| N7-Cu2-N5 | 79.98(16) | N7-Cu2-O1 | 91.64(13) | O2-Cu2-N5 | 160.26(14) | |
| O1-Cu1-N1 | 160.70(13) | O1-Cu1-O2 | 84.03(11) | O3-Cu1-N3 | 171.81(14) | |
| O2-Cu2-O1 | 83.39(11) | O3-Cu1-N1 | 101.01(14) | O4-Cu2-N5 | 97.72(15) | |
| O3-Cu1-O1 | 98.00(13) | O3-Cu1-O2 | 96.21(12) | O4-Cu2-O2 | 102.01(14) | |
| O4-Cu2-N7 | 175.98(14) | O4-Cu2-O1 | 91.89(13) | |||
下载: 导出CSV

 扫一扫看文章


扫一扫关注我们
