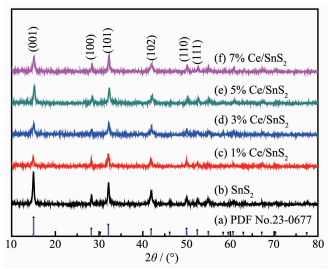
Figure 1.
XRD patterns of undoped SnS2 and Ce-doped SnS2

One-Pot Synthesis of Rose-like Ce-Doped SnS2 with Enhanced Visible-Light Photocatalytic Property for Reduction of Cr(Ⅵ)
Guo-Hui LI , Yuan-Yuan SUN , Hua-Long XING , Jian-Cong ZHENG , Chen-Chen LIN , Zhen-Fan SUN


Cr(Ⅵ) is a priority contaminant in the wastewaters arising from mining, paint making, electroplating and chromate manufacturing[1]. Nowadays the pollution of Cr(Ⅵ) which seriously exerts passive effects on human life has been a severe social issue in many countries due to its high mobility and strong toxicity in water[2-3]. A variety of methods such as chemical reduction, adsorption, membrane separation, bacterial degradation and photocatalytic reduction have been researched in order to dispose Cr(Ⅵ)[4-7]. Among the above technologies, the chemical method converting Cr(Ⅵ) into Cr(Ⅲ) in wastewater has been widely used because in neutral or alkaline solutions Cr(Ⅲ) is precipitated as Cr(OH)3[8]. However, it have proved that there are two inevitable drawbacks. Firstly, it requires lots of reductants that are not cost-effective[2]. What′s more, the latest research has proved that soluble Cr(Ⅲ) still has high toxicity to some microor-ganisms and aquatic organisms[9-10] and may be oxidized to Cr(Ⅵ) again by some kind of bacteria[11]. Above all, in order to maintain the ecological balance and consider cost savings, it is indispensable and urgent to develop new materials that can both remove Cr(Ⅵ) and Cr(Ⅲ) efficiently.
Recently, photocatalytic reduction of Cr(Ⅵ) has attracted more attention in green chemistry technology on account of its low cost, reusability, use of clean solar energy and no need of any hazardous chemicals[12-13]. Several photocatalysts have been put into use in dealing with environmental pollution, such as TiO2[14], SnO2[15], CdS[16], CuO[17], WO3[18], ZnO[19], CdO[20], Fe2O3[21], C3N4[22], BiVO4[23], BiOI[24], Bi2S3[25] and SnS2[26]. However, the photocatalytic efficiency, limited by light absorption ability and separation efficiency of photogenerated electron-hole pairs, is a primary drawback of semi-conductor photocatalysts[27]. Among those photocata-lysts, it has been proved that SnS2 can reduce Cr(Ⅵ) with high efficiency due to its wider light absorption and adsorb Cr(Ⅲ) ability[28]. In this case, separation of photogenerated electrons and holes is vital factor to improve the photocatalytic activity of SnS2. In addition, modifying the band structure of photocatalyst by doping elements is an effective approach to enhance separation of photoinduced electrons and holes. At present a few researches have been reported about doping SnS2 with In, Ce, Zn, Cu and C as photo-catalysts[29-33]. Among them, only Kiruthigaa et al. investigated the Ce doped SnS2[29]. It reported the synthesis, structural and optical properties of Ce-doped SnS2 nanoflakes and measured photocatalytic ability to degrade reactive red 120 dye[29]. However, in this previous paper Ce-doped SnS2 was synthesized by solid state reaction requiring higher temperature and longer heating/cooling times. The photocatalytic process was driven by UV light and the work did not evaluate photocatalytic reduction ability of Ce-doped SnS2. Hence, it is significant to develop a new method to synthesize Ce-doped SnS2 nanomaterials with low cost and study its photocatalytic reduction ability under the visible-light irradiation.
In this paper, Ce-doped SnS2 was synthesized successfully via a facile hydrothermal method and investigated in terms of microstructure, morphology, light absorption and the electrochemical properties. Photocatalytic activities were researched by the reduction of Cr(Ⅵ) under visible-light irradiation.
All reagents used in the experiments were of analytical grade and used as received without further purification. The Ce-doped SnS2 was prepared simply by a direct hydrothermal method. In a typical synthetic process, 5 mmol of citric acid (C6H8O7) and 1 mmol of tin(Ⅳ) chloride pentahydrate (SnCl4·5H2O) were dissolved into 30 mL of deionized water. Afterward, 8 mmol of thiourea (CH4N2S) was added into the above solution. Then, different molar ratio of cerium(Ⅲ) nitrate hexahydrate (Ce(NO3)3·6H2O) was dissolved, and the solution was exposed to magnetic stirring treatment for 30 min. Finally, the mixture was transferred to 50 mL Teflon lined stainless steel autoclaves for the reaction at 180 ℃ for 20 h. The sample was then cooled to room temperature naturally and washed with deionized water and ethanol for several times by centrifugation at 7 000 r·min-1 for 5 min. The collected yellow product was dried at 80 ℃ for 12 h in a dryer at last. The similar procedures were carried out to prepare the SnS2 with different molar ratio of Ce as 0%, 1%, 3%, 5% and 7%. The as-synthesized samples were denoted as x% Ce/SnS2, where x% refers to the molar ratio of Ce to SnS2.
The phase and composition of as-prepared samples were examined by an Rigaku Ultima Ⅳ XRD equipped with Cu Kα radiation (λ=0.154 18 nm) at a scan rate of 10°·min-1 with 2θ=10°~80°. The operating voltage was 40 kV and the current was 40 mA. The morphology of the samples was performed on JSM-7100F field emission scanning electron microscopy (FESEM), and the operating voltage was 5 kV. The OXFORD INCA X-act EDS equipped on FESEM was used for chemical analysis and elemental mapping. The N2 adsorption-desorption isotherms were performed to measure pore size distribution and the Brunauer-Emmett-Teller (BET) surface area of as-prepared samples by a Quantachrome Autosorb. UV-Vis DRS of the sample were recorded with a UV-Vis spectro-photometer (UV-1950, Beijing Purkinje General Instrument Co. Ltd., China). The chemical state of Cr after photocatalytic reaction was determined by AXIS SUPRA X-ray photoelectron spectroscopy (XPS) with Al Kα X-ray source (λ=0.833 89 nm).
Electrochemical measurements were carried out on a CHI660D electrochemical workstation by a standard three-electrode system with a saturated calomel electrode (SCE) as reference electrode, a platinum wire as counter electrode, and a working electrode. The working electrodes were processed by coating method. Briefly, 10 mg of photocatalyst was suspended in the slurry of the combination of 5% (w/w) nafion solution and anhydrous ethanol with volume radio of 0.25 which was then dropped onto a 2.5 cm×1.5 cm fluorine-tin oxide (FTO) glass electrode with a sheet resistance of 15 Ω. Afterwards, the films were dried under ambient conditions. The electrochemical impedance spectroscopies (EIS) were measured at the open circuit potential. The Mott-Schottky measure-ments were executed at fixed frequencies of 500 and 1 000 Hz with 5 mV amplitude. And the flat band potentials (Vfb) were obtained from Mott-Schottky plots. Before and during all measurements, the electrolyte (0.1 mol·L-1 Na2SO4) was purged with N2. Each experiment was repeated three times to guarantee the accuracy of date acquisition. The current-time curve tests were conducted by applying a potential (+0.5 V vs SCE) and extra light source to the working electrode.
The photocatalytic activities of as-prepared Ce-doped SnS2 and pure SnS2 were carried out by the photocatalytic reduction of Cr(Ⅵ). Cr(Ⅵ) mainly exists in the form of Cr2O72- in wastewater[10], so potassium dichromate solution is selected to imitate aqueous Cr(Ⅵ). Typically, 300 mg photocatalyst was added into 100 mL of 40 mg·L-1 K2Cr2O7 aqueous solution adjusted pH=3 with HCOOH in a customized photocatalytic reactor. Then, the mixed suspension was magnetically stirred in the dark for 1 h to reach adsorption and desorption equilibrium. The suspension was irradiated by a 300 W Xe lamp equipped with a cut-off filter (λ > 420 nm) under magnetic stirring, and the distance from the light source to the reactor was about 10 cm. During illumination, at certain time intervals, 5 mL of suspension was taken from the reactor and centrifuged to remove the photocatalyst. The Cr(Ⅵ) content variation was evaluated using a UV-Vis spectroscopy (UV-1950, Beijing Purkinje General Instrument Co. Ltd., China) via a 1, 5-diphenylcarbazide method by testing the absorbance at 540 nm[34]. The reduction efficiency of Cr(Ⅵ) was calculated by C/C0, where C0 is the initial Cr(Ⅵ) concentration and C is the actual Cr(Ⅵ) concen-tration.
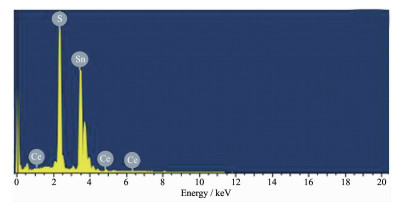
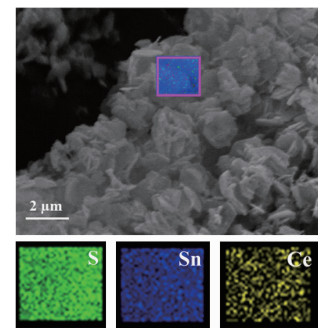
The XRD patterns of undoped SnS2 and Ce-doped SnS2 are displayed in Fig. 1. The patterns of SnS2 and Ce/SnS2 match well with that of berndtite-2T (PDF No.23-0677) without any other phases formed. It indicates that the Ce doping had not damaged the crystal structure of SnS2. Furthermore, the chara-cteristic diffraction peaks of undoped SnS2 were sharper and stronger than that of Ce-doped SnS2, which confirmed that Ce doping was effective and decreased crystallite size of SnS2. To further research the surface structure of the composites, the EDS spectrum of 5% Ce/SnS2 is shown in Fig. 2. It confirms the presence of Ce elements in the Ce/SnS2 products. The calculated atomic ratio of Sn to S is 1:1.63 for SnS2 and 1:1.71 for 5% Ce/SnS2, respectively, which implies the possibility that some Sn ions may be replaced by Ce ions in Ce doped SnS2 samples. The elemental mappings of 5% Ce/SnS2 was shown in Fig. 3. The results clearly revealed the presence and uniform distribution of Ce in 5% Ce/SnS2.
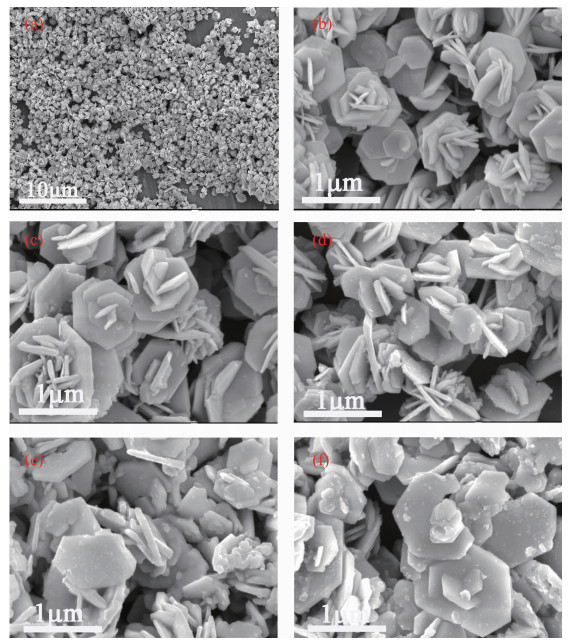
The morphology of the as-prepared products was investigated by SEM as shown in Fig. 4(a~f). The images (Fig. 4(a~b)) exhibit the undoped SnS2 poss-essing rose-like structures with an average size of 900 nm. Each uniform rose-like structure was composed of hexagonal platelets with smooth surfaces. Scheme 1 displays the formation process of the rose-like structure of SnS2. From the Scheme 1, it can be observed that the SnS2 grow up based on screw growth theory[35]. However, with the increasing of Ce-doped contents rose-like structures of SnS2 were gradually destroyed, which was probably attributed to that Ce doping causes lattice distortion and restrains the spiral growth. Moreover, the effects of Ce doping on surface structure of SnS2 were investigated and the specific surface areas of undoped SnS2 and Ce-doped SnS2 were listed in Table 1. It reveals that the specific surface area of SnS2 increased with varied Ce contents from 0% to 5%, while decreased from 5% to 7%. The enlargement of specific surface area can generate more active site, and further enhance the photocatalytic efficiency of SnS2.

 下载:
导出CSV
下载:
导出CSV
| Samples | Specific surface area / (m2·g-1) |
| SnS2 | 18 |
| 1% Ce/SnS2 | 24 |
| 3% Ce/SnS2 | 39 |
| 5% Ce/SnS2 | 44 |
| 7% Ce/SnS2 | 36 |
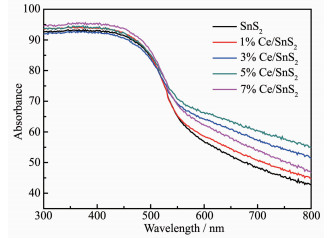
As well-known, the optical absorption property which is related to the electronic structure feature plays a significant role in photocatalytic performance. The optical absorption properties of undoped SnS2 and Ce-doped SnS2 powders were examined by UV-Vis DRS as shown in Fig. 5. It could be observed that undoped SnS2 and Ce-doped SnS2 all exhibited broad response spectrum in the visible light region, which implied the possibility of reduction of Cr(Ⅵ) under visible-light irradiation. Furthermore, it reveals that Ce-doped SnS2 exhibited enhanced absorption in visible-light region due to the fact that Ce doping affects the electronic structure of SnS2 leading to the stronger absorption. The band gap energy (Eg) of the direct band gap semiconductors material could be calculated based on the following equation[36]:
|
$ \alpha h\nu = B{\left( {h\nu - {E_{\rm{g}}}} \right)^{1/2}} $ |
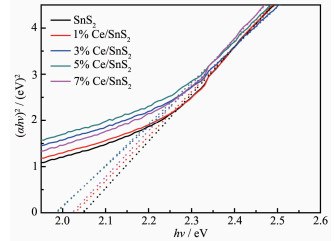
where α, h, ν and B are absorption coefficient, planck constant, light frequency and a constant related to the material, respectively. The curves of (αhν)2 versus hν for undoped and Ce-doped SnS2 are plotted in Fig. 6. The values of Eg are determined by extrapolating the linear portion of the curves to (αhν)2=0. The Eg values of SnS2, 1% Ce/SnS2, 3% Ce/SnS2, 5% Ce/SnS2 and 7% Ce/SnS2 are estimated to be 2.05, 2.03, 1.98, 1.98 and 2.02 eV, respectively. The Eg of undoped SnS2 is smaller than that of previous reports[37], which is more beneficial to produce photogenerated carriers. Moreover, it is observed that the Eg values of Ce-doped SnS2 decreased slightly with Ce-doped contents from 0% to 3%, while increased with Ce-doped contents from 5% to 7%, indicating that the change of Eg values is not homogeneous with increasing Ce doping concentration, most probably due to a combination of several contributions, such as substitution of Ce3+ ions, Sn4+ vacancies, distortion of the crystal lattice and microstructural defects[29].
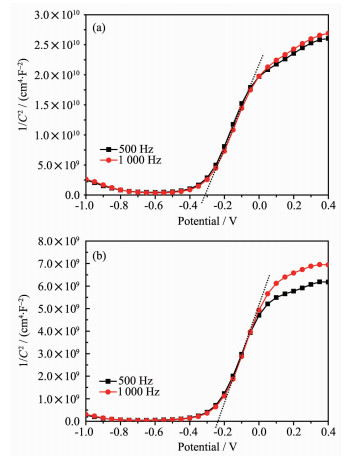
In order to calculate the potential of the photo-induced electrons in the sample, the impedance spectrum of undoped SnS2 and 5% Ce/SnS2 was measured and plotted based on Mott-Schottky principle as shown in Fig. 7. The results reveal that the flat band potential of undoped SnS2 and 5% Ce/SnS2 was -0.32 V (-0.08 V vs NHE) (Fig. 7a) and -0.25 V (-0.01 V vs NHE) (Fig. 7b), respectively. That is to say, the conduction band potentials of undoped SnS2 and 5% Ce/SnS2 samples are approximately equal to -0.08 V (vs NHE) and -0.01 V (vs NHE), respectively, given that it has been well accepted that the flat band potential is regarded as the conduction band potential. Because the potentials of the photo-induced carriers are approximately equal to that of the energy bands which they reside in[38], the potentials of the photo-induced electrons of undoped SnS2 and 5% Ce/SnS2 samples were about -0.08 V (vs NHE) and -0.01 V (vs NHE), respectively, which was far lower than the reduction potential of K2Cr2O7 (1.36 V vs NHE, in acid solution), indicating that it likely played a part in photocatalytic reduction of aqueous Cr(Ⅵ) under visible-light irradiation. Meanwhile, according to band gap energies of SnS2 and 5% Ce/SnS2 calculated by DRS, the valence band potentials of undoped SnS2 and 5% Ce/SnS2 were both about 1.97 V (vs NHE), that means Ce doping did not change the potential of photo-generated holes. From the above, it can be testified that Ce doping resulted in the appearance of doping energy level at the bottom of the conduction band, and further causes the conduction band potentials of 5% Ce/SnS2 is lower than that of SnS2. On the basis of conduction band potentials and band gap energy, the energy band structures of undoped SnS2 and 5% Ce/SnS2 are exhibited in Fig. 8.
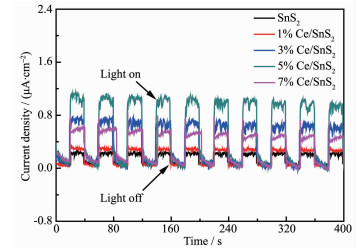
In order to prove that the induced electrons participate in photoreduction of aqueous Cr(Ⅵ), the current-time curve of the undoped SnS2 and Ce-doped SnS2 was recorded under lamp irradiation with 20 s on/off cycles as shown in Fig. 9. When the lamp was turned on, the current density of undoped SnS2 and Ce-doped SnS2 enlarged to a maximum point which was much higher than the current density at the situation that the lamp was turned off. This showed the excellent ability of as-made samples responding to visible-light and transferring the photo-induced electrons[39]. And it is observed that the visible-light response of 5% Ce/SnS2 was far stronger than that of other samples, which implies that 5% Ce/SnS2 maybe possess higher photocatalytic efficiency than others. In addition, it should be noted that the photo current density kept constant as before after 40 cycles, which demonstrated the commendable photostability of the as-prepared samples. In conclusion, undoped SnS2 and Ce-doped SnS2 all could realize photocatalytic reduction of Cr(Ⅵ) in theory, and 5% Ce-doped SnS2 likely had the best photocatalytic property due to its good light harvesting ability and separation efficiency of photo induced carriers.
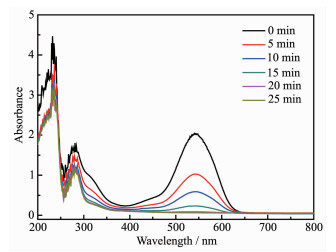
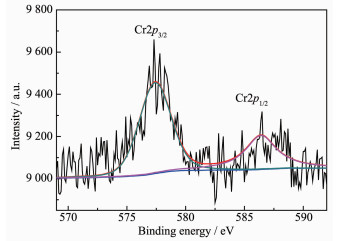
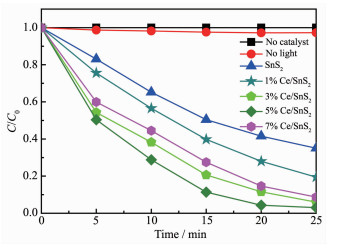
In order to prove the above reasoning, the photocatalytic activities of undoped SnS2 and Ce-doped SnS2 were conducted by reduction of Cr(Ⅵ) with HCOOH as a hole scavenger and pH value regulator. In previous reports, it was proved that pH of the solution is a key parameter for photocatalytic efficiency, and the photocatalytic efficiency of reduction of Cr(Ⅳ) in low pH level was far higher than that in high pH level[40]. Hence, the following photocatalytic reduction tests of soluble Cr(Ⅵ) were executed under pH=3. Fig. 10 shows time-dependence of photocatalytic reduction of aqueous Cr(Ⅵ) under visible-light irradiation in the presence of 5% Ce/SnS2 sample. It is observed that the characteristic peak of soluble Cr(Ⅵ) was 540 nm using the diphenylcarbazide method, which is consistent with previous reports[41]. Typically, the characteristic peak of 40 mg·L-1 K2Cr2O7 solution almost disappear under visible-light irradiation for mere 20 min in the presence of 5% Ce/SnS2. Fig. 11 shows that the photocatalytic activities of undoped SnS2 and Ce-doped SnS2 in the reduction of Cr(Ⅵ) under visible light were affected by the amount of Ce doping. It can be seen that in the absence of any photocatalyst the reduction of aqueous Cr(Ⅵ) hardly occurred under visible-light irradiation for 25 min and in the presence of undoped 5% Ce/SnS2 the amount of aqueous Cr(Ⅵ) changed very little under dark cond-itions, while it proceeded quite rapidly in the presence of undoped SnS2 and Ce-doped SnS2. Nevertheless, the photocatalytic activities of as-prepared samples were greatly different, indicating that the amount of Ce doping played a vital role in photocatalytic process. Accompanied by the increase of Ce ions concentration the photocatalytic capability of SnS2 increased and the 5% Ce/SnS2 sample showed the best photocatalytic reduction ability. And further the increased concen-tration of Ce ions resulted in the decrease of photo-catalytic activity. Based on these results, it can be seen that undoped SnS2 and Ce-doped SnS2 could catalyze reduction of Cr(Ⅵ) under visible-light irradia-tion, and 5% Ce-doped SnS2 had the best photo-catalytic property which agreed well with the above inference. Then, the chemical state of Cr after reaction was characterized by XPS. The binding energy of Cr2p3/2 and Cr2p1/2 at 577.4 and 586.4 eV respectively were observed from Fig. 12, which corre-sponded to Cr(Ⅲ), indicating that the Cr(Ⅵ) was reduced to Cr(Ⅲ) successfully[26].
Based on the screw dislocation growth mechanism, the rose-like Ce-doped SnS2 were obtained through a one-step hydrothermal method and the rose-like morphology was ruined gradually with the increment of Ce ions concentration. The doping element of Ce was checked by EDS and it could enhance photo-absorption ability of SnS2 effectively because Ce doping narrows the energy band gap probably due to the appearance of doping energy level. Moreover, the Ce doping of different proportions could improve the separation efficiency of photo-generated carriers to varying degrees. And the 5% Ce/SnS2 sample possessed the highest photocurrent indicating the best activities which was verified by photocatalytic reduction of Cr(Ⅵ) under visible-light irradiation (λ > 420 nm).
Chai L Y, Huang S H, Yang Z H, et al. J. Hazard. Mater., 2009, 167:516-522 doi: 10.1016/j.jhazmat.2009.01.030
Zhang Y C, Li J, Zhang M, et al. Environ. Sci. Technol., 2011, 45:9324-9331 doi: 10.1021/es202012b
Liu W, Chaspoul F, Lefranc D B, et al. J. Therm. Anal. Calorim., 2007, 89:21-24 doi: 10.1007/s10973-006-7918-2
Barrera C E. J. Hazard. Mater., 2012, 223-224:1-12 http://www.sciencedirect.com/science/article/pii/S0304389412004451
Ma H L, Zhang Y, Hu Q H, et al. J. Mater. Chem., 2012, 22:5914-5916 https://www.mendeley.com/catalogue/chemical-reduction-removal-crvi-acidic-aqueous-solution-ethylenediaminereduced-graphene-oxide/
Cai Z J, Song X Y, Zhang Q, et al. J. Mater. Sci., 2017, 52:5417-5434
Marinho B A, Cristóvo R O, Djellabi R, et al. Appl. Catal., B, 2017, 203:18-30
Liu W, Ni J, Yin X C. Water Res., 2014, 53:12-25 https://www.sciencedirect.com/science/article/abs/pii/S0043135414000098
Bencheikhlatmani R, Obraztsova A, Mackey M R, et al. Environ. Sci. Technol., 2007, 41:214-220
Pan X H, Liu Z J, Chen Z, et al. Water Res., 2014, 55:21-29 https://www.sciencedirect.com/science/article/abs/pii/S0043135414001080
Sundar K, Mukherjee A, Sadiq M, et al. J. Hazard. Mater., 2011, 187:553-561 https://www.sciencedirect.com/science/article/pii/S0304389411000999
Kush P, Deori K, Kumar A, et al. J. Mater. Chem. A, 2015, 3:8098-8106 doi: 10.1039/c4ta06551d
Zhang Y C, Yao L, Zhang G S, et al. Appl. Catal., B, 2014, 144:730-738 http://www.sciencedirect.com/science/article/pii/S0926337313005067
Wang L, Wang N, Zhu L, et al. J. Hazard. Mater., 2008, 152:93-99 https://www.sciencedirect.com/science/article/pii/S0304389407009272
Yang M, Zhang Y C, Dai W M, et al. Key Eng. Mater., 2013, 538:46-49 doi: 10.4028/www.scientific.net/KEM.538.46
Makama A B, Salmiaton A, Saion E B, et al. Bull. Chem. React. Eng. Catal., 2017, 12:62-70
Nanda B, Pradhan A C, Parida K M. Chem. Eng. J., 2017, 316:1122-1135
Cai L, Xiong X L, Liang N G, et al. Appl. Surf. Sci., 2015, 353:939-948 https://www.sciencedirect.com/science/article/pii/S0169433215015937
Liu J L, Zhao Y R, Ma J Z, et al. Ceram. Int., 2016, 42:15968-15974 https://www.sciencedirect.com/science/article/pii/S0272884216311646
Yang W L, Liu Y, Hu Y, et al. J. Mater. Chem., 2012, 22:13895-13898 http://www.mendeley.com/research/microwaveassisted-synthesis-porous-cdocds-coreshell-nanoboxes-enhanced-visiblelightdriven-photocatal/
Wang J C, Ren J, Yao H C, et al. J. Hazard. Mater., 2016, 311:11-19 https://www.sciencedirect.com/science/article/pii/S0304389416301820
Zhang Y C, Zhang Q, Shi Q W, et al. Sep. Purif. Technol., 2015, 142:251-257 doi: 10.1016/j.seppur.2014.12.041
Xie B P, Zhang H X, Cai P X, et al. Chemosphere, 2006, 63:956-963 https://www.sciencedirect.com/science/article/pii/S0045653505011720
Han J L, Zhu G Q, Hojamberdiev M, et al. New J. Chem., 2014, 39:1874-1882 http://www.chemeurope.com/en/publications/864670/thermodecomposition-synthesis-of-porous-small-beta-bi2o3-bi2o2co3-heterostructured-photocatalyst-with-improved-visible-light-photocatalytic-activity.html
Rauf A, Shah M S A S, Choi G H, et al. ACS Sustainable Chem. Eng., 2015, 3:2847-2855 doi: 10.1021/acssuschemeng.5b00783
Qu J F, Chen D Y, Li N J, et al. Appl. Catal., B, 2017, 207:404-411
Padhi D, Parida K. J. Mater. Chem. A, 2014, 2:10300-10312
Pan X H, Liu Z J, Chen Z, et al. Water Res., 2014, 55:21-29 http://www.sciencedirect.com/science/article/pii/S0043135414001080
Kiruthigaa G, Manoharan C, Bououdina M, et al. Solid State Sci., 2015, 44:32-38 https://www.sciencedirect.com/science/article/pii/S1293255815000916
Park S, Selvaraj R, Meetani M A, et al. J. Ind. Eng. Chem., 2017, 45:206-214
Sun L L, Zhou W, Liu Y Y, et al. Appl. Surf. Sci., 2016, 389:484-490
Shown I, Samireddi S, Chang Y C, et al. Nat. Commun., 2018, 9:169-178
An X, Yu J C, Tang J. J. Mater. Chem. A, 2013, 2:1000-1005 http://www.ingentaconnect.com/content/rsoc/20507488/2014/00000002/00000004/art00020
Idris A, Hassan N, Rashid R, et al. J. Hazard. Mater., 2010, 186:1683-1688 http://www.sciencedirect.com/science/article/pii/S0043135409007684
Lei Y Q, Song S Y, Fan W Q, et al. J. Phys. Chem. C, 2009, 113:1280-1285 doi: 10.1021/jp8079974
Butler M A. J. Appl. Phys., 1977, 48:1914-1920 doi: 10.1007/s10854-016-4830-9
Fu X, Ilanchezhiyan P, Mohan K G, et al. Nanoscale, 2017, 9:1820 https://www.ncbi.nlm.nih.gov/pubmed/28106213
Hoffmann M R, Choi W, Bahnemann D W. Chem. Rev., 1995, 95:69-96 doi: 10.1021/cr00033a004
Sun Y Y, Li G H, Xu J, et al. Mater. Lett., 2016, 174:238-241
Mondal C, Ganguly M, Pal J, et al. Langmuir, 2014, 30:4157-4164 doi: 10.1021/la500509c
Tu J R, Shi X F, Lu H W, et al. Mater. Lett., 2016, 185:303-306 doi: 10.1016/j.matlet.2016.09.002

Figure 4 SEM images of undoped SnS2 (a, b), 1% Ce/SnS2 (c), 3% Ce/SnS2 (d), 5% Ce/SnS2 (e) and 7% Ce/SnS2 (f)

Figure 6 Band gap energies determined by (αhν)2 versus hν of undoped SnS2 and Ce-doped SnS2

Figure 9 Photocurrent responses of undoped SnS2 and Ce-doped SnS2 at the external bias of 0.5 V versus SCE electrode

Figure 11 Variation of concentration of Cr(Ⅵ) under visible-light irradiation time for different samples
Table 1. Specific surface area of undoped SnS2 and Ce-doped SnS2
| Samples | Specific surface area / (m2·g-1) |
| SnS2 | 18 |
| 1% Ce/SnS2 | 24 |
| 3% Ce/SnS2 | 39 |
| 5% Ce/SnS2 | 44 |
| 7% Ce/SnS2 | 36 |
 下载: 导出CSV

 扫一扫看文章


扫一扫关注我们