
Figure Scheme 1.
Synthesis route of the TSC ligand HL

Ni(Ⅱ)/Zn(Ⅱ) Complexes with 1-(3-Ethylpyrazin-2-yl)ethylidene)-4-methylthiosemicarbazide: Crystal Structures and DNA-Binding Properties
Wan-Wan WANG , Yuan WANG , Ya-Ping YU , Yu-Fei SONG , Wei-Na WU


Thiosemicarbazones (TSCs) and their transition metal complexes have attracted intensity attention in the coordination chemistry because of their high biological and pharmaceutical activities[1-4]. In most cases, metal-ligand synergism could occur (especially Fe(Ⅲ), Co(Ⅲ), Ni(Ⅱ), Cu(Ⅱ), Zn(Ⅱ) and Cd(Ⅱ))[5-7], although the mechanism of antitumor action is controversial in many respects and has been identified including ribonucleotide reductase inhibition[8-9], metal dependent radical damage[10], DNA binding[11] and inhibition of protein synthesis[12].
As one of the most promising systems, the transition metal complexes of TSCs derived from 2-acetylpyridine/2-acetylpyrazine with different N(4)-substituents have been extensively studied as potential anticancer agents[13-15]. To the best of our knowledge, however, the investigations on the complexes of TSCs derived from substituted 2-acetylpyrazine are relatively scarce[14-15]. Taking into account this background and while searching for bioactive compounds, two compl-exes, namely [NiL(HL)](OAc) (1) and [ZnL(OAc)]n (2) (HL=1-(3-ethylpyrazin-2-yl)ethylidene)-4-methylthiose-micarbazide) were synthesized and characterized by X-ray diffraction methods. In addition, DNA-binding properties of three compounds have been investigated in detail.
Solvents and starting materials for syntheses were purchased commercially and used as received. Elemental analyses were carried out on an Elemental Vario EL analyzer. The IR spectra (ν=4 000~400 cm-1) were determined by the KBr pressed disc method on a Bruker V70 FT-IR spectrophotometer. DNA-binding properties of both complexes are measured using literature method via emission spectra[16]. The UV spectra were recorded on a Purkinje General TU-1800 spectrophotometer. Fluorescence spectra were deter-mined on a Varian CARY Eclipse spectrophotometer, in the measurements of emission and excitation spectra the pass width was 5 nm.
A mixture of 3-ethyl-2-acetylpyrazine (1.50 g, 10 mmol) and N(4)-methylthiosemicarbazide (1.05 g, 10 mmol) in ethanol (30 mL) were stirred for 4 h at room temperature. The white solid HL precipitated, then was filtered and washed three times by cold ethanol. Yield: 1.87 g (79%). m.p. 137.0~137.9 ℃. Elemental analysis Calcd. for C10H15N5S(%): C 50.61; H 6.37; N 29.51; Found(%): C 50.79; H 6.22; N 29.74. 1H NMR (400 MHz, CDCl3): δ 8.78 (1H, s, NH), 8.53~8.54 (2H, t, pyrazine-H), 3.25~3.36 (3H, d, CH3), 3.11~3.15 (2H, q, CH2-CH3), 2.39 (3H, s, CH3), 1.35~1.37 (3H, t, CH3-CH2). FT-IR (cm-1): ν(N=C) 1 544, ν(N=C, pyrazine) 1 502, ν(S=C) 863.
Complex 1 was synthesized by reacting HL (0.5 mmol) with Ni(OAc)2 (ligand-metal molar ratio 2:1) in methanol (20 mL) solution at room temperature. The block crystals suitable for X-ray diffraction analysis were obtained by evaporating the reaction solutions at room temperature. Complex 2 is prepared by the same procedure, while using Zn(OAc)2 instead of Ni(OAc)2.
1: Brown blocks. Yield: 58%. Anal. Calcd. for C22H32N10O2S2Ni(%): C, 44.68; H, 5.45; N, 23.68. Found(%): C, 44.57; H, 5.58; N, 23.58. FT-IR (cm-1): ν(N=C) 1 534, ν(N=C, pyrazine) 1 474, νa(COO) 1 569, νs(COO) 1 420, ν(S=C) 821.
2: Yellow blocks. Yield: 62%. Anal. Calcd. for C12H17N5O2SZn(%): C, 39.95; H, 4.75; N, 19.41. Found(%): C, 40.15; H, 4.83; N, 19.23. FT-IR (cm-1): ν(N=C) 1 527, ν(N=C, pyrazine) 1 477, νa(COO) 1 584, νs(COO)1 413, ν(S=C) 822.
The X-ray diffraction measurement for complexes 1 (Size: 0.20 mm×0.18 mm×0.16 mm) and 2 (Size: 0.16 mm×0.15 mm×0.03 mm) was performed on a Bruker SMART APEX Ⅱ CCD diffractometer equipped with a graphite monochromatized Mo Kα radiation (λ=0.071 073 nm) by using φ-ω scan mode. Semi-emp-irical absorption correction was applied to the intensity data using the SADABS program[17]. The structures were solved by direct methods and refined by full matrixleast-square on F2 using the SHELXTL-97 program[18]. The C6 atom of 1 occupied two positions, with the occupancy value of C6/C6A being 0.358/0.642. All non-hydrogen atoms were refined anisotro-pically. All H atoms were positioned geometrically and refined using a riding model. Details of the crystal parameters, data collection and refinements for complexes 1 and 2 are summarized in Table 1.

 DownLoad:
CSV
DownLoad:
CSV
| 1 | 2 | |
| Empirical formula | C22H32N10O2S2Ni | C12H17N5O2SZn |
| Formula weight | 590.40 | 360.73 |
| T/K | 296(2) | 296(2) |
| Crystal system | Monoclinic | Monoclinic |
| Space group | P21/c | P21/c |
| a/nm | 0.877 27(12) | 0.913 1(6) |
| b/nm | 1.346 91(18) | 1.599 7(11) |
| c/nm | 2.315 0(3) | 2.173 9(14) |
| β/(°) | 100.337(3) | 91.777(13) |
| V/nm3 | 2.691 0(6) | 3.174(4) |
| Z | 4 | 8 |
| Dc/(g·cm-3) | 1.460 | 1.517 |
| F(000) | 1 240 | 1 488 |
| Data, restraint, parameter | 4 737, 3, 352 | 5 553, 27, 387 |
| Goodness-of-fit (GOF) on F2 | 1.014 | 1.059 |
| Final R indices [I>2σ(I)] | R1=0.050 0, wR2=0.072 7 | R1=0.043 7, wR2=0.090 6 |
| R indices (all data) | R1=0.110 4, wR2=0.086 4 | R1=0.076 6, wR2=0.101 9 |
CCDC: 1587278, 1; 1587280, 2.
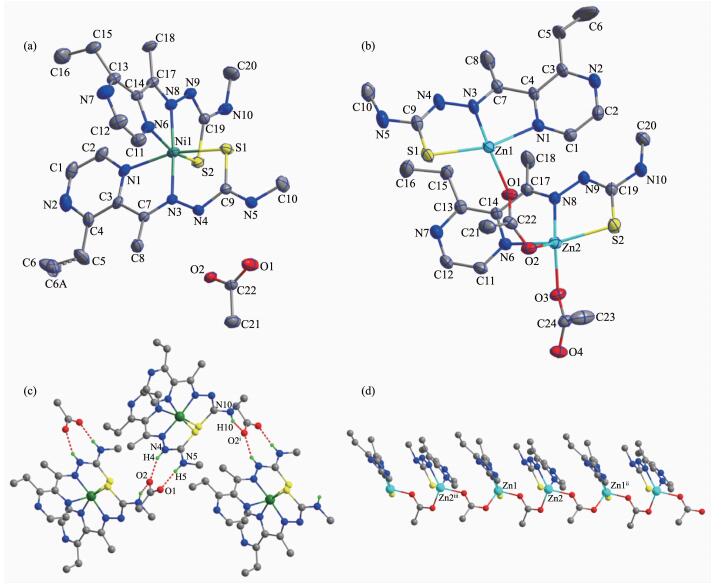
The diamond drawings of complexes 1 and 2 are shown in Fig. 1. Selected bond distances and angles are listed in Table 2. As shown in Fig. 1a, the asymmetric unit of complex 1 contains a coordination cation and a free acetate anion for charge balance. The center Ni(Ⅱ) ion is coordinated by two TSC ligands with N4S2 donor sets, and thus possesses a distorted octahedron coordination geometry. It should be noted that one of the TSC ligands is neutral with C-S bond length (C9-S1) being 0.168 4(4) nm, which is similar as that of the reported TSCs[19], while quite shorter than that of its counterpart (C19-S2, 0.173 2(4) nm). The distances of Ni-N/S bonds were in the range of 0.199 3(3)~0.2398 5(12) nm, which were comparable with those found in the reported complexes with similar donor set[14-15]. In the crystal, free acetate anions link the complex cations via intermolecular N-H…O hydrogen bonds (N4-H4…O2, with D…A distance being 0.270 7(4) nm, D-H…A angle being 148.4°; N5-H5…O1, with D…A distance being 0.267 1(5) nm, D-H…A angle being 172.0°; N10-H10…O2ⅰ, with D…A distance being 0.297 1(4) nm, D-H…A angle being 148.7°, Symmetry code: ⅰ -x, -0.5+y, 0.5-z) into one-dimentional chains along a axis (Fig. 1c).
 DownLoad:
CSV
DownLoad:
CSV
| 1 | |||||
| Ni1-N1 | 0.211 4(3) | Ni1-N3 | 0.201 2(3) | Ni1-S1 | 0.238 66(12) |
| Ni1-N6 | 0.210 3(3) | Ni1-N8 | 0.199 3(3) | Ni1-S2 | 0.239 85(12) |
| N8-Ni1-N3 | 174.11(14) | N6-Ni1-N1 | 85.25(13) | N8-Ni1-S2 | 82.50(10) |
| N8-Ni1-N6 | 77.00(14) | N8-Ni1-S1 | 98.21(9) | N3-Ni1-S2 | 103.10(9) |
| N3-Ni1-N6 | 97.28(13) | N3-Ni1-S1 | 83.25(10) | N6-Ni1-S2 | 159.11(10) |
| N8-Ni1-N1 | 101.03(13) | N6-Ni1-S1 | 91.96(9) | N1-Ni1-S2 | 94.87(9) |
| N3-Ni1-N1 | 76.87(13) | N1-Ni1-S1 | 159.39(10) | S1-Ni1-S2 | 94.91(4) |
| 2 | |||||
| Zn1-O1 | 0.201 9(3) | Zn1-O4ⅲ | 0.199 5(3) | Zn1-N1 | 0.222 3(3) |
| Zn1-N3 | 0.211 7(3) | Zn1-S1 | 0.233 77(19) | Zn2-O2 | 0.200 6(3) |
| Zn2-O3 | 0.202 9(3) | Zn2-N6 | 0.220 8(3) | Zn2-N8 | 0.211 1(3) |
| Zn2-S2 | 0.235 5(19) | ||||
| O4ⅲ-Zn1-S1 | 110.84(9) | O4ⅲ-Zn1-N1 | 89.49(12) | O4ⅲ-Zn1-O1 | 97.79(12) |
| O1-Zn1-S1 | 105.50(9) | O1-Zn1-N1 | 86.26(12) | O4ⅲ-Zn1-N3 | 126.46(13) |
| N3-Zn1-S1 | 81.92(9) | N3-Zn1-N1 | 73.18(12) | O1-Zn1-N3 | 129.76(12) |
| N1-Zn1-S1 | 154.31(10) | O2-Zn2-S2 | 111.72(10) | O2-Zn2-N6 | 91.53(13) |
| O2-Zn2-O3 | 97.53(12) | O3-Zn2-S2 | 105.09(9) | O3-Zn2-N6 | 84.00(12) |
| O2-Zn2-N8 | 126.15(13) | N8-Zn2-S2 | 82.27(10) | N8-Zn2-N6 | 72.91(13) |
| O3-Zn2-N8 | 129.95(12) | N6-Zn2-S2 | 153.16(9) | ||
| Symmetry codes: ⅲ 1+x, y, z | |||||
There exist two independent Zn(Ⅱ) ions with similar coordination environment in the asymmetric unit of complex 2 (Fig. 1b). Each Zn(Ⅱ) ion is five-coordinated, involving two μ-OCO acetate anions, one tridentate enolizated ligand L-, thus forming one dimension chain-like framework along a axis (Fig. 1d). According to the Addison rule[20], the geometric index τ is 0.414 and 0.391 for Zn1 and Zn2, respectively, indicating that the coordination geometry of each Zn(Ⅱ) ion is best described as a distorted tetragonal pyramid rather than trigonal bipyramid. However, no classical hydrogen bonds are presented in the structure of 2.
The infrared spectral bands most useful for determining the coordination mode of the ligand are the ν(N=C), ν(N=C, pyrazine) and ν(S=C) vibrations. Such three bonds of the free TSC ligand is found at 1 544, 1 502 and 863 cm-1, while they shifts to lower frequency in complexes 1 and 2, clearly indicating the coordination of imine nitrogen, pyrazine nitrogen and sulfur atoms[14-15]. In addition, the general pattern of the IR spectroscopy supports the existence of free and μ-OCO acetate groups in complexes 1 and 2, respe-ctively[21]. It is in accordance with the X-ray diffraction analysis result.
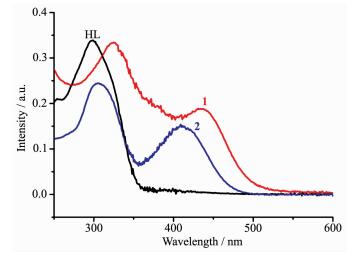
The UV spectra of HL, complexes 1 and 2 in CH3OH solution (concentration: 10 μmol·L-1) were measured at room temperature (Fig. 2). The spectra of HL features only one main band located around 299 nm (ε=34 026 L·mol-1·cm-1), which could be assigned to characteristic π-π* transition of pyrazine unit[16]. Similar bands are observed at 323 nm (ε=33 725 L·mol-1·cm-1) and 304 nm (ε=24 475 L·mol-1·cm-1) in the complexes 1 and 2, respectively. However, the new bands at 435 nm (ε=19 092 L·mol-1·cm-1) and 410 nm (ε=15 240 L·mol-1·cm-1) could be observed in spectra of 1 and 2, respectively, probably due to the ligand-to-metal charge transfer (LMCT)[22]. This indicates that an extended conjugation is formed in anionic ligand after complexation in the complexes.
It is well known that EB can intercalate into DNA to induce strong fluorescence emission. Competitive binding of other drugs to DNA and EB will result in displacement of bound EB and a decrease in the fluorescence intensity[16]. Fig. 3 shows the effects of HL, complexes 1 and 2 on the fluores-cence spectra of EB-DNA system. The fluorescence emission peak of EB bound to ct-DNA is at about 600 nm, which shows remarkable decreasing trend with the increasing concentration of each tested compound. This fact indicates that some EB molecules are released into solution after the exchange with the compound. The quenching of EB bound to DNA by the compound is in agreement with the linear Stern-Volmer equation: I0/I=1+Ksqr[21-22], where I0 and I represent the fluorescence intensities in the absence and presence of quencher, respectively; Ksq is the linear Stern-Volmer quenching constant; r is the ratio of the concentration of quencher and DNA. In the quenching plots of I0/I versus r, Ksq values are given by the slopes. The Ksq values are 0.484, 1.179 and 1.038 for HL, complexes 1 and 2, respectively, indi-cating that interaction of the complexes with DNA is stronger than HL. This is probably due to the structure rigidity and metal-ligand synergism effect of the complexes[16]. Complex 1 has higher quenching ability than 2, because 1 possesses zero dimensional structure while 2 has an infinite chain-like framework. In addition, the coordination environment of the metal ion may be also responsible for the DNA interaction ability in some extent.

Ramachandran E, Raja D S, Rath N P, et al. Inorg. Chem., 2013, 52:1504-1514 doi: 10.1021/ic302258k
Ivanovic I, Gligorijevic N, Arandelovic S, et al. Polyhedron, 2013, 61:112-118 doi: 10.1016/j.poly.2013.05.050
Almeida S M, Lafayette E A, Silva L P, et al. Int. J. Mol. Sci., 2015, 6:13023-13042
Zhang X M, Guo H, Li Z S, et al. Eur. J. Med. Chem., 2015, 101:419-430 doi: 10.1016/j.ejmech.2015.06.047
Sangeetha K G, Aravindakshan K K. Inorg. Chim. Acta, 2018, 469:387-396 doi: 10.1016/j.ica.2017.09.057
Milunovic M N M, Dobrova A, Novitchi G, et al. Eur. J. Inorg. Chem., 2017, 469:4473-4483
Wang Y T, Fang Y, Zhao M, et al. MedChemComm, 2017, 8(11):2125-2132 doi: 10.1039/C7MD00415J
Kowo C R, Trond R, Arion V B, et al. Dalton Trans., 2010, 39:704-706 doi: 10.1039/B919119B
Zeglis B M, Divilov V, Lewis J S. J. Med. Chem., 2011, 54:2391-2394 doi: 10.1021/jm101532u
EnyedyÉA, Primik M F, Kowol C R, et al. Dalton Trans., 2011, 40:5895-5905 doi: 10.1039/c0dt01835j
Ramachandran E, Thomas S P, Poornima P, et al. Eur. J. Med. Chem., 2012, 50:405-415 doi: 10.1016/j.ejmech.2012.02.026
Raja D S, Paramaguru G, Bhuvanesh N S, et al. Dalton Trans., 2011, 4:4548-4559 http://www.ncbi.nlm.nih.gov/pubmed/21431149
Al-Eisawi Z, Stefani C, Jansson P J, et al. J. Med. Chem., 2016, 59:294-312 doi: 10.1021/acs.jmedchem.5b01399
Li M X, Zhang L Z, Yang M, et al. Bioorg. Med. Chem. Lett., 2012, 22:2418-2433 doi: 10.1016/j.bmcl.2012.02.024
Li M X, Zhang L Z, Zhang D, et al. Eur. J. Med. Chem., 2011, 46:4383-4390 doi: 10.1016/j.ejmech.2011.07.009
林龙, 李先宏, 张波, 等.无机化学学报, 2017, 33:143-148 doi: 10.11862/CJIC.2016.283LIN Long, LI Xian-Hong, ZHANG Bo, et al. Chinese J. Inorg. Chem., 2017, 33:143-148 doi: 10.11862/CJIC.2016.283
Sheldrick G M. SADABS, University of Göttingen, Germany, 1996.
Sheldrick G M. SHELX-97, Program for the Solution and the Refinement of Crystal Structures, University of Göttingen, Germany, 1997.
李晓静, 毛盼东, 吴伟娜, 等.无机化学学报, 2017, 33:1257-1265 doi: 10.11862/CJIC.2017.151LI Xiao-Jing, MAO Pan-Dong, WU Wei-Na, et al. Chinese J. Inorg. Chem., 2017, 33:1257-1265 doi: 10.11862/CJIC.2017.151
Addison A W, Rao T N. J. Chem. Soc. Dalton Trans., 1984:1349-1356
Nakamoto K. Infrared and Raman Spectra of Inorganic and Coordination Compounds: Part B. 6th Ed. New York: Wiley, 2009: 65
毛盼东, 赵晓雷, 邵志鹏, 等.无机化学学报, 2017, 33:890-896 doi: 10.11862/CJIC.2017.109MAO Pan-Dong, ZHAO Xiao-Lei, SHAO Zhi-Peng, et al. Chinese J. Inorg. Chem., 2017, 33:890-896 doi: 10.11862/CJIC.2017.109

Figure 1 ORTEP drawing of 1 (a) and 2 (b) with 30% thermal ellipsoids; (c) Chain-like structure along a axis formed via N-H…O hydrogen bonds in complex 1; (d) 1D chain like structure along a axis in complex 2
Hydrogen bonds shown in dashed line; Symmetry codes: ⅰ-x, -0.5+y, 0.5-z; ⅱ-1+x, y, z; ⅲ 1+x, y, z

Figure 3 Emission spectra of EB-DNA system in the presence of HL (a), complexes 1 (b) and 2 (c)
Arrow shows the fluorescence intensities change of EB-DNA system upon increasing tested compound concentration; Inset: plot of I0/I versus r
Table 1. Crystal data and structure refinement for complexes 1 and 2
| 1 | 2 | |
| Empirical formula | C22H32N10O2S2Ni | C12H17N5O2SZn |
| Formula weight | 590.40 | 360.73 |
| T/K | 296(2) | 296(2) |
| Crystal system | Monoclinic | Monoclinic |
| Space group | P21/c | P21/c |
| a/nm | 0.877 27(12) | 0.913 1(6) |
| b/nm | 1.346 91(18) | 1.599 7(11) |
| c/nm | 2.315 0(3) | 2.173 9(14) |
| β/(°) | 100.337(3) | 91.777(13) |
| V/nm3 | 2.691 0(6) | 3.174(4) |
| Z | 4 | 8 |
| Dc/(g·cm-3) | 1.460 | 1.517 |
| F(000) | 1 240 | 1 488 |
| Data, restraint, parameter | 4 737, 3, 352 | 5 553, 27, 387 |
| Goodness-of-fit (GOF) on F2 | 1.014 | 1.059 |
| Final R indices [I>2σ(I)] | R1=0.050 0, wR2=0.072 7 | R1=0.043 7, wR2=0.090 6 |
| R indices (all data) | R1=0.110 4, wR2=0.086 4 | R1=0.076 6, wR2=0.101 9 |
 下载: 导出CSV
Table 2. Selected bond lengths (nm) and angles(°) in complexes 1 and 2
| 1 | |||||
| Ni1-N1 | 0.211 4(3) | Ni1-N3 | 0.201 2(3) | Ni1-S1 | 0.238 66(12) |
| Ni1-N6 | 0.210 3(3) | Ni1-N8 | 0.199 3(3) | Ni1-S2 | 0.239 85(12) |
| N8-Ni1-N3 | 174.11(14) | N6-Ni1-N1 | 85.25(13) | N8-Ni1-S2 | 82.50(10) |
| N8-Ni1-N6 | 77.00(14) | N8-Ni1-S1 | 98.21(9) | N3-Ni1-S2 | 103.10(9) |
| N3-Ni1-N6 | 97.28(13) | N3-Ni1-S1 | 83.25(10) | N6-Ni1-S2 | 159.11(10) |
| N8-Ni1-N1 | 101.03(13) | N6-Ni1-S1 | 91.96(9) | N1-Ni1-S2 | 94.87(9) |
| N3-Ni1-N1 | 76.87(13) | N1-Ni1-S1 | 159.39(10) | S1-Ni1-S2 | 94.91(4) |
| 2 | |||||
| Zn1-O1 | 0.201 9(3) | Zn1-O4ⅲ | 0.199 5(3) | Zn1-N1 | 0.222 3(3) |
| Zn1-N3 | 0.211 7(3) | Zn1-S1 | 0.233 77(19) | Zn2-O2 | 0.200 6(3) |
| Zn2-O3 | 0.202 9(3) | Zn2-N6 | 0.220 8(3) | Zn2-N8 | 0.211 1(3) |
| Zn2-S2 | 0.235 5(19) | ||||
| O4ⅲ-Zn1-S1 | 110.84(9) | O4ⅲ-Zn1-N1 | 89.49(12) | O4ⅲ-Zn1-O1 | 97.79(12) |
| O1-Zn1-S1 | 105.50(9) | O1-Zn1-N1 | 86.26(12) | O4ⅲ-Zn1-N3 | 126.46(13) |
| N3-Zn1-S1 | 81.92(9) | N3-Zn1-N1 | 73.18(12) | O1-Zn1-N3 | 129.76(12) |
| N1-Zn1-S1 | 154.31(10) | O2-Zn2-S2 | 111.72(10) | O2-Zn2-N6 | 91.53(13) |
| O2-Zn2-O3 | 97.53(12) | O3-Zn2-S2 | 105.09(9) | O3-Zn2-N6 | 84.00(12) |
| O2-Zn2-N8 | 126.15(13) | N8-Zn2-S2 | 82.27(10) | N8-Zn2-N6 | 72.91(13) |
| O3-Zn2-N8 | 129.95(12) | N6-Zn2-S2 | 153.16(9) | ||
| Symmetry codes: ⅲ 1+x, y, z | |||||
下载: 导出CSV

 扫一扫看文章


扫一扫关注我们

