Citation:
SUI Mei-Rong, GU Xiu-Quan, SHI Mei-Lin, LIU Lin-Lin, NI Zhong-Hai. Effects of Electrolyte Composition, Thickness and Surface Modification on Photo-Electrochemical Activity of BiVO4 Films Deposited through Spin-Coating[J]. Chinese Journal of Inorganic Chemistry,
2018, 34(6): 1183-1191.
doi:
10.11862/CJIC.2018.143a
Received Date:
18 January 2018 Revised Date:
10 April 2018 Available Online:
10 June 2018
Abstract:
Porous BiVO4 thin films have been prepared on the fluorine doped tin oxide (SnO2:F) coated glass substrates through a facile spin-coating strategy for water splitting application. The film thickness was tuned by varying the deposition cycles and the precursor concentration, respectively. The influences of electrolyte composition, film thickness and surface modification were investigated on the actual photoelectrochemical (PEC) performance of the as-annealed BiVO4 porous films. The results show that the PEC activity of BiVO4 can be enhanced effectively by adding a hole scavenger Na2SO3 with suitable amount into the electrolyte, or modified the surface with a co-catalyst Co-Pi. These methods can suppress the carrier recombination that occurs at the solid/liquid interface. The highest photocurrent density (4.3 mA·cm-2 at a bias of 0.6 V (vs SCE)) was achieved in the BiVO4 samples which were synthesized at the optimal condition and characterized under a visible-light irradiation intensity of 100 mW·cm-2, using a 0.1 mol·L-1 Na2SO4+0.1 mol·L-1 Na2SO3 electrolyte. Additionally, a facile PEC bio-sensor is constructed by using a BiVO4 film anode, leading to an acceptable sensitivity for detecting the glutathione (GSH). In a word, it is demonstrated that the PEC performance of BiVO4 is dependent on both the light harvesting and carrier diffusion process.
During the last few years, much attention has been paid to solar-driven water splitting, which is a low-cost technique for the utilization of solar energy to produce chemical fuels (such as H2)[1-2]. There are three main ways for solar water splitting: photocatalysis, photoelectrochemical (PEC) cells, and the photovoltaic (PV) driven PEC cells[3]. Of them, the PEC method (i.e., the PEC cell) owns the most ideal cost performance, thus it might be one of the most promising techniques for a large-scale application in near future. It is known that the photoanode is a key component of the PEC cell, which is always a semiconductor and can realize a conversion of solar energy to electricity.
As early as in 1967, Fujishima and Honda discovered that H2 can be generated from a PEC cell which is consisted of a TiO2 photoanode under an ultraviolet (UV) illumination[4]. Nevertheless, TiO2 is a wide bandgap semiconductor (Eg=3.2~3.4 eV), which can only respond to UV light that accounts for 4% of incoming solar energy. Thus, it is necessary to either reduce the bandgap of TiO2, modify with narrow-gap semiconductors or look for a new alternative photoanode[5-6]. Up to now, a number of semiconductor photoanodes have been developed to replace TiO2 for operating under a visible light irradiation, including α-Fe2O3, WO3, BiOBr, Ag3PO4, BiVO4, NiNb2O6, and so on[7-12]. Of them, BiVO4 represents one of the most promising photoanode candidates due to a plenty of advantages like non-toxicity, stability, low cost, narrow band gap of ~2.4 eV, as well as the suitable levels of the conduction band (CB) and valence band (VB)[13]. Fortunately, in a latest report, it has been demon-strated that a PEC device made of modified BiVO4 and α-Fe2O3 as dual photoanodes shows an unbiased water splitting efficiency (or said, solar to hydrogen efficiency) of 7.7%[14]. Moreover, it is relatively easy to obtain a BiVO4 porous thin film with controllable thickness due to the accessibility of a Bi-V-O precursor with good fluidity and dispersity[15]. Based on the above merits, similar with TiO2, it has been demonstrated feasible to fabricate a BiVO4 photoanode with both an inverse opal network structure and a considerable average pore size by using a dilute Bi-V-O precursor[16-17].
Theoretically, the maximum water oxidation photocurrent density (Jmax) for BiVO4 photoanodes under Air-mass 1.5 Global (AM 1.5G) solar illumination is 7.5 mA·cm-2[18]. Nevertheless, to the best of our know-ledge, the reported photocurrent density (J) are much lower than the theoretical value (7.5 mA·cm-2), owing to a serous carrier recombination occurred at the electrolyte/electrolyte interface[19]. In other words, only a small part of photoexcited holes take part in the water oxidation reaction and make a contribution to the photocurrent output. So far, much effort has been devoted to improve the performance of BiVO4 photo-anodes, including the doping of hetero-ions (such as Mo6+, W6+, P5+), surface modification and forma-tion of a heterostructure with other semiconductors[20-22], but few work is focused on the effect of layer thickness or electrolyte component on the PEC performance of BiVO4. Surely, fewer attention is paid towards the mechanism why the performance of BiVO4 porous thin film is improved.
In the present work, we will investigate the effect of preparation and characterization conditions on the PEC properties of porous BiVO4 thin films which were synthesized on the fluorine doped tin oxide (FTO, also named as SnO2:F) substrates through a facile spin-coating deposition method. After optimizing the preparation procedure, a photocurrent density of ~4.3 mA·cm-2 was achieved in the cobalt phosphate (Co-Pi) modified BiVO4 layers under a visible-light irradiation intensity of 100 mW·cm-2. The mechanism for the performance improvement was analyzed by combining LSV plots with electrochemical impedance spectra (EIS).
1.
Experimental
All the chemical reagents including bismuth nitrate pentahydrate (Bi(NO3)3·5H2O, ≥98%), vanadyl acetylacetonate (VO(acac)2, ≥98%), cobalt nitrate hexahydrate (Co(NO3)2·6H2O, ≥98%), glacial acetic acid (CH3CO2H, ≥99.7%) and acetylacetone (≥99%) were analytically pure (AR) and purchased from Shanghai Civi Co., Ltd. Conductive FTO glass substrates (2.2 mm thick, 15 Ω·□-1) were obtained from Yinkou OPV Tech Co., Ltd.
1.1
Preparation of porous BiVO4 thin films
The actual concentration of precursor solution was determined by adding the Bi and V based salts (solute). For example, in order to prepare a 45 mmol·L-1 precursor solution for synthesizing BiVO4 porous thin films, two different solutions were prepared by dissolving 0.131 g (0.27 mmol) of Bi(NO3)3·5H2O in 1 mL of acetic acid and 0.072 g (0.27 mmol) of VO(acac)2 in 5 mL methanol. After pouring the solution containing Bi into that containing V slowly (or said, drop by drop), the mixture (nBi/nV=1) was subjected to ultraso-nicate robustly for 30 min, after which a stable, clear and straw-yellow precursor solution was obtained. This precursor was then employed in the following spin-coating procedure. Different concentrations (nBi/nV=1) of precursor solution were obtained with the same methods.
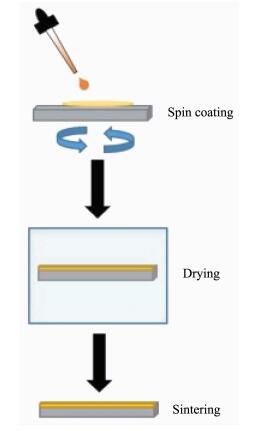
The film deposition process involved a small amount (~125 μL) of precursor solution being spread over the whole FTO substrate (2 cm×2 cm) and the substrate was then spin-coated at 1 500 r·min for 20 s, as displayed in Fig. 1. Afterwards, the film samples were transferred into an oven and dried at 150 ℃ for 5 min, followed by a further 400 ℃ annealing treat-ment for 2 h. The processes of spin-coating deposition and air-annealing were repeated several times to obtain a target thickness of the BiVO4 porous thin film.
图 1
图 1
Schematic procedure for preparing BiVO4 porous thin films
Figure 1.
Schematic procedure for preparing BiVO4 porous thin films
This technique was chosen for the deposition of Co-Pi because it provides a more efficient route of coupling Co-Pi to the BiVO4 electrode than the common electrodeposition[20]. This technique involved a porous BiVO4 thin film (working electrode, WE), an saturated calomel (reference electrode, RE) and a Pt foil (counter electrode, CE) being immersed in a 0.1 mol·L-1 sodium phosphate buffer (pH=7.0) containing 0.5 mmol·L-1 of Co2+ ions (from cobalt nitrate). A constant potential of 1.32 V versus saturated calomel electrode (SCE) was then applied for a certain period of time using an electrochemical workstation (CHI660D). In addition, the visible light (100 mW·cm-2) from a 500 W Xe lamp was used to irradiate the BiVO4 electrodes during the whole deposition process (lasting for 15 min).
1.3
Material characterization
The cross-sectional morphology and phase structure were characterized by a field emission scanning electron microscopy (FESEM, Sirion 200) operating at 5 kV and an X-ray diffraction (XRD, Haoyuan DX-2700) with a Cu Kα source (λ=0.154 06 nm). X-ray tube voltage, current and scanning range were set at 45 kV, 40 mA and 2θ=10°~80°, respe-ctively. In addition, the diffuse absorption spectra of BiVO4 porous thin films were measured on a Cary 300 UV-Vis spectrophotometer with integrating sphere (Varian, USA). The composition of a Co-Pi modified BiVO4 film was characterized by an electron probe micro-analyzer (EPMA-8050G, Shimadzu, Japan).
1.4
PEC measurements
The PEC performance was measured by an electrochemical workstation (CHI660D) under irradia-tion. The visible-light irradiation was provided by a 500 W Xe lamp (Beijing Trusttech Technology Co., Ltd.) with using a UV cut-off filter. The BiVO4 porous thin films were employed as the working electrode (WE), and they were coated with a non-conductive epoxy, leaving an active area of 1 cm×1 cm. Addi-tionally, a Pt foil and a SCE were used as the counter electrode (CE) and reference electrode (RE), respe-ctively. The electrolyte is a mixed aqueous solution of Na2SO4 and Na2SO3.
Linear sweep voltammogram (LSV) plots were gained under visible light irradiation, while the Mott-Schotty plots were measured in dark at a constant frequency of 1 kHz. The Nyquist plots were obtained at a potential of 0 V (vs SCE) by a choice of alterna-ting current impedance technology at a frequency range from 10-2 to 105 Hz. For all the PEC measure-ments, a front-side illumination of the BiVO4 working electrodes was employed. On the basis of this, the fabricated BiVO4 electrode was further adopted as a PEC bio-sensing platform (also said, the bio-sensor) for detecting the glutathione (GSH). The bioanalysis of the GSH concentration was examined by performing the transient photocurrent (J-t) plots at a bias of 0 V (vs SCE) and under irradiation.
2.
Results and discussion
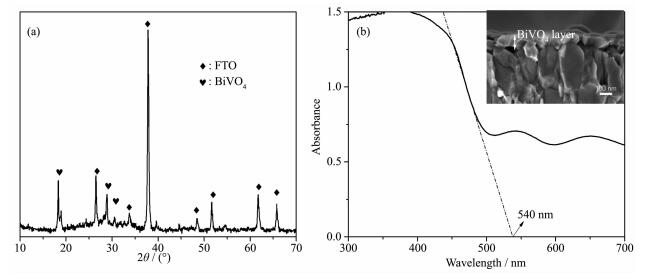
Fig. 2 shows the typical XRD pattern, cross-sectional SEM image and UV-Vis spectrum. It is clearly seen that the BiVO4 film exhibits a monoclinic structure, since that all the peaks can be assigned to PDF No.14-688 and except those from a FTO layer (Fig. 2a). It is also found that the BiVO4 porous thin film displays a good visible light response, while the film thickness is around 120 nm (Fig. 2b). An abrupt absorption edge appears around 500 nm, which is consistent with the bandgap of BiVO4 (~2.4 eV).
图 2
图 2
Typical XRD pattern (a) and optical absorption spectra (b) of BiVO4 porous thin films which were deposited on FTO substrates (5 cycles) directly
Figure 2.
Typical XRD pattern (a) and optical absorption spectra (b) of BiVO4 porous thin films which were deposited on FTO substrates (5 cycles) directly
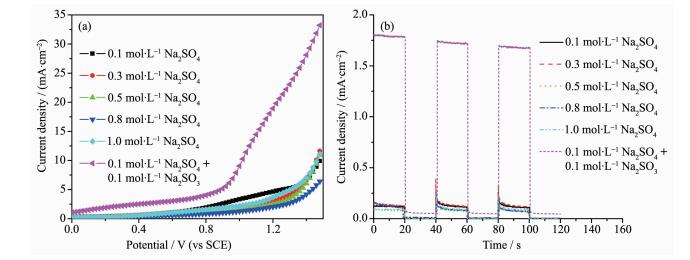
Fig. 3 shows the influence of electrolyte component on the actual PEC performance of the BiVO4 films. It is found that the photocurrent density is independent on the electrolyte concentration while strongly dependent on the electrolyte composition. In details, no obvious changes are observed in the LSV or J-t plots with only increasing the concentration of Na2SO4 from 0.1 to 1.0 mol·L-1, while the photo-current is enhanced significantly after adding 0.1 mol·L-1 Na2SO3 into the 0.1 mol·L-1 Na2SO4 solution. It suggests that the performance of a photoanode is very sensitive to the hole scavenger Na2SO3 in the electrolyte. Namely, the anion SO32- could react with the photoexcited holes more easily than OH- in the water, leading to a large enhancement of the photocurrent density.
图 3
图 3
LSV plots (a) and J-t plots under a chopped irradiation (b) of BiVO4 thin porous films laid in different electrolytes containing of Na2SO3 and Na2SO4
Figure 3.
LSV plots (a) and J-t plots under a chopped irradiation (b) of BiVO4 thin porous films laid in different electrolytes containing of Na2SO3 and Na2SO4
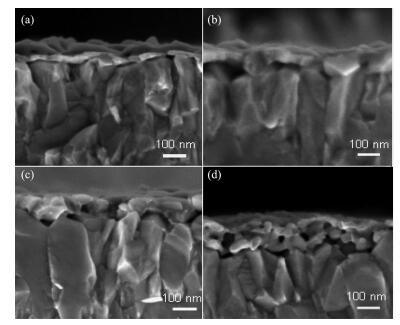
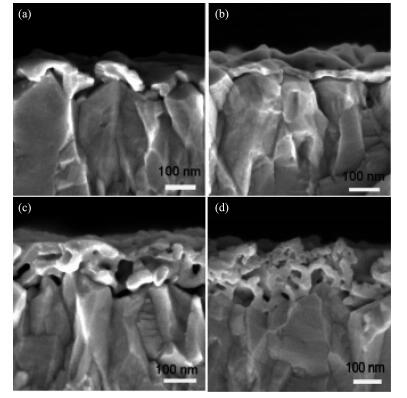
Fig. 4 displays the cross-sectional SEM images of BiVO4 synthesized by using the precursors with various concentrations. Apparently, the thicker the precursor solution, the larger thickness is the BiVO4 layer. It is reasonable that the films are thickened from ~30 to ~210 nm with increasing the precursor concentration from 15 to 60 mmol·L-1, while they display a porous structure due to the evaporation of organic components. Of these samples, the one depos-ited at a precursor concentration of 45 mmol·L-1 displays a film thickness of ~120 nm.
图 4
图 4
Cross-sectional FESEM images of BiVO4 porous thin films fabricated in different precursor concentrations of (a) 15, (b) 30, (c) 45 and (d) 60 mmol·L-1 with a constant cycle number of 5
Figure 4.
Cross-sectional FESEM images of BiVO4 porous thin films fabricated in different precursor concentrations of (a) 15, (b) 30, (c) 45 and (d) 60 mmol·L-1 with a constant cycle number of 5
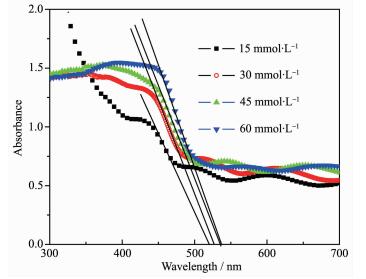
Fig. 5 displays the UV-Vis absorption spectra of the BiVO4 films with different precursor concentrations. Apparently, the visible-light harvesting of the photoanode gets enhanced a lot with increasing the precursor concentration, which is a result of the improved film thickness. Besides, it is also found that the optical bandgap (Eg) is reduced slightly due to a larger influence of the BiVO4 in the entire BiVO4/FTO bilayered films. It is known that BiVO4 owns a narrower bandgap (Eg=2.4 eV) than FTO (Eg=3.6~4.0 eV), thus a larger content ratio of BiVO4/FTO would result in a narrower bandgap of the sample.
图 5
图 5
UV-Vis diffusion absorption spectra of BiVO4 porous thin films fabricated in different concentrations of the precursor solution (from 15 to 60 mmol·L-1) using a constant cycle number of 5
Figure 5.
UV-Vis diffusion absorption spectra of BiVO4 porous thin films fabricated in different concentrations of the precursor solution (from 15 to 60 mmol·L-1) using a constant cycle number of 5
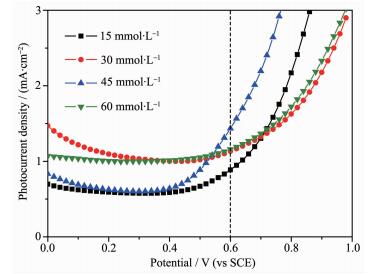
Fig. 6 also displays the LSV plots of BiVO4 films with different concentrations of precursor. It is observed that the highest photocurrent density (1.49 mA·cm-2 at 0.6 V (vs SCE)) appears in the BiVO4 film deposited using a 45 mmol·L-1 precursor solution. It is easily understood that an increase of film thickness facilitates enhancing the light harvesting of a photoanode. However, the actual photocurrent is also limited by the poor carrier diffusion lengths of BiVO4 polycrystalline films, which results in a decrease of the photocurrent as the precursor concentration increases from 45 to 60 mmol·L-1.
图 6
图 6
LSV plots under a continuous irradiation of BiVO4 porous thin films which were prepared using different concentrations of precursor solution
Figure 6.
LSV plots under a continuous irradiation of BiVO4 porous thin films which were prepared using different concentrations of precursor solution
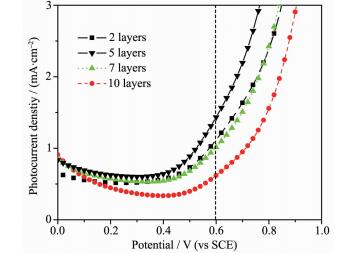
Fig. 7 indicates the cross-sectional SEM images of BiVO4 films deposited with various layer numbers. As expected, both the thickness and porosity are enhanced significantly after increasing the layer number from 2 to 10. Apparently, it can reach the identical effect with an increase of precursor concentration. Accordingly, the effect of deposition cycles (namely, layer numbers) on the PEC activity is also examined in Fig. 8. It is clearly observed that the BiVO4 sample with 5 deposition cycles displays the highest photocurrent value at 0.6 V (vs SCE) of all. In other words, when the layer number exceeds 5, the photocurrent is reduced accordingly due to a limita-tion of the charge carrier diffusion length. That is to say, the optimal PEC performance is achieved in the BiVO4 films with a layer number of 5 or thickness of ~120 nm.
图 7
图 7
Cross-sectional FESEM images of BiVO4 porous thin films fabricated using a precursor concentration of 45 mmol·L-1 and different layer number of (a) 2, (b) 5, (c) 7 and (d) 10
Figure 7.
Cross-sectional FESEM images of BiVO4 porous thin films fabricated using a precursor concentration of 45 mmol·L-1 and different layer number of (a) 2, (b) 5, (c) 7 and (d) 10
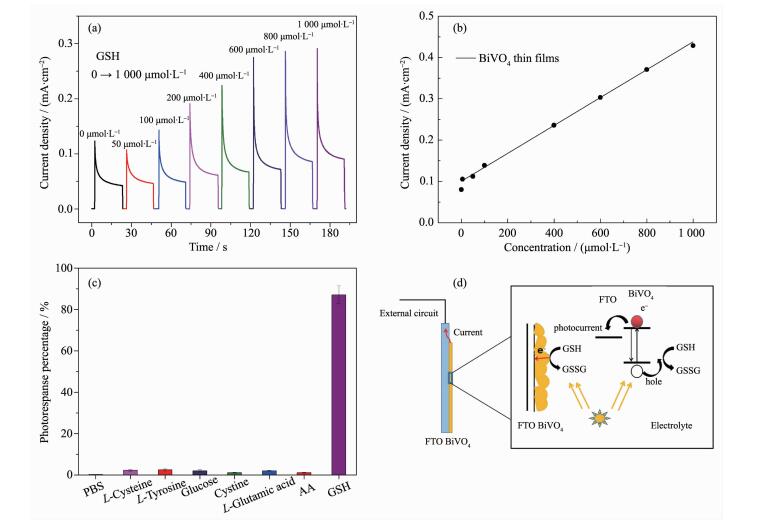
Further, we also assembled a PEC sensor by using a porous BiVO4 film electrode, and the bio-sensing performance of this device was measured at zero bias (0 V vs SCE), as indicated in Fig. 9. Herein, the BiVO4 film was fabricated under the optimal condition (45 mmol·L-1 and 5 layers). At first, a series of sharp peaks in the J-t plots (similar with the pheno-menon appeared in references[23-24]), suggesting that there is an instability in the photocurrent (Fig. 9a). Such a behavior may be due to the poor charge separation on BiVO4 surfaces or interfaces under zero bias. Besides, with increasing the GSH concentration (from 0 to 1 000 μmol·L-1), the photo-response is enhanced significantly, which displays an acceptable sensitivity for detecting the GSH (Fig. 9b). And also, this BiVO4 biosensor also exhibits much higher photo-response towards detection of GSH than other additives (Fig. 9c), which was attributed to the higher redox capability of GSH. Namely, it was easy to realize a conversion of GSH to the oxidized glutath-ione (GSSG) through the following reaction[25]: 2GSH+2h++2OH- →GSSG+2H2O. The possible mechanism for the PEC detection of GSH is shown in Fig. 9d. Apparently, under a visible light irradiation, a number of electron-hole pairs are produced inside a porous BiVO4 film. The existence of the GSH species in an electrolyte accelerates the consumption of holes, leading to a faster migration of the electron towards the opposite direction (i.e., the photocurrent). In other words, the GSH plays a role of the hole sacrificial agent, leading to an acceleration of the carrier separation and an enhancement of the photocurrent output.
图 9
图 9
Amperometric J-t plots (a) and linear relationship between photocurrent density and GSH concentration (b) of a BiVO4 PEC bio-sensor with an addition of GSH to reach the concentrations of 0~1 000 μmmol·L-1 in the electrolyte;
(c) Selectivity experiment by testing in the solutions containing different organic interferents including PBS,
L-Cystenine, L-Tyrosine, Glucose, Cystine, L-Glutamic Acid, AA, where the concentrations of these interferents are 20 μmol·L-1 while that of GSH is 100 μmol·L-1; (d) Possible mechanism for the PEC detection of GSH
Figure 9.
Amperometric J-t plots (a) and linear relationship between photocurrent density and GSH concentration (b) of a BiVO4 PEC bio-sensor with an addition of GSH to reach the concentrations of 0~1 000 μmmol·L-1 in the electrolyte;
(c) Selectivity experiment by testing in the solutions containing different organic interferents including PBS,
L-Cystenine, L-Tyrosine, Glucose, Cystine, L-Glutamic Acid, AA, where the concentrations of these interferents are 20 μmol·L-1 while that of GSH is 100 μmol·L-1; (d) Possible mechanism for the PEC detection of GSH
In this section, the effect a Co-Pi modification was investigated on the PEC activity of a BiVO4 electrode. Table 1 displays the actual composition of the Co-Pi/BiVO4 film sample. The elements of Co and P are clearly identified with considerable contents, which demonstrates a success in the Co-Pi modifica-tion. Note that all the elements (Bi, V, Co, etc.) could be viewed as the oxides exist in the sample, where the elements Na, Si and Ca are from the glass substrate.
表 1
表 1
Composition analysis of the Co-Pi modified BiVO4 thin film via an electron microprobe
Table 1.
Composition analysis of the Co-Pi modified BiVO4 thin film via an electron microprobe
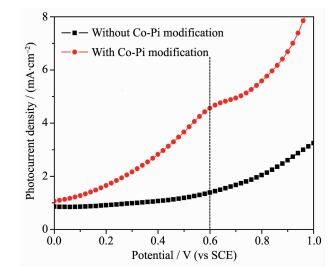
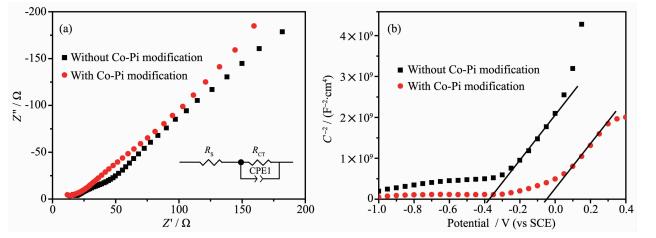
Fig. 10 displays a comparison of the LSV plots of BiVO4 films before and after Co-Pi modification. Apparently, the photocurrent of a BiVO4 electrode is enhanced a lot after coating with a co-catalyst Co-Pi, reaching to a value of 4.3 mA·cm-2 at a bias of 0.6 V (vs SCE). Such a value is comparable to several previous reports. Further, the mechanism for the performance enhancement is also revealed through an EIS analysis, including the Nyquist and Mott-Schotty plots displayed in Fig. 11a and 11b, respectively. Typically, during an equivalent circuit model displayed in the inset of Fig. 11a, RS represents the series resistance from the solid electrode, electrolyte and wires, while RCT represents the charge transfer resistance occurred at the electrode/electrolyte interface. As indicated in Table 2, the parameters Nd and Vfb represent the donor concentration and flat-band potential of a BiVO4 film electrode, respectively. Both of them can be determined from a linear fitting of the Mott-Schotty plots in Fig. 11b. Herein, Nd is inversely proportional to the slope of the fitted curve, while Vfb corresponds to the intercept of the fitted plot on the X-axis. Notably, after a Co-Pi modification, RCT gets smaller while Vfb becomes more positive, implying that the charge transfer resistance is reduced a lot. That is to say, the PEC performance enhancement is attributed to a more efficient interfacial charge transfer process.
图 10
图 10
LSV plots under a continuous irradiation of BiVO4 porous thin films with and without the Co-Pi modification
Figure 10.
LSV plots under a continuous irradiation of BiVO4 porous thin films with and without the Co-Pi modification
表 2
Calculated electronic parameters from Nyquist plots under illumination and Mott-Schotty plots measured in dark of BiVO4 electrodes by terms of the corresponding model or formula[24]
Table 2.
Calculated electronic parameters from Nyquist plots under illumination and Mott-Schotty plots measured in dark of BiVO4 electrodes by terms of the corresponding model or formula[24]
BiVO4 porous thin films have been prepared through a facile spin-coating route, followed by an air-annealing treatment process for PEC applications. The effects of electrolyte composition and preparation parameters (layer thickness) were investigated, too. The PEC activity of BiVO4 could be enhanced efficiently by adding the hole scavenger SO32- into the electrolyte. Otherwise, it was also found that the BiVO4 film exhibit the optimal PEC performance (~4.3 mA·cm-2) after using a 45 mmol·L-1 precursor, depositing for 5 layers (with a thickness of ~120 nm) and modifying with Co-Pi thin layer, and using a 0.1 mol·L-1 Na2SO4+0.1 mol·L-1 Na2SO3 solution as the electrolyte. Finally, a PEC bio-sensor based on BiVO4 has been fabricated for detecting the GSH, leading to an acceptable sensitivity.
[1]
Chen X B, Li C, Grtzel M, et al. Chem. Soc. Rev., 2012, 41:7909-7937 doi: 10.1039/c2cs35230c
[2]
Ma Y, Wang X L, Jia Y S, et al. Chem. Soc. Rev., 2014, 114(19):9987-10043 doi: 10.1021/cr500008u
[3]
Zhang X F, Zhang B Y, Cao K, et al. J. Mater. Chem. A, 2015, 3:21630-21636 doi: 10.1039/C5TA05838D
[4]
Fujishima H, Honda K. Nature, 1972, 238:37-38 doi: 10.1038/238037a0
[5]
袁素珺, 张青红, 雷芳, 等.无机化学学报, 2015, 31(6):1099-1104YUAN Su-Jun, ZHANG Qing-Hong, LEI Fang, et al. Chinese J. Inorg. Chem., 2015, 31(6):1099-1104
[6]
许贞, 李娟, 李新军.无机化学学报, 2013, 29(3):429-436XU Zhen, LI Juan, LI Xin-Jun. Chinese J. Inorg. Chem., 2013, 29(3):429-436
[7]
Mayer M T, Lin Y, Yuan G, et al. Acc. Chem. Res., 2013, 46(7):1558-1566 doi: 10.1021/ar300302z
[8]
Hong S J, Lee S, Jang J S, et al. Energy Environ. Sci., 2011, 4:1781-1787 doi: 10.1039/c0ee00743a
Figure 2
Typical XRD pattern (a) and optical absorption spectra (b) of BiVO4 porous thin films which were deposited on FTO substrates (5 cycles) directly
Inset displays a typical cross-sectional FESEM image of a BiVO4 thin film prepared in precursor concentration of 45 mmol·L-1 with 5 layers
Figure 3
LSV plots (a) and J-t plots under a chopped irradiation (b) of BiVO4 thin porous films laid in different electrolytes containing of Na2SO3 and Na2SO4
Plots in (b) are measured at a bias of 0.6 V (vs SCE)
Figure 4
Cross-sectional FESEM images of BiVO4 porous thin films fabricated in different precursor concentrations of (a) 15, (b) 30, (c) 45 and (d) 60 mmol·L-1 with a constant cycle number of 5
Figure 5
UV-Vis diffusion absorption spectra of BiVO4 porous thin films fabricated in different concentrations of the precursor solution (from 15 to 60 mmol·L-1) using a constant cycle number of 5
Figure 7
Cross-sectional FESEM images of BiVO4 porous thin films fabricated using a precursor concentration of 45 mmol·L-1 and different layer number of (a) 2, (b) 5, (c) 7 and (d) 10
Figure 9
Amperometric J-t plots (a) and linear relationship between photocurrent density and GSH concentration (b) of a BiVO4 PEC bio-sensor with an addition of GSH to reach the concentrations of 0~1 000 μmmol·L-1 in the electrolyte;
(c) Selectivity experiment by testing in the solutions containing different organic interferents including PBS,
L-Cystenine, L-Tyrosine, Glucose, Cystine, L-Glutamic Acid, AA, where the concentrations of these interferents are 20 μmol·L-1 while that of GSH is 100 μmol·L-1; (d) Possible mechanism for the PEC detection of GSH
Table 2.
Calculated electronic parameters from Nyquist plots under illumination and Mott-Schotty plots measured in dark of BiVO4 electrodes by terms of the corresponding model or formula[24]



 下载:
下载:


 下载:
下载:



