

 Figure 1.
Characteristic reflection groups in XRD pattern for
Figure 1.
Characteristic reflection groups in XRD pattern for
Citation:
MIN Hui-Hua, XU Feng, Lü Yi-Nong, YANG Jing, DING Lin-Fei, SU Fan, ZHU Jian-Min. Orientation Relations and Conversion Matrix Between M3 Supercell and Pseudohexagonal Subcell in Tricalcium Silicate Solid Solution[J]. Chinese Journal of Inorganic Chemistry,
2016, 32(1): 145-152.
doi:
10.11862/CJIC.2016.014

M3型硅酸三钙固溶体超晶胞与伪六方亚晶胞之间的取向关系及转换矩阵
摘要:
通过透射电子显微镜 (TEM) 对M3型硅酸三钙 (C3S) 固溶体进行了研究.基于伪六方亚晶胞 (空间群R3m, a=0.705 9 nm, b=0.705 5 nm, c=2.492 4 nm, α=89.79°, β=90.04°, γ=120.14°) 对选区电子衍射花样 (SAED) 和高分辨透射电子显微镜 (HRTEM) 像进行了分析.结果表明:在M3型硅酸三钙固溶体中, 由超结构产生的衍射斑点沿着[117]H*调制波矢量方向, 具有一维调制结构特征, 并且可以表示为ha*+kb*+lc*+m/[6(-a*+b*+7c*)], 其中m=±1、±2和±3.基于M3超晶胞 (空间群Cm, a=3.310 8 nm, b=0.703 6 nm, c=1.852 1 nm, β=94.137°) 对SAED花样和HRTEM像进行了模拟, 最终确立了M3超晶胞和伪六方亚晶胞之间的取向关系, 即:(600)M3、(020)M3和 (006)M3分别相当于 (112)H、(110)H和 (117)H, [100]M3//[772]H、[010]M3//[110]H以及[001]M3//[111]H.此外, 还确定了M3超晶胞和伪六方亚晶胞之间的转换矩阵.
English
Orientation Relations and Conversion Matrix Between M3 Supercell and Pseudohexagonal Subcell in Tricalcium Silicate Solid Solution
Abstract:
A M3 modification of tricalcium silicate (C3S) solid solution was investigated using transmission electron microscope (TEM). Selected area electron diffraction (SAED) patterns and high resolution transmission electron microscopy (HRTEM) images were analyzed based on a pseudohexagonal subcell (Space group R3m; a=0.705 9 nm, b=0.705 5 nm, c=2.492 4 nm, α=89.79°, β=90.04°, γ=120.14°). Reflections caused by the superstructure were proven to occur along the modulation wave vector [117]H* with one-dimensional type and could be expressed as ha*+kb*+lc*+m/[6(-a*+b*+7c*)], where m=±1, ±2 and±3. SAED patterns and HRTEM images based on the M3 supercell (Space group Cm; a=3.310 8 nm, b=0.703 6 nm, c=1.852 1 nm, β=94.137°) were simulated and finally the orientation relations between M3 supercell and pseudohexagonal subcell were established as follows: (600)M3, (020)M3 and (006)M3 were equivalent to (112)H, (110)H and (117)H respectively, and [100]M3//[772]H, [010]M3//[110]H, and [001]M3//[111]H. Furthermore, the conversion matrix between M3 supercell and pseudohexagonal subcell was established.
-
0 Introduction
Solid solutions of tricalcium silicate (C3S) are one of the principal components of Portland cement clinker, and pure C3S is known to exist in seven modifications: three triclinic (T1, T2, T3), three monoclinic (M1, M2, M3), and one rhombohedral (R). These modifications are reported to appear via successive, reversible phase transitions when heated, occurring in the following sequence[1-3]:
However, the presence of foreign ions may stabilize some of the high-temperature forms at room temperature. For instance, sulphate or magnesium impurities induce the stabilization of M1 and M3 modifications respectively[2, 4]. M3 modification was first reported by Jeffery[5] and the cell parameters were a=3.308 nm, b=0.707 nm, c=1.856 nm, β=94.10°. He determined a pseudohexagonal average structure (Space group R3m; a=0.7 nm, c=2.5 nm) that he considered as a valid approximation for all the true structures. Several years later, Nish and Takéuch[6] established the atomic coordinates of M3 by single-crystal diffraction method. They described an average monoclinic unit cell, referred as < M > (a=1.224 2 nm, b=0.702 7 nm, c=0.925 nm, β=116.04°) which had been successfully deconvoluted to yield the M3 superstructure containing six triplets of tetrahedra in its cell. By using TEM, some relations between pseudohexagonal subcell and M3 supercell were obtained. Groves[7] found that [010]M3 //[110]H (subscripts M3 and H refer to M3 supercell and pseudohexagonal subcell respectively). Urabe et al.[8] found that along [110]H zone axis, the supercell reflections appeared along [117]H* direction with a sequence of 1/[6(-a*+b*+7c*)] and the structure modulation is normal to (117)H with the wavelength of 1.85 nm, which is 6 times greater than the spacing of (117)H. However the detail orientation relations between M3 supercell and pseudohexagonal subcell haven′t been discussed.
The purpose of this work is to describe the superstructure of the M3 modification in detail, and the orientation relations between M3 supercell and pseudohexagonal subcell will be studied by computer simulation.
1 Experimental
Reagent-grade CaCO3, SiO2 and MgO were used as starting materials. CaCO3 and SiO2 were mixed in a molar ratio of 3: 1 and MgO (2.0%, Mass percentage) was added to the mixture with respect to C3S. Raw materials were mixed and ball-milled by a planetary mill at 250 r·min-1 for 4 h and screened through a 120-mesh sieve. Then, the powder was mixed in an agate mortar wetted by ethanol, which was pressed into pellets 30 mm in diameter and 3 mm in thickness. The pellets were heated at 1 500 ℃ for 6 h and then quenched in air. To synthesize a specimen free from dicalcium silicate, the fired pellets were pulverized, pelletized and heated again via the same heating process.
The Resulting product was identified using an XRD device (Model ARL X′TRA, Thermo Electron Co., America) with Cu Kα radiation (λ=0.154 18 nm) operated at 40 kV and 35 mA. The XRD patterns of the C3S solid solution were recorded in a continuous mode at a scanning rate of 0.1°·min-1. The pseudohexagonal subcell parameters of the C3S solid solution were calculated from the peak positions in the XRD pattern and refined by least-squares method.
The specimen was crushed and dispersed in ethanol. The resulting suspension was scooped onto a copper grids covered with holey carbon film; then the specimen was dried under magnesium lamp. SAED patterns and HRTEM images were recorded using a TEM device (Model JEM-2100UHR, JEOL, Tokyo, Japan) at an accelerating voltage of 200 kV. The device was equipped with a double tilt goniometer, where the maximum tilting angle was±20° around the x-and y-axes respectively.
The SAED patterns were calculated using a computer program SingleCrystal (CrystalMaker Software Ltd., U.K.) and the HRTEM images were simulated using a program MacTempas (Total Resolution Inc., U.S.A.). The three-dimensional structure model of the orientation relations between M3 supercell and pseudohexagonal subcell was constructed using the program CrystalMaker (CrystalMaker Software Ltd., U.K.).
2 Results and discussion
2.1 XRD study
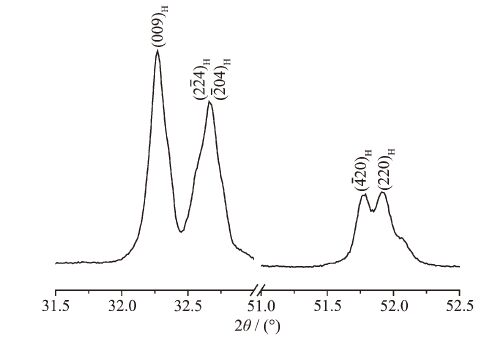
Two conventional angular windows (2θCu=32°~33° and 2θCu=51°~52°) which were proposed by Bigaré et al.[1] are good indicators of the symmetries of the modifications. In this study, the details of the XRD peaks appearing at the two conventional angular windows for the specimen are given in Fig. 1. As shown in the figure, double peaks were observed at the two conventional windows. Compared with the former researches[1, 8-9], this specimen was identified as M3. The pseudohexagonal subcell parameters refined by least-squares method based on XRD data were: Space group R3m; a=0.705 9 nm, b=0.705 5 nm, c=2.492 4 nm, α=89.79°, β=90.04° and γ=120.14°.
Figure 1.
Characteristic reflection groups in XRD pattern for
2.2 TEM study
Traditionally, the structural studies are almost based on XRD data. However, some structural details such as modulated structures are easily to be ignored in analysing because of the low intensity of XRD. Furthermore, the angular windows used to identify the modifications are rather similar with each other; it also causes difficulties in study.
In order to further investigate the M3 superstruc-ture features and establish the orientation relations between M3 supercell and pseudohexagonal subcell, the specimen was examined by TEM. The SAED patterns and HRTEM images recorded along different zone axes and the corresponding simulation results were shown in Fig. 2~4. All the patterns recorded in this study were indexed based on the pseudohexagonal subcell, the simulated SAED patterns were indexed based on the M3 supercell proposed by Torre[10] (Space group Cm; a=3.310 8 nm, b=0.703 6 nm, c=1.852 1 nm, β=94.137°).
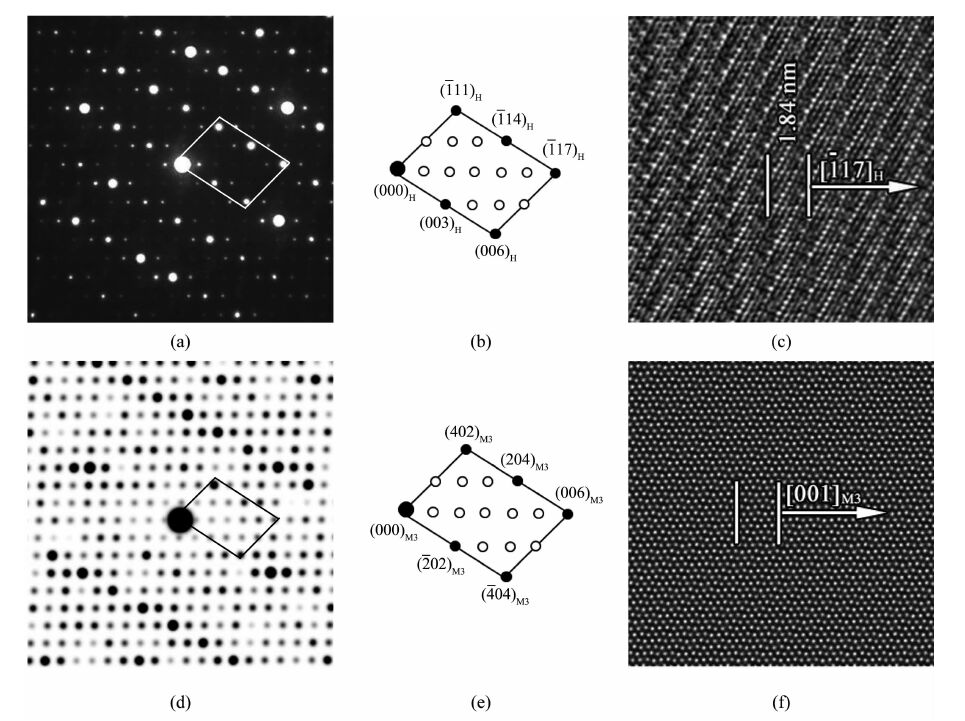 Figure 2.
(a) SAED pattern along [110]H zone axis; (b) Schematic diagram of indices based on pseudohexagonal subcell; (c) HRTEM image corresponding to (a); (d) Simulated SAED pattern along [010]M3 zone axis; (e) Schematic diagram of indices based on M3 supercell; (f) Simulated HRTEM image corresponding to (d)
Figure 2.
(a) SAED pattern along [110]H zone axis; (b) Schematic diagram of indices based on pseudohexagonal subcell; (c) HRTEM image corresponding to (a); (d) Simulated SAED pattern along [010]M3 zone axis; (e) Schematic diagram of indices based on M3 supercell; (f) Simulated HRTEM image corresponding to (d)
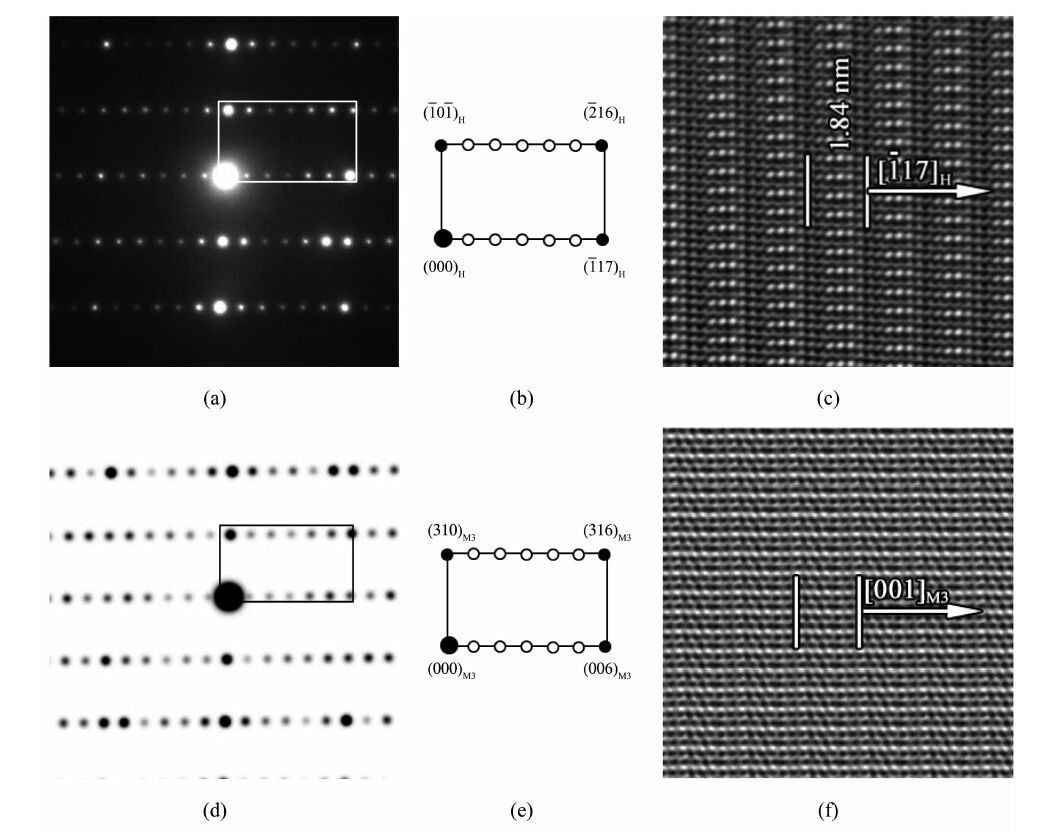 Figure 3.
(a) SAED pattern along [181]H zone axis; (b) Schematic diagram of indices based on pseudohexagonal subcell; (c) HRTEM image corresponding to (a); (d) Simulated SAED pattern along [130]M3 zone axis; (e) Schematic diagram of indices based on M3 supercell; (f) Simulated HRTEM image corresponding to (d)
Figure 3.
(a) SAED pattern along [181]H zone axis; (b) Schematic diagram of indices based on pseudohexagonal subcell; (c) HRTEM image corresponding to (a); (d) Simulated SAED pattern along [130]M3 zone axis; (e) Schematic diagram of indices based on M3 supercell; (f) Simulated HRTEM image corresponding to (d)
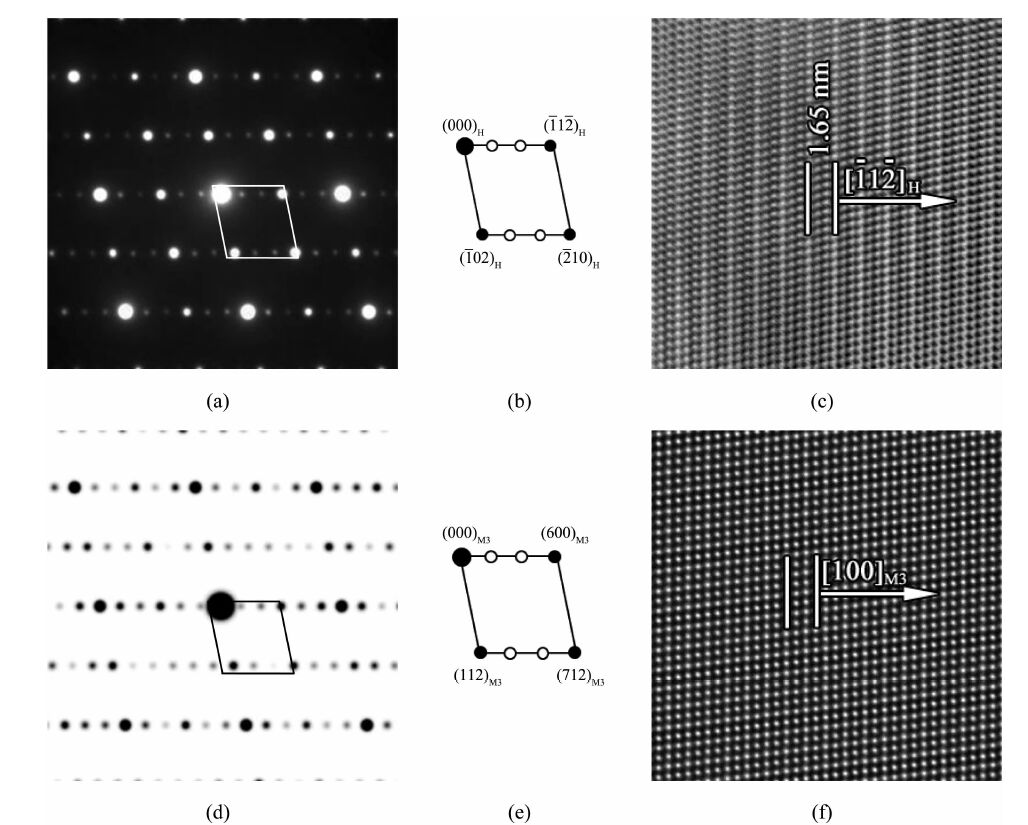 Figure 4.
(a) SAED pattern along [241]H zone axis; (b) Schematic diagram of indices based on pseudohexagonal subcell; (c) HRTEM image corresponding to (a); (d) Simulated SAED pattern along [021]M3 zone axis; (e) Schematic diagram of indices based on M3 supercell; (f) Simulated HRTEM image corresponding to (d)
Figure 4.
(a) SAED pattern along [241]H zone axis; (b) Schematic diagram of indices based on pseudohexagonal subcell; (c) HRTEM image corresponding to (a); (d) Simulated SAED pattern along [021]M3 zone axis; (e) Schematic diagram of indices based on M3 supercell; (f) Simulated HRTEM image corresponding to (d)
Fig. 2(a) shows the SAED pattern recorded along [110]H zone axis and the corresponding indexing reciprocal planes are shown in Fig. 2(b). Reflections with higher intensities were responsible for the pseudohexagonal subcell; those with lower intensities (satellite reflections) were attributable to the M3 supercell. The satellite reflections show modulated structure feature with 6 times of subcell dimension along [117]H* and could be expressed as ha*+kb*+lc*+m/[6(-a*+b*+7c*)], where m=±1, ±2 and±3. It was consistent with the results reported by Groves[7] and Urabe[8]. Fig. 2(c) shows the corresponding HRTEM image, wavy contrasts were observed with a repeat of 1.84 nm parallel to (117)H, which is 6 times greater than the (117)H spacing. Based on the atomic coor-dinates established by Torre[10], the SAED pattern and HRTEM image simulated along [010]M3 zone axis under a defocus value of-60 nm and thickness of 60 nm are shown in Fig. 2(d) and (f) respectively. It is found that the simulated results were consistent with those obtained from experiments. The corresponding reciprocal planes indexed based on M3 supercell are shown in Fig. 2(e), which reveals that (117)H, (111)H and (003)H are equivalent to (006)M3, (402)M3 and (202)M3 respectively and [010]M3//[110]H.
The SAED pattern in Fig. 3(a) was taken along [181]H zone axis and the corresponding indexing reciprocal planes are shown in Fig. 3(b). It is found that the modulated structure feature along this zone axis is the same as it was found along [110]H zone axis, which is 6 times of subcell dimension along [117]H* and the satellite reflections could be also expressed as ha*+kb*+lc*+m/[6(-a*+b*+7c*)], where m=±1, ±2 and±3. Fig. 3(c) shows the corresponding HRTEM image, and the wavy contrasts were observed with a repeat of 1.84 nm parallel to (117)H, which is 6 times greater than the (117)H spacing. The SAED pattern and HRTEM image along [130]M3 zone axis were simulated under a defocus value of-60 nm and thickness of 60 nm and are shown in Fig. 3(d) and (f) respectively. By contrast, it is found that the simulated results were in good agreement to that observed in experiments. The corresponding reciprocal planes indexed based on M3 supercell are shown in Fig. 3(e), which reveals that (117)H, (101)H and (216)H are equivalent to (006)M3, (310)M3 and (316)M3 respectively and [181]H//[130]M3.
Fig. 4(a) and (b) show the SAED pattern recorded along [241]H zone axis and the corresponding indexing reciprocal planes respectively. In this pattern, the satellite reflections show modulated structure feature with 3 times of subcell dimension along [112]H* and they could be expressed as ha*+kb*+lc*±1/[3(-a*+b*-2c*)]. Fig. 4(c) shows the corresponding HRTEM image, as shown in the figure, wavy contrasts were observed with a repeat of 1.65 nm parallel to (112)H, which is 3 times greater than the (112)H spacing. The SAED pattern and HRTEM image along [021]M3 zone axis were simulated under a defocus value of-60 nm and thickness of 60 nm and are shown in Fig. 3(d) and (f) respectively and they were consistent with those obtained from experiments. The corresponding reciprocal planes indexed based on M3 supercell are shown in Fig. 4(e), which reveals that (102)H, (210)H and (112)H are equivalent to (112)M3, (712)M3 and (600)M3 respectively and [241]H//[021]M3.
Urabe et al.[11] suggested that the coordinates of the superstructure reflections in reciprocal space could be described by the modulated wave vector with the minimum value and he found the one-dimensional type modulated wave vector in T1 superstructure. In this work, the vector along [117]H* with an interval of 0.59 nm-1 is the minimum value in the experiment.
Fig. 5 shows the schematic diagram of indices based on pseudohexagonal subcell along [110]H zone axis. As shown in the figure, the coordinates of 1/[3(-a* +b*-2c*)] for the satellite reflections (it is also observed along [241]H zone axis) could be expressed as-3c*+1/[3(-a*+b*+7c*)]. It reveals that the reflec-tions at 1/[3(-a*+b*-2c*)] is a satellite occurs at the 1/3 place between [003]H* and [114]H*, where the line passing through those two points is parallel to the direction of [117]H*. All the satellite reflections observed along other zone axes could be also described in the same way, and could be expressed as: ha*+kb*+lc*+m/[6(-a*+b*+7c*)], where m=±1, ±2 and±3. Therefore, the structural modulation in M3 had the character of a one-dimensional type.
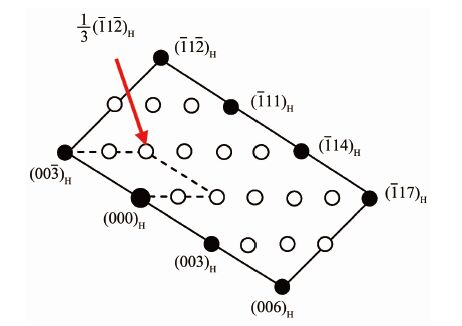 Figure 5.
Schematic diagram of indices based on pseudohexagonal subcell along [110]H zone axis
Figure 5.
Schematic diagram of indices based on pseudohexagonal subcell along [110]H zone axis
2.3 Orientation relations derivation
Whatever the experimental technique, TEM or XRD, the superstructures produce additional weak characteristic Bragg lines. Urabe et al.[11] did an excellent work that they indexed various SAED patterns recorded along different zone axes and finally established the plane orientation relations between pseudohexagonal subcell and T1 supercell. Groves[12] proposed a conversion matrix between M3 supercell and pseudohexagonal subcell planes based on TEM data, but it was not confirmed in later researches. In this work, the TEM results show that (117)H, (112)H and (101)H are equivalent to (006)M3, (600)M3 and (310)M3 respectively. Therefore, the detail orientation relations between M3 supercell and pseudohexagonal subcell planes can be derived via calculation based on vector relations, and they are listed in Table 1. For instance:
In this study, only one basic crystal axis orientation relationship was directly established from Fig. 2 that [010]M3//[110]H. Though the crystal axes orientation relations of [100]M3 and [001]M3 with respect to pseudohexagonal subcell couldn′t be established directly from TEM data in this work, they can be derived from Table 1 based on zone law. For instance, (600)M3 and (020)M3 belong to [001]M3 zone axis; (112)H and (110)H belong to [111]H zone axis, so we can conclude that [001]M3//[111]H. In the same way, all the crystal axes orientation relations between M3 supercell and pseudohexagonal subcell could be established and they are listed in Table 2. Meanwhile, the conversion matrix between M3 supercell and pseudohexagonal subcell is established as following which disagrees with Groves′ result[12]:
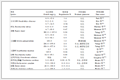 Table 1.
Plane orientation relations between M3 supercell and pseudohexagonal subcell
Table 1.
Plane orientation relations between M3 supercell and pseudohexagonal subcell
 Table 1. Plane orientation relations between M3 supercell and pseudohexagonal subcell
Table 2.
Crystal axes orientation relations between M3 supercell and pseudohexagonal subcell
Table 1. Plane orientation relations between M3 supercell and pseudohexagonal subcell
Table 2.
Crystal axes orientation relations between M3 supercell and pseudohexagonal subcell
 Table 2. Crystal axes orientation relations between M3 supercell and pseudohexagonal subcell
In order to directly observe the detail orientation relations between M3 supercell and pseudohexagonal subcell, a three-dimensional structure model was constructed and it is shown in Fig. 6. It reveals that the pseudohexagonal subcell could be considered as an average structure in C3S and it extends to yield the supercell along specific directions according to the relations listed in Table 1 and Table 2.
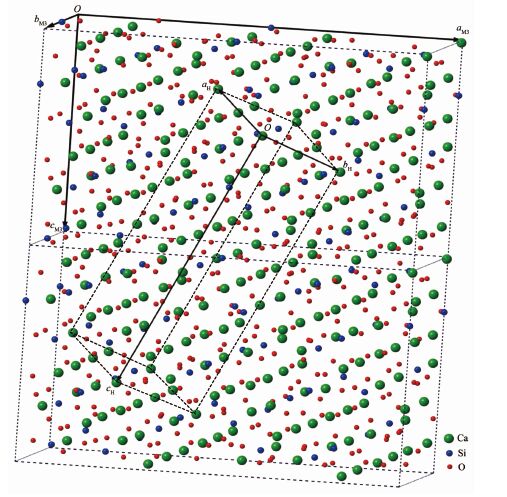 Figure 6.
Orientation relations between M3 supercell and pseudohexagonal subcell
Figure 6.
Orientation relations between M3 supercell and pseudohexagonal subcell
3 Conclusions
C3S solid solution of M3 was prepared by doping MgO (2.0%, Mass percentage). SAED patterns were analyzed using the peseudohexagonal subcell with the following parameters: space group R3m; a=0.705 9 nm, b=0.705 5 nm, c=2.492 4 nm, α=89.79°, β=90.04° and γ=120.14°. Reflections caused by the superstructure were proven to occur along the modulation wave vector [117]H* with one-dimensional type and could be expressed as ha*+kb*+lc*+m/[6(-a*+b*+7c*)], where m=±1, ±2 and±3. The orientation relations between M3 supercell and pseudohexagonal subcell were established that (600)M3, (020)M3 and (006)M3 are equivalent to (112)H (110)H, and (117)H respectively, and [100]M3//[772]H, [010]M3//[110]H, and [001]M3//[111]H. Furthermore, the conversion matrix between M3 supercell and pseudohexagonal subcell is established.
-
-
[1]
Bigaré M, Guinier A, Mazières C, et al. J. Am. Ceram. Soc., 1967, 50(11):609-619 doi: 10.1111/jace.1967.50.issue-11
-
[2]
Maki I, Chrom S. Il Cemento, 1978, 3:252-274
-
[3]
Maki I, Kato K. Cem. Concr. Res., 1982, 12(1):93-100 doi: 10.1016/0008-8846(82)90103-X
-
[4]
Maki I, Goto K. Cem. Concr. Res., 1982, 12(3):301-308 doi: 10.1016/0008-8846(82)90078-3
-
[5]
Jeffery J W. Acta Crystallogr., 1952, 5:26-35 doi: 10.1107/S0365110X52000083
-
[6]
Nish F, Takèuchi Y, Maki I. Z. Kristallogr., 1985, 172:297-314 doi: 10.1524/zkri.1985.172.3-4.297
-
[7]
Sinclair W, Groves G. J. Am. Ceram. Soc., 1984, 69(5):325-330
-
[8]
Urabe K, Nakano H, Morita H. J. Am. Ceram. Soc., 2002, 85 (2):423-429
-
[9]
Courtial M, de Noirfontaine M N, Dunstetter F, et al. Powder Diffr., 2003, 18(10):7-15
-
[10]
de La Torre á G, Bruque S, Campo J. Cem. Concr. Res., 2002, 32(9):1347-1356 doi: 10.1016/S0008-8846(02)00796-2
-
[11]
Urabe K, Shirakami T, Iwashima M. J. Am. Ceram. Soc., 2000, 83(5):1253-1258
-
[12]
Hudson K E, Groves W. Cem. Concr. Res., 1982, 12(1):61-68 doi: 10.1016/0008-8846(82)90099-0
-
[1]
-

Figure 1 Characteristic reflection groups in XRD pattern for
Peaks of the specimen were indexed based on pseudohexagonal subcell

Figure 2 (a) SAED pattern along [110]H zone axis; (b) Schematic diagram of indices based on pseudohexagonal subcell; (c) HRTEM image corresponding to (a); (d) Simulated SAED pattern along [010]M3 zone axis; (e) Schematic diagram of indices based on M3 supercell; (f) Simulated HRTEM image corresponding to (d)
C3S doped with MgO (2.0%, Mass percentage) "●" reflections from pseudohexagonal subcell and "○" reflections from M3 supercell

Figure 3 (a) SAED pattern along [181]H zone axis; (b) Schematic diagram of indices based on pseudohexagonal subcell; (c) HRTEM image corresponding to (a); (d) Simulated SAED pattern along [130]M3 zone axis; (e) Schematic diagram of indices based on M3 supercell; (f) Simulated HRTEM image corresponding to (d)
"●" reflections from pseudohexagonal subcell and "○" reflections from M3 supercell

Figure 4 (a) SAED pattern along [241]H zone axis; (b) Schematic diagram of indices based on pseudohexagonal subcell; (c) HRTEM image corresponding to (a); (d) Simulated SAED pattern along [021]M3 zone axis; (e) Schematic diagram of indices based on M3 supercell; (f) Simulated HRTEM image corresponding to (d)
"●" reflections from pseudohexagonal subcell and "○" reflections from M3 supercell

Figure 5 Schematic diagram of indices based on pseudohexagonal subcell along [110]H zone axis

Figure 6 Orientation relations between M3 supercell and pseudohexagonal subcell
Constructed by CrystalMaker based on the atomic coordinates of M3 supercell determined by Torre[10]
Table 2. Crystal axes orientation relations between M3 supercell and pseudohexagonal subcell
 下载: 导出CSV
-


 扫一扫看文章
计量
- PDF下载量: 0
- 文章访问数: 1189
- HTML全文浏览量: 181
 下载:
下载:

