

 Figure Scheme 1.
Illustration of synthesis for α-MnO2
Figure Scheme 1.
Illustration of synthesis for α-MnO2
Citation:
XU Shan, LU Lin, LIU Lian, LUO Yi-Wen, WANG Shi-Quan, LIU Jian-Wen, LI Guo-Hua, FENG Chuan-Qi. Synthesis and Electrochemical Characteristics of Clew-like α-MnO2 as Cathode Material for Lithium Ion Battery[J]. Chinese Journal of Inorganic Chemistry,
2016, 32(1): 124-130.
doi:
10.11862/CJIC.2016.013

锂离子电池正极材料线团状α-MnO2的合成及电化学性能
English
Synthesis and Electrochemical Characteristics of Clew-like α-MnO2 as Cathode Material for Lithium Ion Battery
Abstract:
Clew-like α-MnO2 was synthesized by a solution phase synthesis method using MnSO4 and (NH4)2S2O8 as reactants and Ag+ ions as catalyst. The synthetic materials were characterized by XRD, SEM and TEM. It was found that the reaction temperature and reaction time have much influence on the crystallinity and morphology of the products. The electrochemical properties of the final products were tested by galvanostatic charge/discharge profile measurement and cyclic voltammetry (CV). The results show that the product prepared at 25 ℃ for 2 days as cathode material for lithium ion battery, exhibits excellent cycling stability (124 mAh·g-1 after 100 cycles) due to its unique morphology. The clew-structure α-MnO2 could be a potential cathode material for the application of lithium ion batteries (LIBs).
-
Key words:
- clew-like α-MnO2
- / solution phase synthesis method
- / lithium ion battery
-
The cost efficiency and environmental friendl-iness of cathode materials is currently a major focus in battery research [1-2]. In this regard, manganese oxides can meet all requirements and offer other desirable features, such as convenient preparation and abundant availability [3]. Manganese dioxide is a widely-used material in electrochemical cells for its abundance and benignity. Due to the different interlink of the octahedral MnO6 moiety, α, β, γ, δ and λ forms of MnO2 are classified into three groups according to the tunnel structures in one, two or three dimensions [4-5], of which the α, β and γ forms are 1D tunnels. The δ and λ forms are 2D layered compound and 3D spinel structure, respectively [4, 6]. The properties of MnO2 largely depend on it crystal structure [4, 7-8]. In recent years, 1D nanostructures have been demonstrated to exhibit superior electrical, optical, mechanical, and thermal properties, showing their potential applica-tions as building blocks in microscale devices [9-13]. For example, α-MnO2 has been widely used as magnetic materials [14-15], electrode materials in batteries [16-19] and supercapacitors [20-21]. For Li/MnO2 battery, among the polymorphs of MnO2, α-MnO2 has large (2×2) tunnels existing in the crystalline lattice which can facilitate the Li+ intercalation and de-intercalation within these systems thereby enhancing the capacity perfor-mance [18, 23-24]. Utilization of 1D α-MnO2 could be advantageous in batteries as they not only provide large tunnels but also facilitate shorter diffusion path lengths and stress relaxation during intercalation/de-intercalation process leading to a higher rate capabi-lity and cyclic stability [18, 22, 25-26]. So far, many methods for synthesis of MnO2 have been developed, mainly including hydrothermal method and solution phase synthesis method. Li et al. [9] have reported that a novel α-MnO2 core-shell structure could be obtained by introducing a homogeneous catalyst of an Ag+ solution [27] to prepare α-MnO2 with a specific urchin-like structure. The diameters of these urchin-like structures are 1.6~2.0 μm, which densely aligned with nanorods with uniform diameters of 30~40 nm. In view of the special morphology of the product, it is likely to have high discharge specific capacity and stable cycling performance as cathode material in lithium ion batteries (LIBs).
In this work, we synthesized α-MnO2 via solution-phase method, using MnSO4 and (NH4)2S2O8 as reactants and Ag+ ions as catalyst. The effects of reaction temperature and time on the crystal structure, the morphology and the electrochemical performance of the products were investigated.
1 Experimental
1.1 Synthesis and characterization of the samples
The synthesis process is shown in Scheme 1, modified by the previous literature [9]. The solutions were prepared by mixing 0.507 g MnSO4·H2O (3 mmol) and 0.684 6 g (NH4)2S2O8 (3 mmol) in 50 mL distilled water, 1 mL AgNO3 (0.059 mol·L-1) solution was added in the above solution. After the homogeneous solution reacted for 2 days at 0 ℃(25, 45, 65 ℃), or reacted at 25 ℃ for 1 day (3, 5 days), the products were washed with distilled water and ethanol with centrifugal filtration for several times, respectively, and then dried in a vacuum at 60 ℃ for 5 h. Then α-MnO2 products were obtained (designated as α-MnO2-0 ℃-2 d, α-MnO2-25 ℃-2 d, α-MnO2-45 ℃-2 d, α-MnO2-65 ℃-2d, α-MnO2-25 ℃-1 d, α-MnO2-25 ℃-3 d, α-MnO2-25 ℃-5 d, respectively).
Figure Scheme 1.
Illustration of synthesis for α-MnO2
1.2 General characterization of the samples
The structure and crystallinity of the samples were characterized using an X-ray diffractometer (XRD; Rigaku X-ray diffractometer) with Cu Kα radiation source (λ=0.150 6 nm) under a voltage of 40 kV and a current of 30 mA. The particle sizes of the samples were observed by scanning electron microscopy (SEM; JEOL JSM, 6510 V) and transmission electron microscopy (TEM; FEI Tecnai G20).
1.3 Electrochemical characterization of the samples
The electrochemical characterizations were performed using coin cells (CR2016). The anode was prepared by dispersing 70% as-prepared powders and 20% carbon black in 10% polyvinylidene fluoride (PVDF) solution. The mixture was rolled into a film and was dried at 120 ℃ for 24 h in vacuum. The film was cut to size (1 cm2) and pressed onto a nickel mesh substrate (1 cm2). Coin test cells were assembled in an argon-filled glove box, with a metallic Li counter elec-trode, Celgard 2400 microporous membrane separator, and the electrolyte was a solution of l mol·L-1 solution of LiPF6 in ethylene carbonate (EC) and diethyl carbonate (DEC) (1:1, V/V). The cyclic voltammetry (CV) was measured by an electrochemical workstation (CHI660E) between 1.5 and 4.2 V at a scan rate of 0.1 mV·s-1. The electrochemical impedance spectros-copy (EIS) measurements were performed with CHI660E over the frequency range of 0.01~100 kHz with an amplitude of 3 mV. These cells were galva-nostatically charged and discharged in the voltage range of 1.5~4.2 V at the current density of 50 mA·g-1 to measure the electrochemical response. The current densities used were from 50 to 500 mA·g-1.
2 Results and discussion
The chemical reaction in the homogeneous catalytic route to synthesize various α-MnO2 structures could be described as follows [9]:
Without the existence of an Ag+ ions solution or Ag foil, no product was formed at room temperature. It was known that the role of catalyst Ag+ could reduce the potential energy of this chemical reaction so that the reaction could proceed with the existence of catalyst Ag+ even at room temperature [9].
The XRD patterns of the as-prepared α-MnO2 are shown in Fig. 1(a, b), which indicates that the products can be indexed as α-MnO2 (a=0.280 0 nm, b=0.280 0 nm, c=0.445 0 nm; Space group P63/mmc (194), PDF #300820). The crystallinity of the samples is not very good because the reaction temperature is very low (0~65 ℃). It can be seen with the increase of temperature and time, the crystallinity of the samples are getting better, which gives the fact that reaction temperature and reaction time have influenced on the crystallinity of materials. The structure of α-MnO2 is hollandite structure, which is based on rhombic manganese ore structure. It is generally believed to adopt an octahedron structure in which Mn2+ occupies the center of octah-edron and O2- is distributed over octahedral sites, shown in Fig. 1(c). [MnO6] octahedron forms double-stranded along the axis direction, the octahedron with double-chain shares apex angle with adjacent chains to form the T (2×2) tunnel structure [18, 22-23]. Tunnel sectional area becomes bigger because of its double-chain structure, which makes it accommodate ions such as Li+ ions. It indicates that α-MnO2 maybe a potential cathode material for LIBs.
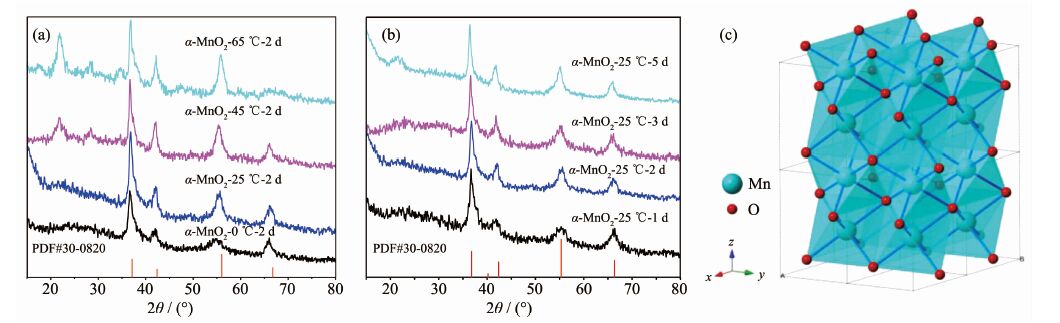 Figure 1.
XRD patterns of the samples prepared at various temperatures (a) and for various times at 25 ℃ (b); (c) Crystal structure of as-prepared α-MnO2
Figure 1.
XRD patterns of the samples prepared at various temperatures (a) and for various times at 25 ℃ (b); (c) Crystal structure of as-prepared α-MnO2
The SEM images of the samples are shown in Fig. 2(a~g). The insets of the SEM images are the higher magnification SEM images. It can be observed that nanowire with different thickness is the smallest unit of the microstructure. The sample α-MnO2-0 ℃-2 d (Fig. 2(a)) presents the inchoate mircrospheres composed of nanowires with the size of 20~25 nm because of the low reaction temperature. With the increase of the temperature, microspheres were formed gradually, shown in Fig. 2(b, c). The microspheres fell apart into nanowires with the size of 30~40 nm when the reaction temperature rose to 65 ℃ (Fig. 2(d)). With the increase of the reaction time, the morphology of the samples gradually became microspheres winded with nanowires instead of microspheres with diameter of 1 μm. And the longer the time is, the thicker the nanowires are, shown in Fig. 2(b, e, f, g). Thus it can be seen that reaction time is the key factor for the formation of nanowires. The sample α-MnO2-25 ℃-2 d exhibits a mess of clews composed of the thinnest nanowires with the size of 15~20 nm, which can be observed at higher magnifications images (Fig. 2(b)). The TEM images of α-MnO2-25 ℃-2 d are shown in Fig. 2(h), present a clearer morphology with the aggregation of many nanowires. The average diameter of clews is about 1μm. There are many interspaces among nanowires, which are in favor for embedding of Li+ ions. The nanometered structure of α-MnO2 means that the Li+ ions diffusion path is shortened and the electrochemical properties are enhanced for LIBs.
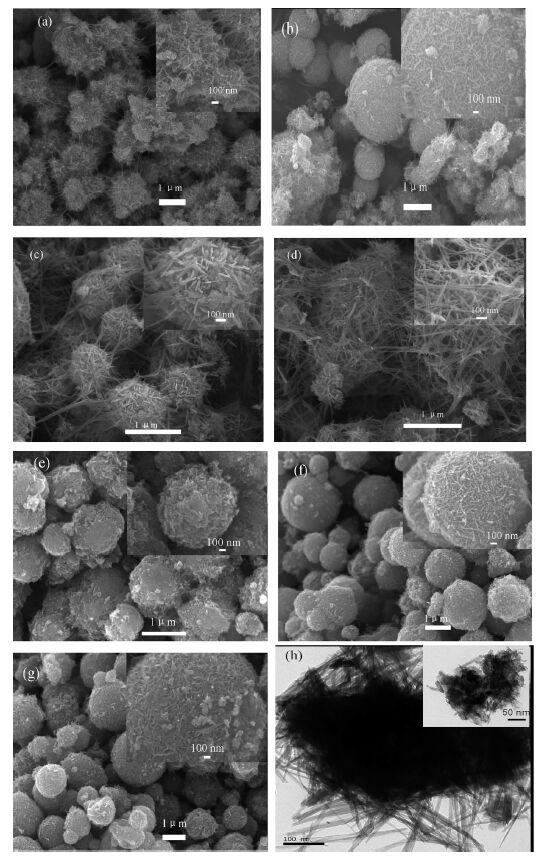 Figure 2.
SEM images of the samples: (a) α-MnO2-0 ℃-2 d, (b) α-MnO2-25 ℃-2 d, (c) α-MnO2-45 ℃-2 d, (d) α-MnO2-65 ℃-2 d, (e) α-MnO2-25 ℃-1 d, (f) α-MnO2-25 ℃-3 d, (g) α-MnO2-25 ℃-5 d; TEM images: (h) α-MnO2-25 ℃-2 d
Figure 2.
SEM images of the samples: (a) α-MnO2-0 ℃-2 d, (b) α-MnO2-25 ℃-2 d, (c) α-MnO2-45 ℃-2 d, (d) α-MnO2-65 ℃-2 d, (e) α-MnO2-25 ℃-1 d, (f) α-MnO2-25 ℃-3 d, (g) α-MnO2-25 ℃-5 d; TEM images: (h) α-MnO2-25 ℃-2 d
Fig. 3 shows the typical charge/discharge curves of the as-prepared electrodes between 1.5 and 4.2 V with a current density of 50 mA·g-1, respectively. In the discharge curves, a voltage plateaus near at 2.8 V are clearly observed in Fig. 3(a~g). It can be found that the initial discharge capacities of α-MnO2 prepared at 0, 25, 45, 65 ℃ for 2 days increase from 102 to 135 mAh·g-1 gradually shown in Fig. 3(a~d). However, the capacities of the samples (α-MnO2-0 ℃-2 d, α-MnO2-45 ℃-2 d, α-MnO2-65 ℃-2 d) fade sharply except for α-MnO2-25 ℃-2 d, which delivers an initial discharge capacity of 124 mAh·g-1 (Fig. 3(b)). The discharge capacity increases to 134 mAh·g-1 after 20 cycles, 136 mAh·g-1 after 50 cycles, and stabilizes at 124 mAh·g-1 after 100 cycles. Obviously, too short/long reaction time also has great influence on electrochemical performance of the products shown in Fig. 3(b, e, f, g). The samples (α-MnO2-25 ℃-1 d, α-MnO2-25 ℃-3 d, α-MnO2-25 ℃-5 d) exhibit a incre-mental initial discharge capacity (93~134 mAh·g-1), however, they all fade obviously. These phenomena can be explained by their crystallinities and morphol-ogies. The microspheres were formed gradually with the rising reaction temperature. The shapes of the microspheres are imperfect and the crystallinity is worse when the temperature was too low, which leads to the low capacity of the product. When the reaction temperature was too high, the as-obtained samples such as α-MnO2-65 ℃-2 d, have thicker nanowires and better crystallinity, resulting in a lower capacity of the product. From the point in reaction time, for α-MnO2-25 ℃-1 d, a worse electrochemical performance may be due to the lack of nanowires. For α-MnO2-25 ℃-3 d/5 d electrodes, they exhibit low capacities and unstable electrochemical performance, which can be attributed to their thicker nanowires aggregation. The sample α-MnO2-25 ℃-2 d exhibits a highest discharge capacity and best cycling stability due to its smaller size of nanowires, appropriate crystallinity. And the existence of the interspace can increase the electrode/electrolyte contact, shorten the diffusion length of both Li+ ions and electrons, and effectively buffer the volume expansion during the lithiation/delithiation process.
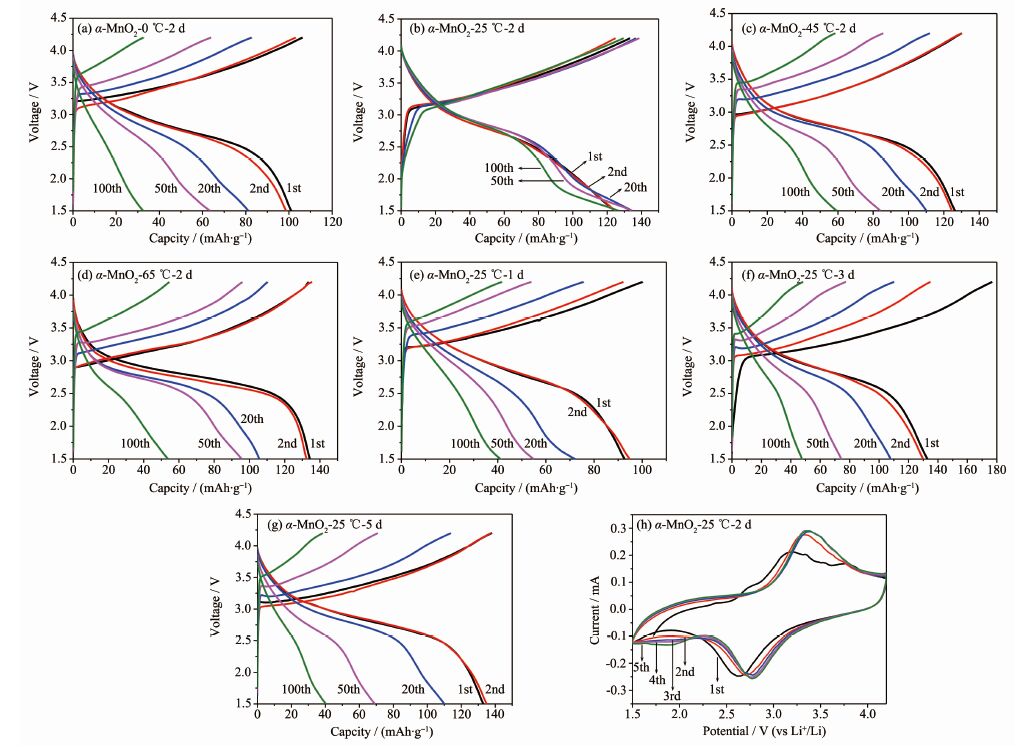 Figure 3.
Charge/discharge curves of as-prepared samples (a~g) and CV curves of α-MnO2-25 ℃-2 d (h)
Figure 3.
Charge/discharge curves of as-prepared samples (a~g) and CV curves of α-MnO2-25 ℃-2 d (h)
Based on the good electrochemical property of the as-prepared α-MnO2-25 ℃-2 d, it was further studied as cathode material for LIBs. Fig. 3(h) shows the cyclic voltammograms (CVs) of α-MnO2-25 ℃-2 d at a scan rate of 0.1 mV·s-1 between 1.5 and 4.2 V. The reactions associated with the redox processes are given below [28]:
In the first charging process, a reductive peak appears at 2.61 V and an oxidative peak appears at 3.12 V, which can be indexed to the formation of Mn, shown in Eq.(4, 5). Then Eq.6 occurs in the subsequent four cycles, all the redox peaks repeat well except for the slight shift to higher potential, indicating good redox reversibility and structural stability (Fig. 3(h)).
The cycling performances of the samples are shown in Fig. 4(a). The specific capacity of the samples of α-MnO2-0 ℃-2 d, α-MnO2-45 ℃-2 d, α-MnO2-65 ℃-2 d, α-MnO2-25 ℃-1 d, α-MnO2-25 ℃-3 d, α-MnO2-25 ℃-5 d electrodes show obvious decrease with cycling, from 101, 126, 132, 92, 132, 133 mAh·g-1 for the first cycle to 33, 60, 61, 39, 46, 42 mAh·g-1 for the 50th cycle. It is obvious that the α-MnO2-25 ℃-2 d electrode shows much stable cycling performance with higher specific capacities at the same cycle with the same current density, as compared with the other samples, which further indicates that the reaction temperature and reaction time have much influence on the electrochemical properties of the products. The coulombic efficiency of the samples is shown in Fig. 4(b). The values of the coulombic efficiency are at around 100%, which indicates discharge/charge process has well conducted in these electrodes. Fig. 4(c) shows the rate capacities and coulombic efficiency of the α-MnO2-25 ℃-2 d electrode of various current densities. The discharge capacity is 123 mAh·g-1 at 50 mA·g-1 after 20 cycles, and this value is slowly reduced to 76 and 31 mAh·g-1 when the current rate is conse-cutively set at 100 and 500 mA·g-1, respectively. At last, when the current rate returns to initial 50 mA·g-1, the final discharge capacity is 95 mAh·g-1, recovering 78% of the initial capacity. The discharge/charge process has well conducted when the current densities are 50, 100 and 500 mA·g-1.
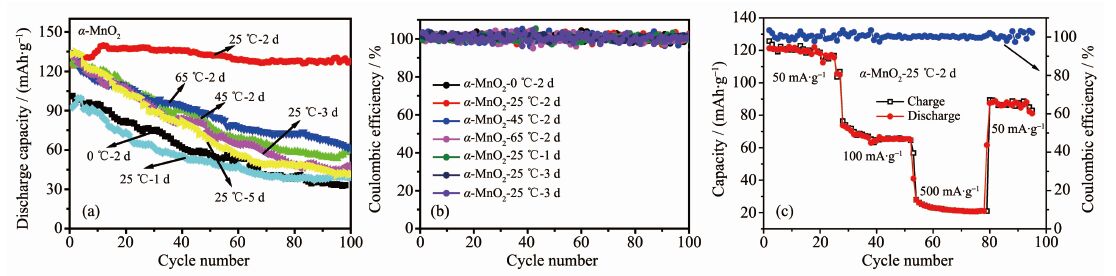 Figure 4.
(a) Cycling performances of the samples; (b) Coulombic efficiency of the samples; (c) Rate capacity and coulombic efficiency of α-MnO2-25 ℃-2 d at different current densities (50, 100, 500 mA·g-1)
Figure 4.
(a) Cycling performances of the samples; (b) Coulombic efficiency of the samples; (c) Rate capacity and coulombic efficiency of α-MnO2-25 ℃-2 d at different current densities (50, 100, 500 mA·g-1)
The electrochemical impedance spectra (EIS) of different electrodes, which are collected before the electrochemical properties testing under open voltage conditions, shown in Fig. 5(a). For the α-MnO2-2 d (0~65 ℃) electrodes, the diameters of the semicircle of the curves are 156.83, 61.89, 77.82 and 70.61 Ω and for the α-MnO2-25 ℃(1~5 d) electrodes, the diameters of the semicircle of the curves are 226.38, 61.89, 87.29 and 108.30 Ω at the frequency of 12.1 Hz, respectively. Among all the samples, the α-MnO2-25 ℃-2 d has the smallest charge transfer resistance, the highest conductivity and Li+ is apt to deintercalate and intercalate, indicating it has the best electro-chemical performance. The convective change of Li+ from high frequency to low frequency is the migration of Li+ in the electrolyte, the conversion of Li+ in the interface and the diffusion of Li+ in the solid phase. The diffusion process of Li+ in the solid phase is a slow process, which becomes a control step. The larger the diffusion coefficient is, the better the high-rate discharge performance is. The remaining inclined lines in the low frequency range in the EIS spectra are attributed to the Warburg impedance (Zw). As revealed in Fig. 5(b), the Warburg coefficient (Aw) is equal to the slope of the Z′ vs ω-1/2 line at low frequency, where ω is the angular frequency of the alternating current. The numerical value of the Li+ diffusion coefficient in the electrode can be estimated from the following equation [29-30]:
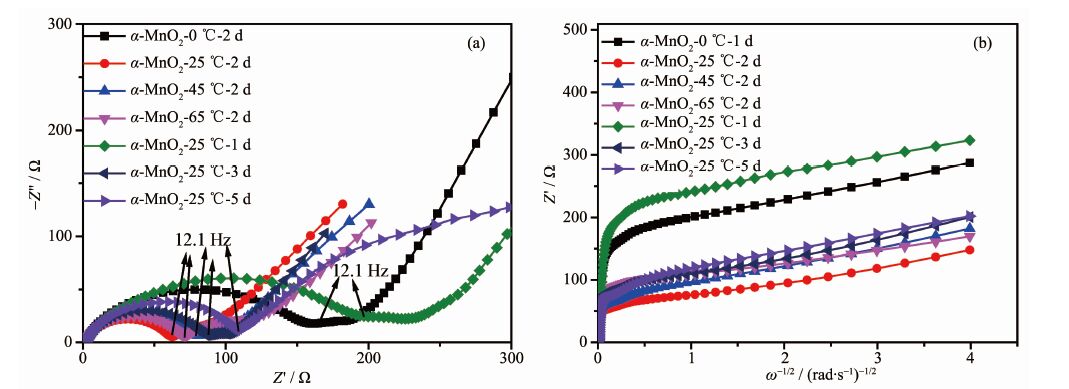 Figure 5.
(a) Electrochemical impedance spectra of the samples; (b) Linear fitting of Warburg impedance of the samples
Figure 5.
(a) Electrochemical impedance spectra of the samples; (b) Linear fitting of Warburg impedance of the samples
where Vm is the molar volume of the material, S is the apparent surface area of the electrode, and dE/dx is the slope of the open-circuit potential vs the mobile ion concentration x at each x value. Hence, the numerical values of Vm, S, and dE/dx are constant for the model test cells, and the Li+ diffusion coefficient is in direct proportion to (1/Aw)2 [30]. The Warburg coe-fficients (Aw) of the above cells are 71.69, 32.03, 41.99, 38.13, 85.38, 44.57 and 49.47 Ω·s-1/2, respe-ctively, confirming that the ionic conductivity of α-MnO2-25 ℃-2 d is better than that of other materials according to the Eq.7. These results are consistent with the electrochemical properties of the above electrodes.
3 Conclusions
Clew-like α-MnO2 was synthesized by a facile solution phase method using MnSO4 and (NH4)2S2O8 as reactants and Ag+ ions as catalyst. The results reveal that the reaction time and temperature play crucial roles to synthesize products with different morphol-ogies, which consequently influence the electroche-mical properties of the products. The results show that the product α-MnO2 prepared at 25 ℃ for 2 days as cathode material for LIBs, exhibits a highest reversible capacity and excellent cycling stability (124 mAh·g-1 after 100 cycles) due to its uniform microspheres composed of many thinner nanowires and appropriate crystallinity. The clew-like α-MnO2 could be a potential cathode material for the application of LIBs.
-
-
[1]
Minakshi M. J. Solid State Electrochem., 2009, 13:1209-1214 doi: 10.1007/s10008-008-0648-6
-
[2]
Tu F, Wu T, Liu S, et al. Electrochim. Acta, 2013, 106:406-410 doi: 10.1016/j.electacta.2013.05.108
-
[3]
Dose W M, Donne S W. Electrochim. Acta, 2013, 105:305-313 doi: 10.1016/j.electacta.2013.04.011
-
[4]
Zhang Y, Yuan C L, Ye K, et al. Electrochim. Acta, 2014, 148:237-243 doi: 10.1016/j.electacta.2014.10.052
-
[5]
Feng Q, Yanagisawa K, Yamasaki N, et al. J. Porous Mater., 1998, 5:153-162 doi: 10.1023/A:1009657724306
-
[6]
Thackeray M M. Prog. Solid State Chem., 1997, 25:1-71 doi: 10.1016/S0079-6786(97)81003-5
-
[7]
Devaraj S, Munichandraiah N. J. Phys. Chem. C, 2008, 112: 4406-4417 doi: 10.1021/jp7108785
-
[8]
Wei C, Xu C, Li B, et al. J. Phys. Chem. Solids, 2012, 73: 1487-1491 doi: 10.1016/j.jpcs.2011.11.038
-
[9]
Li Z Q, Ding Y, Xiong Y J, et al. Cryst. Growth Des., 2005, 5:1953-1958 doi: 10.1021/cg050221m
-
[10]
Xia Y N, Yang P D, Sun Y G, et al. Adv. Mater., 2003, 15: 353-389 doi: 10.1002/adma.200390087
-
[11]
Hu J T, Odom T W, Lieber C M, et al. Acc. Chem. Res., 1999, 32:435-445 doi: 10.1021/ar9700365
-
[12]
Duan X F, Huang Y, Cui Y, et al. Nature, 2001, 409:66-69 doi: 10.1038/35051047
-
[13]
Wong E W, Sheehan P E, Lieber C M, et al. Science, 1997, 277:1971-1975 doi: 10.1126/science.277.5334.1971
-
[14]
Dubal D P, Lokhande C D. Ceram. Int., 2013, 39:415-423 doi: 10.1016/j.ceramint.2012.06.042
-
[15]
Duan Y P, Zhang J, Jing H, et al. J. Solid State Chem., 2011, 184:1165-1171 doi: 10.1016/j.jssc.2011.03.007
-
[16]
Xing L L, Cui C X, Ma C H, et al. Mater. Lett., 2011, 65: 2104-2106 doi: 10.1016/j.matlet.2011.04.093
-
[17]
Wang S Q, Zheng H, Zhang Q, et al. J. Nanopart. Res., 2014, 16:2232-2242 doi: 10.1007/s11051-013-2232-y
-
[18]
Ranjusha R, Sonia T S, Roshny S, et al. Mater. Res. Bull., 2015, 70:1-6 doi: 10.1016/j.materresbull.2015.04.012
-
[19]
Rosenberg S, Hintennach A. J. Power Sources, 2015, 274: 1043-1048 doi: 10.1016/j.jpowsour.2014.10.187
-
[20]
Su X H, Yu L, Cheng G, et al. Appl. Energy, 2014, 134:439-445 doi: 10.1016/j.apenergy.2014.08.050
-
[21]
Tang W, Hou Y Y, Wang X J, et al. J. Power Sources, 2012, 197:330-333 doi: 10.1016/j.jpowsour.2011.09.050
-
[22]
Ragupathy P, Vasan H N, Munichandraiah N, et al. J. Electrochem. Soc., 2008, 155:A34-A40 doi: 10.1149/1.2800163
-
[23]
Kim H, Popov B N. J. Electrochem. Soc., 2003, 150:D56-D62 doi: 10.1149/1.1541675
-
[24]
Xie X, Zhang C, Wu M B, et al. Chem. Commun., 2013, 49: 11092-11094 doi: 10.1039/c3cc46867d
-
[25]
Jeong Y U, Manthiram A. J. Electrochem. Soc., 2002, 149: A1419-A1422 doi: 10.1149/1.1511188
-
[26]
Ranjusha R, Sajesh K M, Roshny S, et al. Microporous Mesoporous Mater., 2014, 186:30-36 doi: 10.1016/j.micromeso.2013.11.035
-
[27]
Li Z Q, Ding Y, Xiong Y J, et al. Chem. Commun., 2005: 918-920
-
[28]
孙峰, 袁中直, 李伟善.电源技术, 2003, 27(4) 409-412SUN Feng, YUAN Zhong-Zhi, LI Wei-Shan. Chinese J. Power Sources, 2003, 27(4) 409-412
-
[29]
Zhang D, Popov B N, White R E, et al. J. Power Sources, 1998, 76:81-90 doi: 10.1016/S0378-7753(98)00143-8
-
[30]
Wang W, Yang Y, Yang S J, et al. Electrochim. Acta, 2015, 155:297-304 doi: 10.1016/j.electacta.2014.12.157
-
[1]
-

Figure 1 XRD patterns of the samples prepared at various temperatures (a) and for various times at 25 ℃ (b); (c) Crystal structure of as-prepared α-MnO2

Figure 2 SEM images of the samples: (a) α-MnO2-0 ℃-2 d, (b) α-MnO2-25 ℃-2 d, (c) α-MnO2-45 ℃-2 d, (d) α-MnO2-65 ℃-2 d, (e) α-MnO2-25 ℃-1 d, (f) α-MnO2-25 ℃-3 d, (g) α-MnO2-25 ℃-5 d; TEM images: (h) α-MnO2-25 ℃-2 d

Figure 3 Charge/discharge curves of as-prepared samples (a~g) and CV curves of α-MnO2-25 ℃-2 d (h)

Figure 4 (a) Cycling performances of the samples; (b) Coulombic efficiency of the samples; (c) Rate capacity and coulombic efficiency of α-MnO2-25 ℃-2 d at different current densities (50, 100, 500 mA·g-1)
-


 下载:
下载:


 扫一扫看文章
计量
- PDF下载量: 0
- 文章访问数: 1868
- HTML全文浏览量: 83
 下载:
下载:

