
Figure 1.
Schematic representation of the dual-amplification system for colorimetric DNA detection.

The development of sensitive and simple methods for detecting ultralow concentrations of specific nucleic acid sequences have attracted substantial research efforts due to their broad applications in virus detection, transgenic detection, and early diagnosis of diseases [1-4]. Up to now, a number of highly sensitive sensors have been developed, such as polymerase chain reaction (PCR) [5, 6], helicase-dependent amplification (HDA) [7, 8], ligase chain reaction (LCR) [9, 10], rolling circle amplication (RCA) [11-13], strand displacement amplification (SDA) [14, 15], exonucleaseassisted amplication [16-18]. Although these nucleic acid amplification techniques exhibit high amplification efficiency, many of them are enzyme-based sensors, which may greatly increase the complexity, and restrict their universal application. Recently, some enzyme-free methods [19-21] have been developed for low-cost and simple detection of nucleic acids. One of these methods, hybridization chain reaction (HCR), which is proposed by Dirks and Pierce in 2004 [22], has emerged as a promising method in biosensing. In HCR, the hybridization events are triggered by an initiator and then formed a nicked double helix with tens to hundreds of repeated units, which brings an excellent isothermal amplification process [23, 24]. Based on this technology, Tan's group [25] reported a fluorescence biosensor for DNA detection with dual-labeled pyrene moieties at each end of auxiliary probes H1 and H2. In the presence of the target, auxiliary probes H1 and H2 can be assembled into nicked double-stranded DNA structures, making pyrene-modified probes close to each other. Recently, HCRamplified colorimetric methods have developed for nucleic acids detection [26, 27], due to their low cost, easy operation, and practicality [28-30]. Wang's group [26] developed a label-free analysis for a visual detection of DNA based on the different electrostatic interactions of dsDNA and ssDNA towards unmodified gold nanoparticles (AuNPs). The AuNPs-based methods [31, 32], although they present distinct advantages, also have some limitations, such as complex synthesis process and not sensitive enough for trace DNA detection.
Therefore, developing ultrasensitive colorimetric assay is important. The assembly of protein is a simple signal amplification strategy, which relies on the cross-linking of avidin and biotinylated protein. Recently, Carey [33] has demonstrated a sensitive colorimetric method that utilizes the recognition event between biotin and streptavidin. The layer by layer assembly of horseradish peroxidase (HRP)-taged protein causes the formation of a large polymer, which can produce color change when HRP reacts with 3, 3', 5, 5'-tetramethylbenzidine (TMB) in the presence of H2O2.
Inspired by these technologies, we designed a dual-amplification method for colorimetric detection of DNA based on the assembly of DNA and protein. In this work, a human immunodeficiency virus (HIV) oligonucleotide sequence was used as a model probe. The amplification was realized by the enrichment of horseradish peroxidase labeled streptavidin (HRP-SA)through the assembly of biotinylated DNA and protein. This method cannot only determine the target by UV–vis absorbance but also be realized by variation of the color. In addition, it can be expanded to detect other molecules with a reasonable design of the corresponding DNA sequences, such as aptamer.
The principle of this dual-amplification system for colorimetric DNA detection was shown in Fig. 1. The 96-well microplate was firstly attached with SA and blocked with 10% BSA to prevent nonspecific adsorption. The capture DNA, which could hybridize with the THIV, was added. Then, different concentrations of THIV were incubated, followed by the addition of linker DNA. The 30 end of linker DNA was complementary with the 50 end of the target DNA and the 50 end of linker DNA was complementary with the 30 end of H1. The 50 exposed end of H1 could hybridize with the 30 end of H2 and the exposed 50 end of H2 could hybridize with another H1. In this way, the self-assembly of DNA was initiated. After that, the assembly of HRP-SA and Bio-BSA was performed at a node of DNA assembled products. Subsequently, the added TMB was oxidized by H2O2 and produced colored products. The concentration of the target DNA could be determined by monitoring the change of the UV–vis absorbance and the color of the solution.
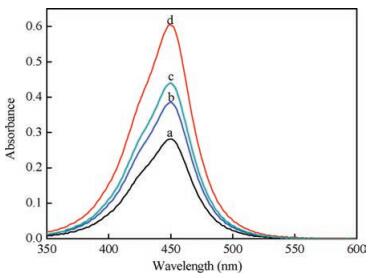
The feasibility of this proposed strategy was performed first and the results were shown in Fig. 2. Without the assembled products, the UV–vis absorbance intensity was weak (Fig. 2, curve a). The sensing system exhibited strong absorbance when only the products of the assembly proteins (Fig. 2, curve b) or DNA (Fig. 2, curve c) involved. Additionally, a stronger absorbance peak appeared when the assembly of DNA and protein (Fig. 2, curve d) were both present.
To further confirm the feasibility of this sensor, the electrophoresis was carried out. The bands in lane d (Fig. S1A in Supporting information) showed the products formed by the self-assembled DNA. Fig. S1 B in Supporting information showed the products by the assembly of proteins. In the presence of the assembled products, a slow migration was observed. As a comparison, there was only one band or no migration was exhibited when Bio-BSA or HRP-SA was present.
To achieve optimal sensing performance, we investigated the influence of different experimental conditions including the concentrations of H1 and H2, the ratio of HRP-SA/Bio-BSA and incubation time. As shown in Fig. S2 in Supporting information, the relative UV–vis absorbance intensity was increased at first with the variation of the concentrations, and leveled off after 0.25 μmol/L. So, 0.25 μmol/L H1/H2 was selected as the best one. The hybridization time of H1 and H2 was studied (Fig. S3 in Supporting information) and 2.0 h was chosen as the optimal hybridization time. Besides, the ratio of Bio-BSA and HRP-SA was optimized and the results were shown in Fig. S4 in Supporting information. It was observed that ΔA was greater when the ratio was 1:2. Fig. S5 in Supporting information indicated the reaction time between BioBSA and HRP-SA, which could be completed in about 2 h. Therefore, the optimal ratio of Bio-BSA and HRP-SA was 1:2 and the incubation time for protein assembly was 2 h.
We then assessed the sensitivity of this dual-amplification method. Fig. 3A showed UV–vis absorption spectra of this sensing system in the presence of different concentrations of the THIV. The plot of the absorbance intensity versus THIV concentration was also shown in Fig. 3B. A good linear relationship was obtained under the optimal conditions. The linear range is from 2 pmol/L to 200 pmol/L with the linear equation y = 0.1904 + 0.0023x, where y is the UV–vis absorbance intensity and x is the concentration of THIV (R2 = 0.9924). The limit of detection (LOD) for the target THIV was 1.75 pmol/L (3σ).

Fig. 3A (inset) displayed the image for the detection of THIV at different concentrations by the naked eye. The colorimetric results correlated well with the UV–vis absorbance intensity. The image also proved the sensitivity of this method for 25 pmol/L THIV could be readily detected by the naked eye. The sensitivity was compared to the reported methods and the results were listed in Table S2. This sensitivity exceeded most of previously colorimetric methods [26, 33-35]. Compared with the homogeneous assays [36, 37], this proposed method not only effectively avoided the interference of non-target in homogeneous solution but also could provide a competitive sensitivity. Although the RCA-based fluorescence method showed high sensitivity for DNA determination [38], the phi 29 DNA polymerase (New England Biolabs, England) was costly, which might limited its application. The relative standard deviation (RSD) was 0.86% for seven parallel measurements at concentration of 25 pmol/L, which indicated the acceptable reproducibility of this biosensor.
Next, the selectivity of this system has been evaluated by comparing the relative UV–vis absorbance intensity of target DNA with single-base mismatched target DNA (MT1) and two-base mismatched target DNA (MT2). The results were shown in Fig. 4, the relative UV–vis absorbance intensity was greater when the target DNA was present. However, the addition of the mismatched targets led to very slight UV–vis absorbance intensity increase due to the weak hybridization of mismatched targets with capture DNA and linker DNA. Meanwhile, the colorimetric results also matched well with the UV-absorbance intensity, which also convinced the high specificity of this sensor.

Finally, we tested the performance of this assay in complex matrixes. The 1% serum samples were spiked with different concentrations of target DNA. As shown in Fig. S6 in Supporting information, there was no obvious difference between the UV–vis absorbance intensity obtained from serum sample and those in buffer solution, indicating the potentiality of this proposed method for DNA detection in real biological samples.
In conclusion, a dual-amplification biosensor for the detection of DNA was constructed based on the assembly of DNA and protein. This biosensor is of high sensitivity and selectivity. Besides, the results show that the detection limit for the target THIV was 1.75 pmol/L, which is mainly attributed to the enrichment of HRP. This method is applied to detect target in human serum with good result. Moreover, this proposed method could be extended to the detection of other molecules with a reasonable design of the corresponding DNA sequences.with a detection limit of 1.75 pmol/ L. Besides, this method is capable of detecting target DNA in complicated biological samples such as human serum and does not require any power or complicated instrumentation. Moreover, this simple and highly sensitive colorimetric method has the potential to provide a wide range of approaches for medical diagnosis and biotechnology through utilization of different recognition elements such as aptamers, antibody and peptide.
This work was supported by the National Science Foundation of China (No. 21205089).
Supplementary data associated with this article can be found, in the online version, at doi: 10.1016/j.cclet.2017.10.013.
A.A. Lubin, K.W. Plaxco, Acc. Chem. Res. 43(2010) 496-505. doi: 10.1021/ar900165x
D. Li, S. Song, C. Fan, Acc. Chem. Res. 43(2010) 631-641. doi: 10.1021/ar900245u
X.B. Mou, Z. Ali, B. Li, et al., Chin. Chem. Lett. 27(2016) 1661-1665. doi: 10.1016/j.cclet.2016.04.005
E.H. Turner, S.B. Ng, D.A. Nickerson, J. Shendure, Annu. Rev. Genomics Hum. Genet. 10(2009) 263-284. doi: 10.1146/annurev-genom-082908-150112
L. Zhang, Y.H. Wu, J. Li, et al., Anal. Biochem. 514(2016) 55-63. doi: 10.1016/j.ab.2016.09.001
F. Feng, L. Liu, S. Wang, Nat. Protocols 5(2010) 1255-1264. doi: 10.1038/nprot.2010.79
M. Vincent, Y. Xu, H. Kong, EMBO Rep. 5(2004) 795-800. doi: 10.1038/sj.embor.7400200
F. Kivlehan, F. Mavré, L. Talini, B. Limoges, D. Marchal, Analyst 136(2011) 3635-3642. doi: 10.1039/c1an15289k
S. Bi, Z.P. Zhang, Y. Dong, Z.H. Wang, Biosens. Bioelectron. 65(2015) 139-144. doi: 10.1016/j.bios.2014.10.025
Y.Y. Sun, X.H. Lu, F.X. Su, et al., Biosens. Bioelectron. 74(2015) 705-710. doi: 10.1016/j.bios.2015.07.028
G.J. Zhao, T.Y. Hu, J. Li, et al., Chem. Commun. 50(2014) 11930-11933. doi: 10.1039/C4CC05314A
A. Chen, S.Y. Ma, Y. Zhuo, Y.Q. Chai, R. Yuan, Anal. Chem. 88(2016) 3203-3210. doi: 10.1021/acs.analchem.5b04578
M.M. Ali, F. Li, Z. Zhang, et al., Chem. Soc. Rev. 43(2014) 3324-3341. doi: 10.1039/c3cs60439j
J.P. Zhang, C. Li, X. Zhi, et al., Anal. Chem. 88(2016) 1294-1302. doi: 10.1021/acs.analchem.5b03729
A. Chen, G.F. Gui, Y. Zhuo, et al., Anal. Chem. 87(2015) 6328-6334. doi: 10.1021/acs.analchem.5b01168
F.L. Zhou, B.X. Li, Anal. Chem. 87(2015) 7156-7162. doi: 10.1021/acs.analchem.5b00993
H.S. Yin, Z.Q. Yang, B.C. Li, Y.L. Zhou, S.Y. Ai, Biosens. Bioelectron. 66(2015) 266-270. doi: 10.1016/j.bios.2014.11.026
X. Xiang, J.B. Shi, F.H. Huang, et al., Biosens. Bioelectron. 74(2015) 227-232. doi: 10.1016/j.bios.2015.06.045
J.B. Li, P.H. Lei, S.J. Ding, et al., Biosens. Bioelectron. 77(2016) 435-441. doi: 10.1016/j.bios.2015.09.069
Y. Zhang, Y.R. Yan, W.H. Chen, et al., Biosens. Bioelectron. 68(2015) 343-349. doi: 10.1016/j.bios.2015.01.026
C.Y. Tao, Y.R. Yan, H. Xiang, et al., Chem. Commun. 51(2015) 4220-4222. doi: 10.1039/C5CC00385G
R.M. Dirks, N.A. Pierce, Proc. Natl. Acad. Sci. U. S. A. 101(2004) 15275-15278. doi: 10.1073/pnas.0407024101
S. Venkataraman, R.M. Dirks, P.W.K. Rothemund, E. Winfree, N.A. Pierce, Nat. Nanotechnol. 2(2007) 490-494. doi: 10.1038/nnano.2007.225
P. Yin, H.M.T. Choi, C.R. Calvert, N.A. Pierce, Nature 451(2008) 318-322. doi: 10.1038/nature06451
J. Huang, Y. Wu, Y. Chen, et al., Angew. Chem. Int. Ed. 50(2011) 401-404. doi: 10.1002/anie.201005375
P. Liu, X. Yang, S. Sun, et al., Anal. Chem. 85(2013) 7689-7695. doi: 10.1021/ac4001157
M. Rana, M. Balcioglu, M. Kovach, et al., Chem. Commun. 52(2016) 3524-3527. doi: 10.1039/C5CC09910B
Y. Song, W. Wei, X. Qu, Adv. Mater. 23(2011) 4215-4236. doi: 10.1002/adma.201101853
H. Hu, J.Y. Zhang, Y. Ding, et al., Anal. Chem. 89(2017) 5101-5106. doi: 10.1021/acs.analchem.7b00666
X.F. Zhang, C.P. Huang, S.X. Xu, et al., Chem. Commun. 51(2015) 14465-14468. doi: 10.1039/C5CC06105A
M.H. Mashhadizadeh, R.P. Talemi, Chin. Chem. Lett. 26(2015) 160-166. doi: 10.1016/j.cclet.2014.09.004
A.M. Mohammed, Chin. Chem. Lett. 27(2016) 801-806. doi: 10.1016/j.cclet.2016.01.013
Y.W. Chu, B.Y. Wang, H.S. Lin, et al., Chem. Commun. 49(2013) 2397-2399. doi: 10.1039/c2cc38233d
X.L. Zhu, H.H. Zhang, C. Feng, Z.H. Ye, G.X. Li, RSC Adv. 4(2014) 2421-2426. doi: 10.1039/C3RA44033H
J. Liu, Y. Lu, Adv. Mater. 18(2006) 1667-1671. doi: 10.1002/(ISSN)1521-4095
W.W. Chen, X.E. Fang, H. Li, H.M. Cao, J.L. Kong, Biosens. Bioelectron. 94(2017) 169-175. doi: 10.1016/j.bios.2017.02.025
Y. Tao, Y. Lin, J. Ren, X. Qu, Biomaterials 34(2013) 4810-4817. doi: 10.1016/j.biomaterials.2013.03.039
C. Su, Y.F. Liu, T. Ye, et al., Anal. Chim. Acta 853(2015) 495-500. doi: 10.1016/j.aca.2014.10.027

Figure 1 Schematic representation of the dual-amplification system for colorimetric DNA detection.

Figure 2 UV–vis absorption spectra under different conditions: (a) Linker DNA + THIV + capture DNA; (b) Linker DNA + THIV + capture DNA + HRP-SA + Bio-BSA; (c) Linker DNA + THIV + capture DNA + H1 + H2; (d) Linker DNA + THIV + capture DNA + H1+ H2 + HRP-SA + Bio-BSA.

Figure 3 (A) UV–vis absorption spectra of this system in response to different concentrations of THIV. Inset: color responses of this system with different concentrations of THIV. (B) The linear relationship between the UV–vis absorbance intensity and the concentration of the target DNA.

Figure 4 Selectivity of this system for complementary target DNA (Target) compared to single-base mismatched target (MT1) and two-base mismatched target (MT2). Inset: color responses of this sensing system in the presence of 25 pmol/L complementary target DNA, single-base mismatched target, two-base mismatched target.

 扫一扫看文章

扫一扫关注我们
 DownLoad:
 下载:
下载: